by Lara | Dec 23, 2020 | Public Analysis, TLT
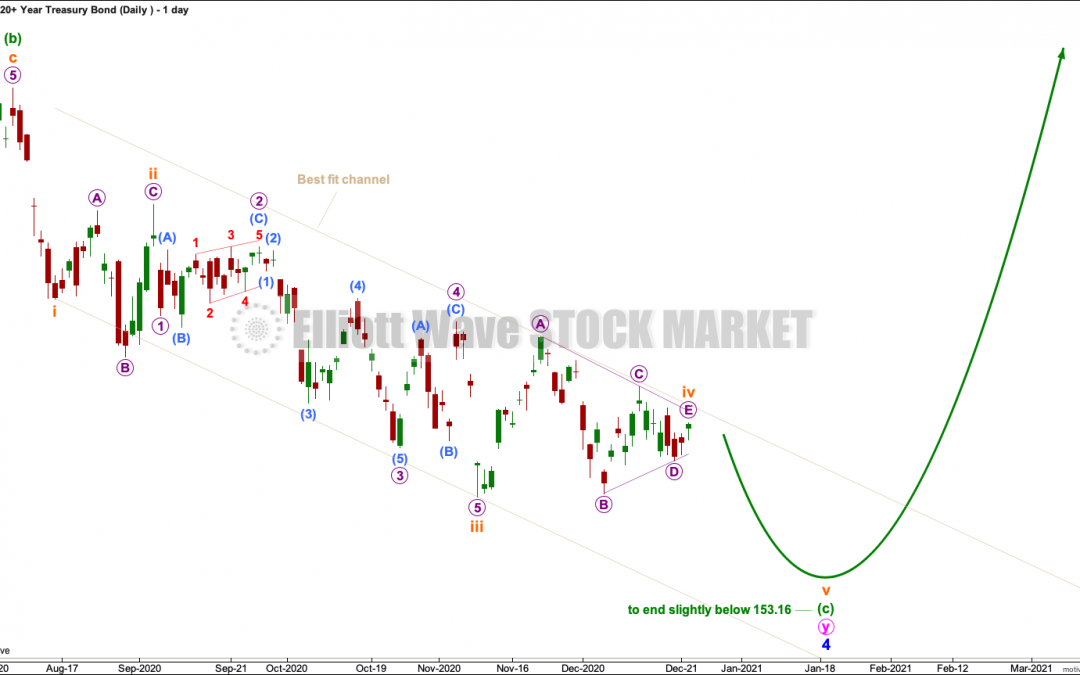
TLT: Elliott Wave and Technical Analysis | Charts – December 23, 2020 Summary: For the short term, more downwards movement may be expected to make at least a slight new low below 153.16. Thereafter, the bull market may resume. ELLIOTT WAVE COUNT MONTHLY CHART Click...
by Lara | Jul 25, 2020 | Public Analysis, Russell 2000, Russell 2000 Historical
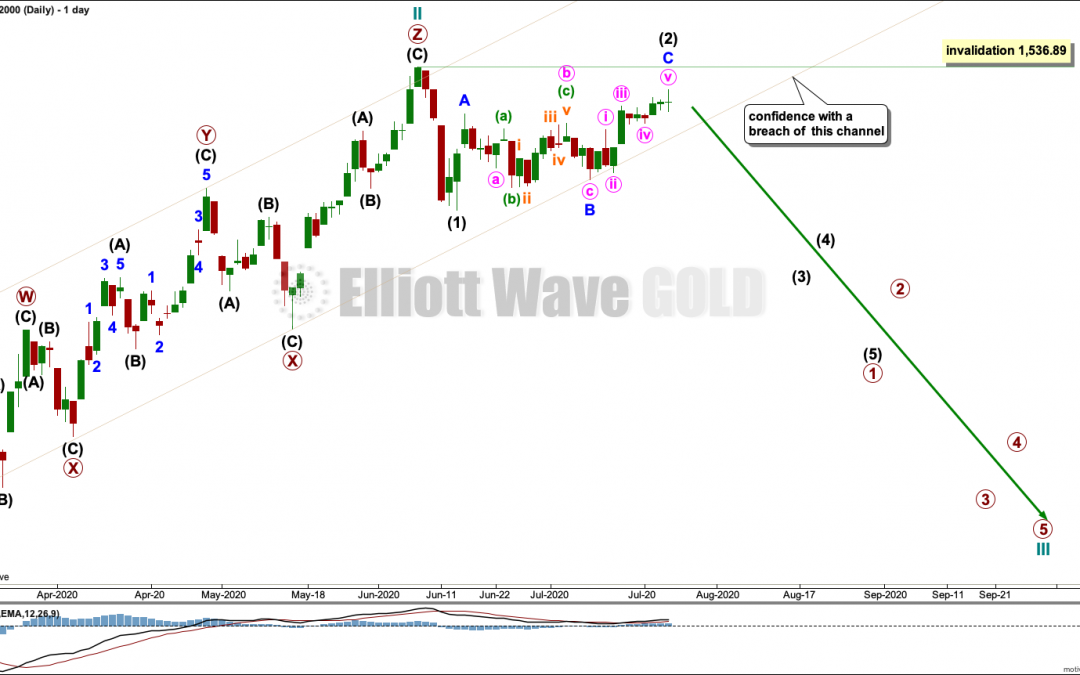
Russell 2000: Elliott Wave Analysis | Charts – July 24, 2020 The bounce may be over. Summary: A target for a third wave down is at 326. The channel on the daily chart must be breached for any confidence in this view. A new high above 1,715.08 would indicate a more...
by Lara | Jul 17, 2020 | Public Analysis, TSLA
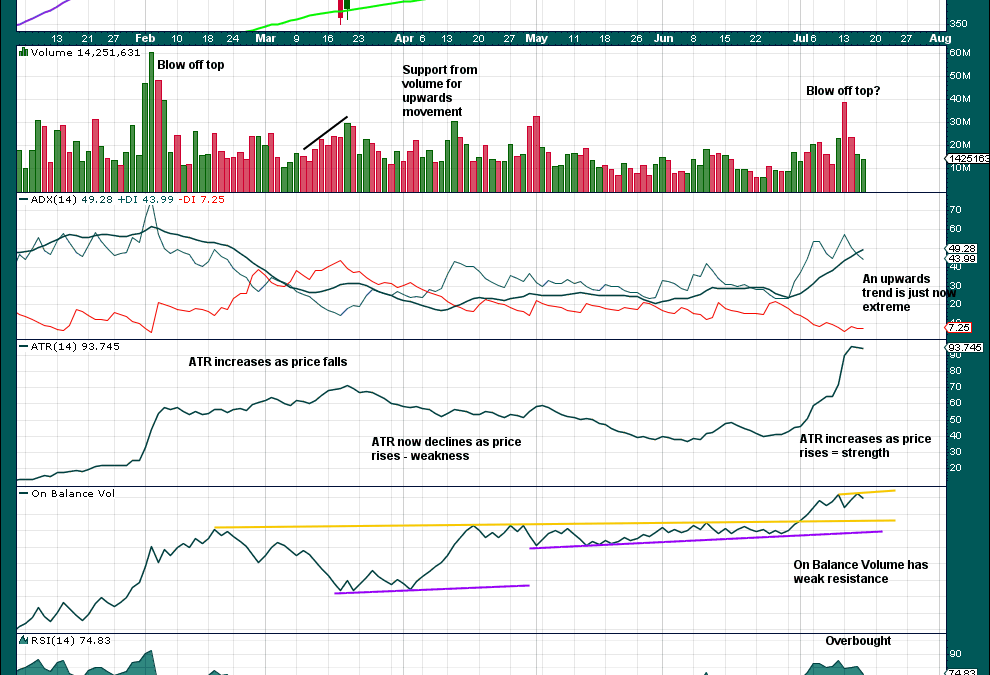
TSLA: Technical Analysis | Charts – July 16, 2020 Summary: While price remains above 1,228, it may be safest to assume the upwards trend remains intact. A target calculated from a pennant pattern is at 2,393. MONTHLY CHART Click chart to enlarge. Longer-term bearish...
by Lara | May 13, 2020 | Public Analysis, TYX
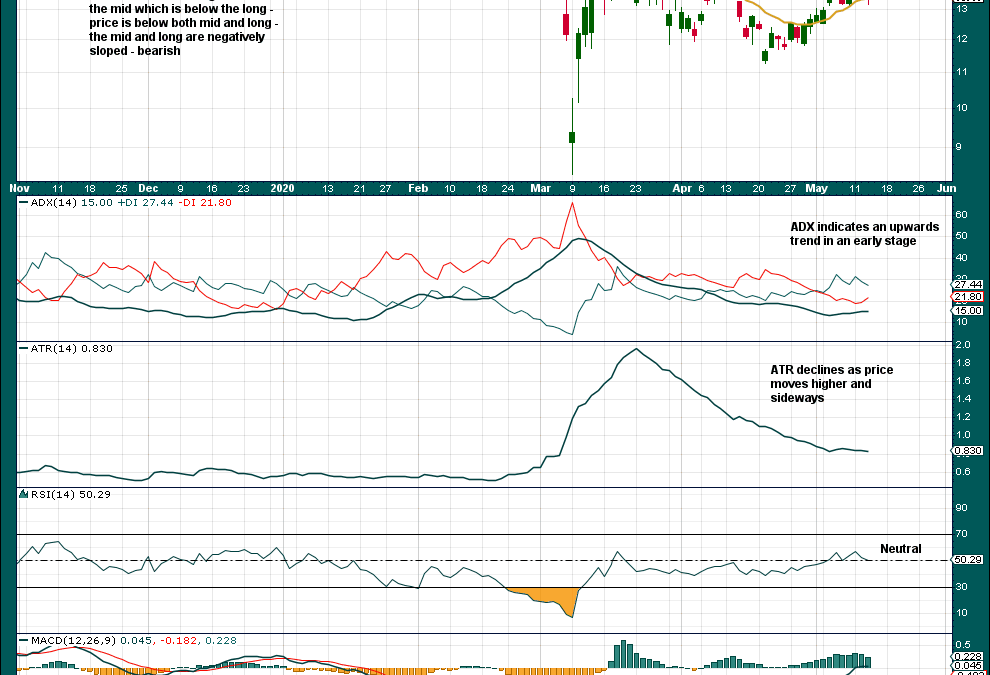
TYX: Elliott Wave and Technical Analysis | Charts – May 13, 2020 TYX is in a downwards trend at the monthly and quarterly time frames. Summary: A counter trend movement may continue for some months. A target is at 2.23. Thereafter, a larger downwards trend may resume...
by Lara | May 3, 2020 | CCJ, Public Analysis
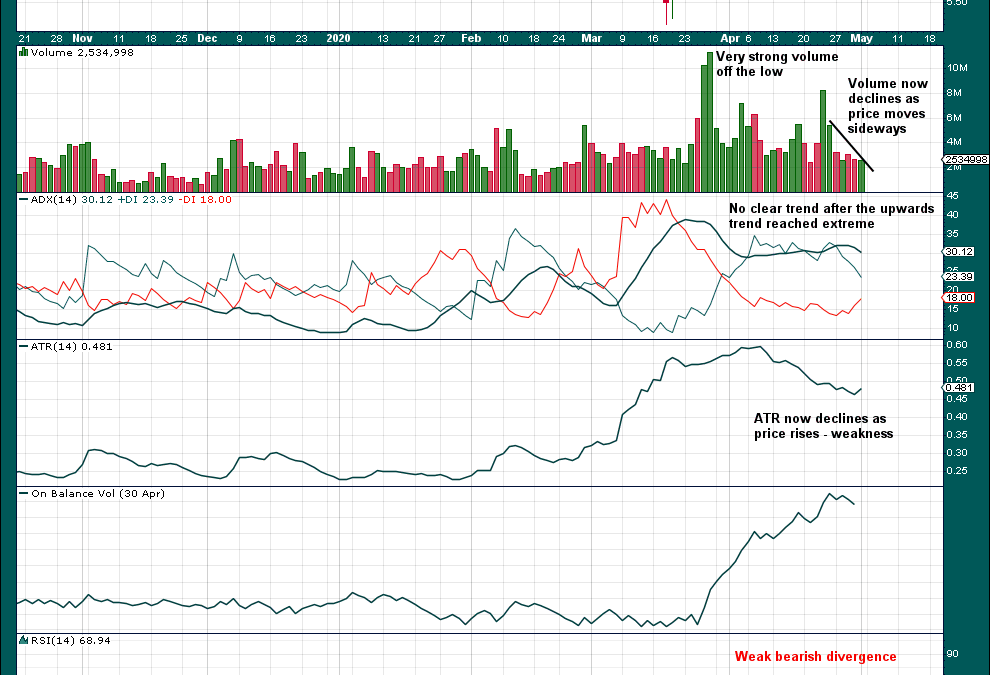
CCJ: Technical Analysis | Charts – May 1, 2020 There is reasonable risk here for CCJ for more downwards movement. Summary: A new low below 6.52 would indicate a bounce may be over. However, expect more upwards movement for the short term while price remains above...

by Lara | Apr 23, 2020 | Public Analysis, TSLA
TSLA: Technical Analysis | Charts – April 23, 2020 It is possible that TSLA may have a sustainable high in place. Summary: There is reasonable risk here of more downwards movement. A new low below 652 would indicate a bounce may be over. However, expect more upwards...
by Lara | Apr 23, 2020 | NVDA, Public Analysis
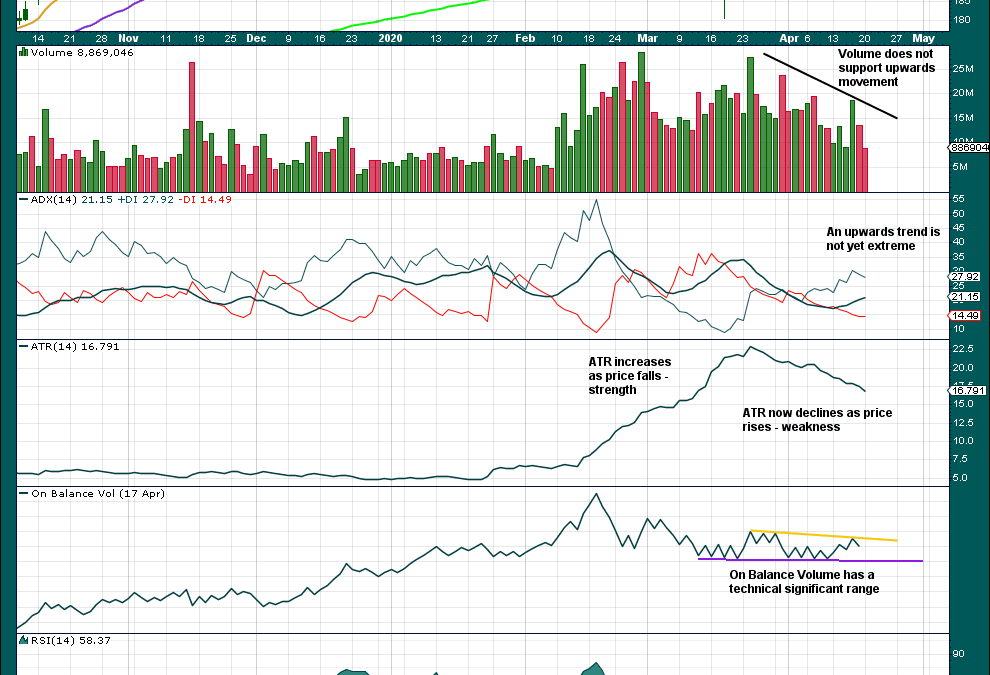
NVDA: Technical Analysis | Charts – April 23, 2020 For the short term, expect more upwards movement while price remains above 284.17. Summary: There is enough weakness at the all time high and in this upwards movement, and strength in prior downwards movement, to...
by Lara | Apr 16, 2020 | Micron, Public Analysis
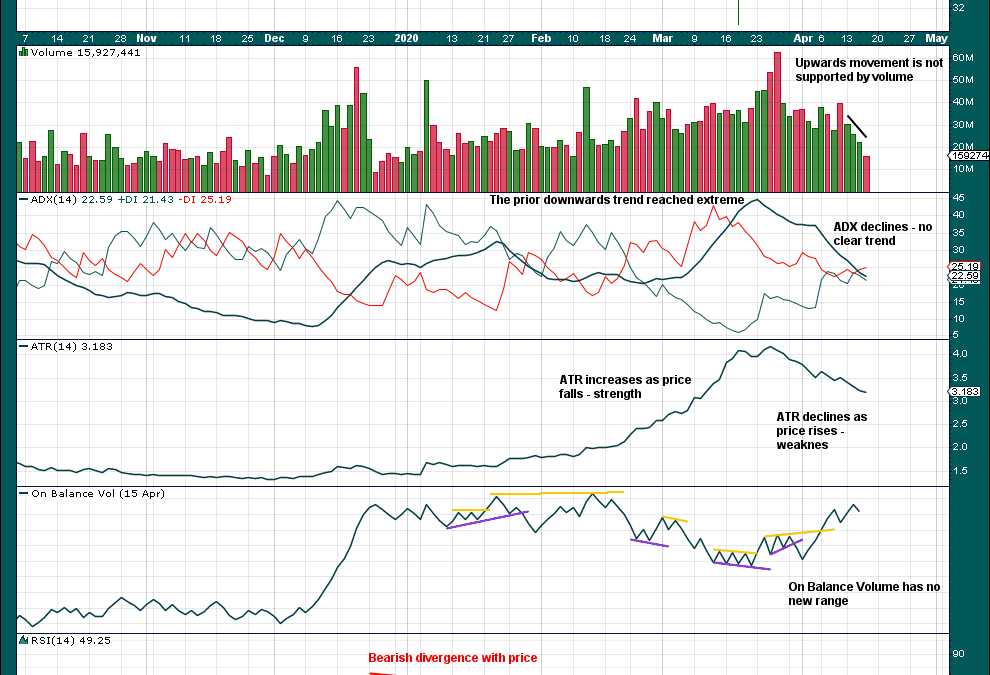
MU: Technical Analysis | Charts – April 16, 2020 The larger picture is bullish, but the short-term picture suggests a possible change to a bear market. Summary: For the short term, a bounce may be over. A close below the prior major swing low at 28.39 may indicate a...
by Lara | Apr 15, 2020 | Apple, Apple Historical, Public Analysis
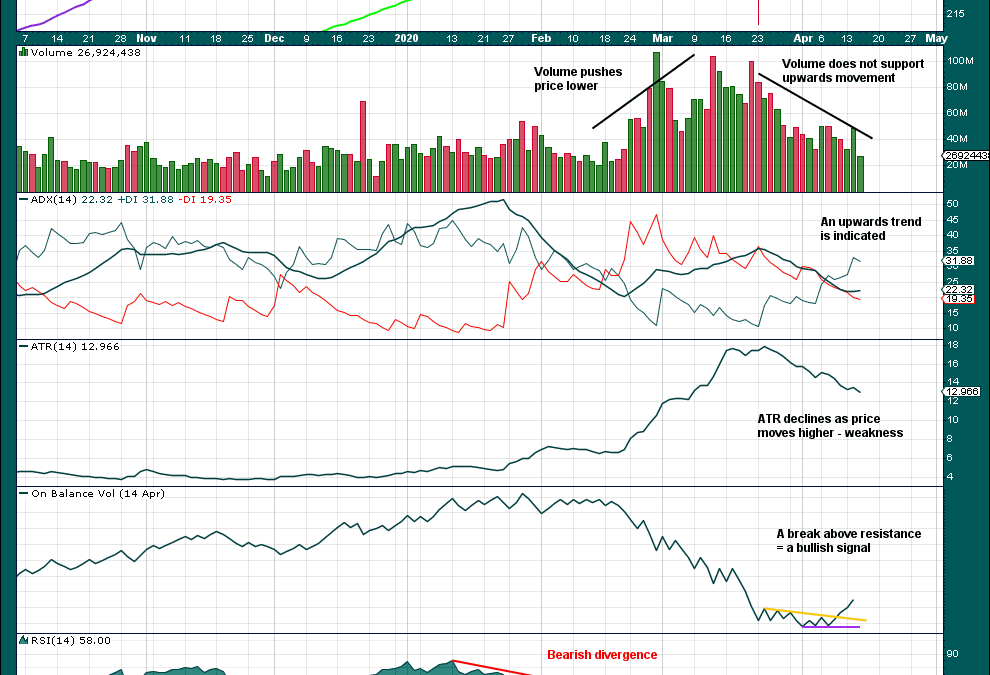
AAPL: Technical Analysis | Charts – April 15, 2020 Overall, AAPL looks bullish. A new all time high would reinforce this view. Summary: Assume upwards movement while the last gap remains open and there is no bearish reversal pattern on the daily chart. However, at the...


