
NVDA: Technical Analysis | Charts – April 23, 2020
For the short term, expect more upwards movement while price remains above 284.17.
Summary: There is enough weakness at the all time high and in this upwards movement, and strength in prior downwards movement, to indicate a high risk that NVDA may move into a bear market.
MONTHLY CHART
Click chart to enlarge.
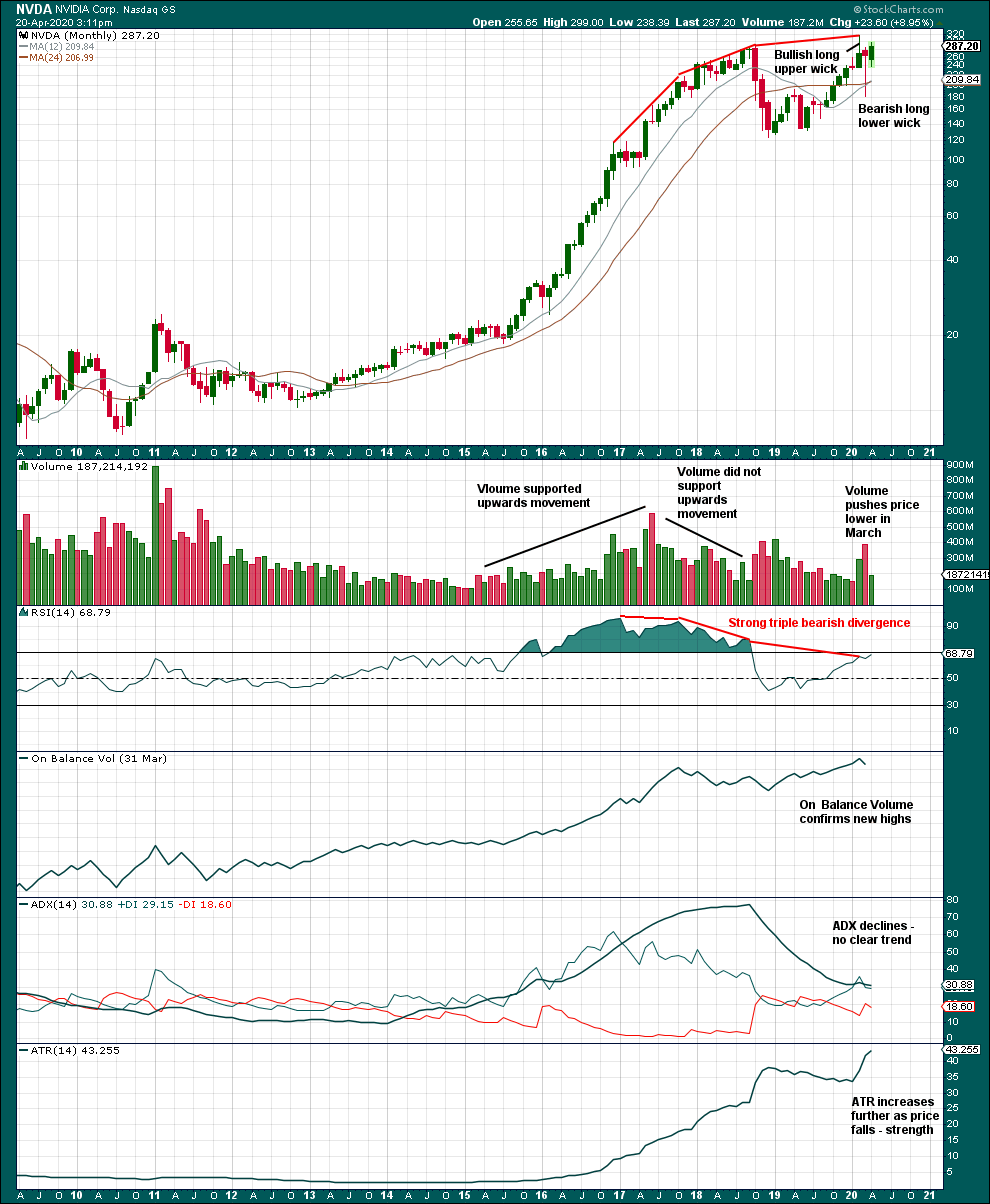
The prior bull market reached very extreme and there exhibited strong triple bearish divergence between price and RSI, after RSI reached deeply overbought. Risk that price moves into a bear market is possible here. There is strength in downwards movement for March.
WEEKLY CHART
Click chart to enlarge.
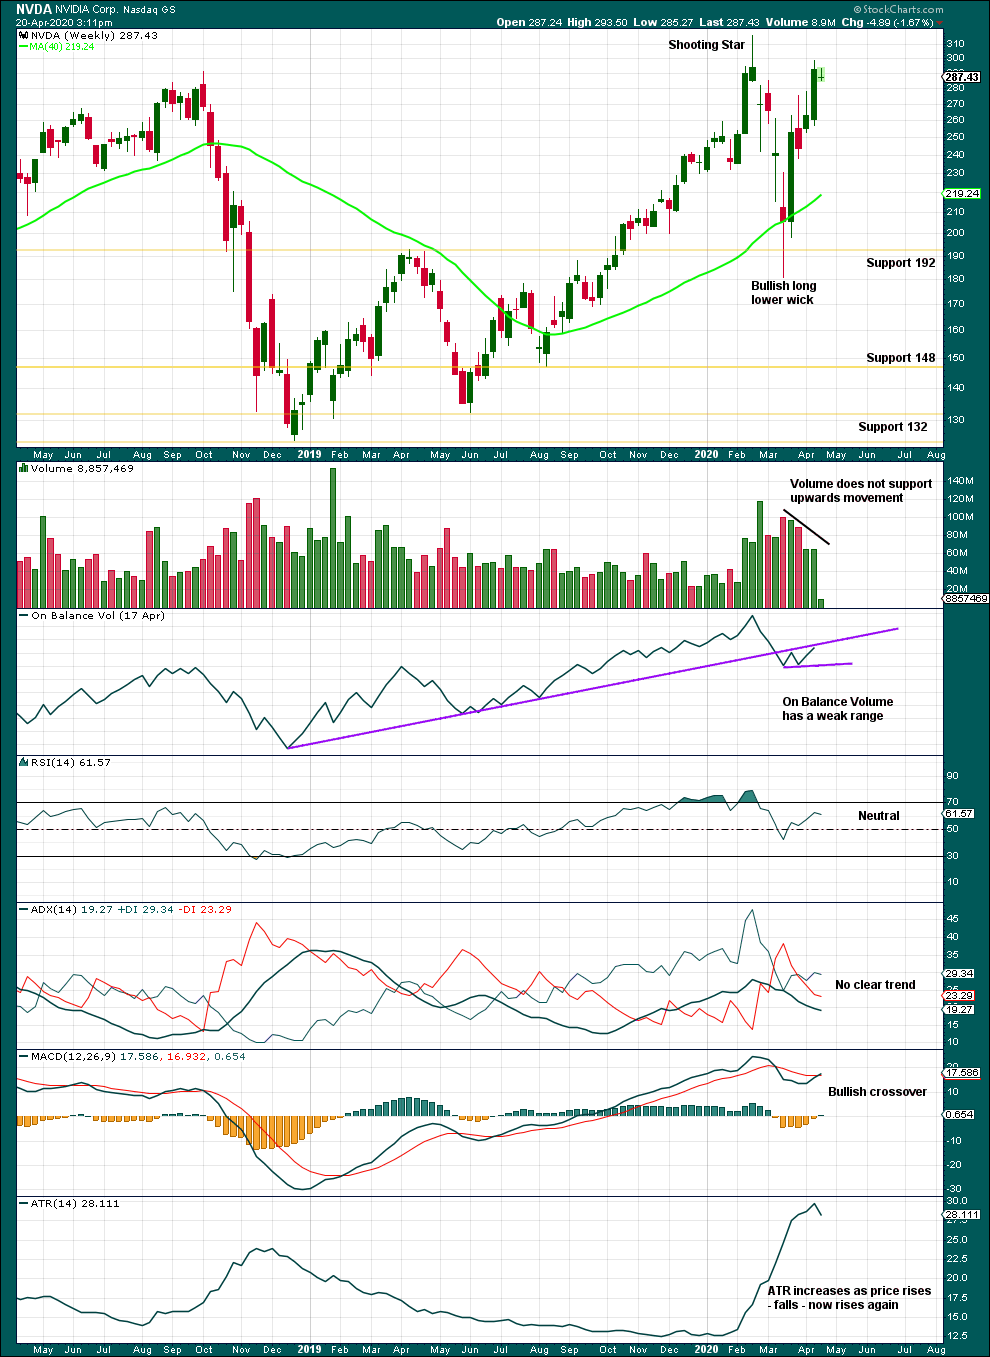
Although upwards movement does look a little weak, the overall picture is unclear at this time frame.
DAILY CHART
Click chart to enlarge.
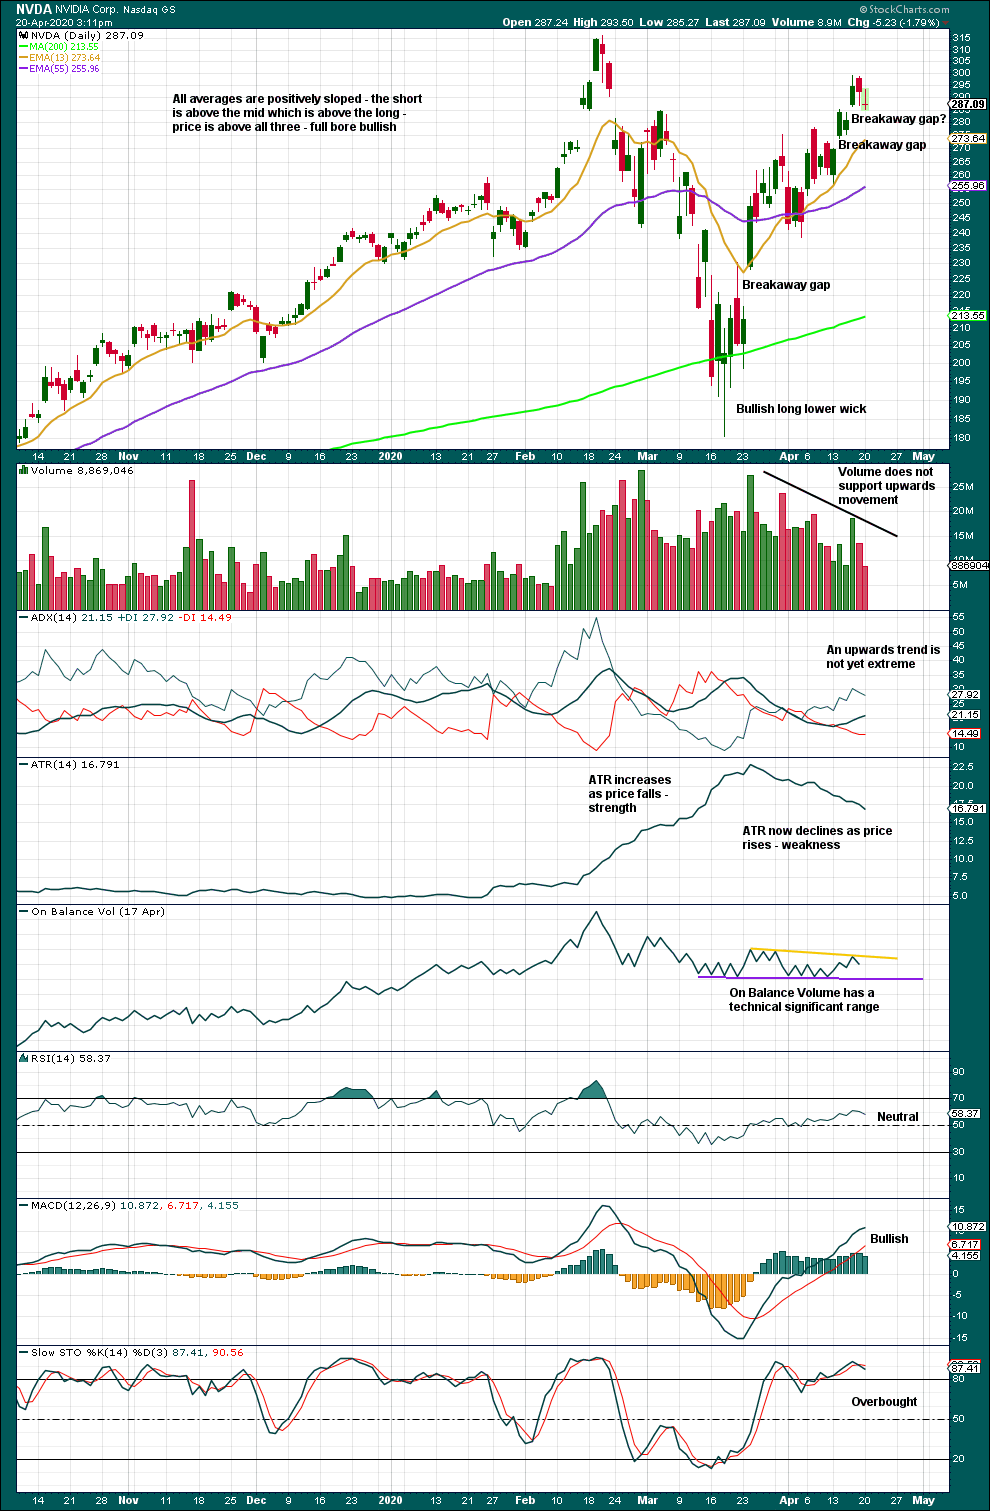
If the last gap remains open at 284.17, then the short-term picture may remain bullish.
Upwards movement lacks range and support from volume. It looks more clearly weak at this time frame. This bounce may be a counter trend movement.
Watch On Balance Volume for a breakout.
Published @ 06:45 p.m. EST.
—
Careful risk management protects your trading account(s).
Follow my two Golden Rules:
1. Always trade with stops.
2. Risk only 1-5% of equity on any one trade.
—
New updates to this analysis are in bold.