
AAPL: Technical Analysis | Charts – April 15, 2020
Overall, AAPL looks bullish. A new all time high would reinforce this view.
Summary: Assume upwards movement while the last gap remains open and there is no bearish reversal pattern on the daily chart.
However, at the monthly chart level, there is weakness in volume for this bull market and long term bearish divergence. AAPL may be vulnerable here to a fully fledged bear market. This analysis would switch to bearish if a new swing low below 212.61 is made, and then a breach of the blue support line on the monthly chart.
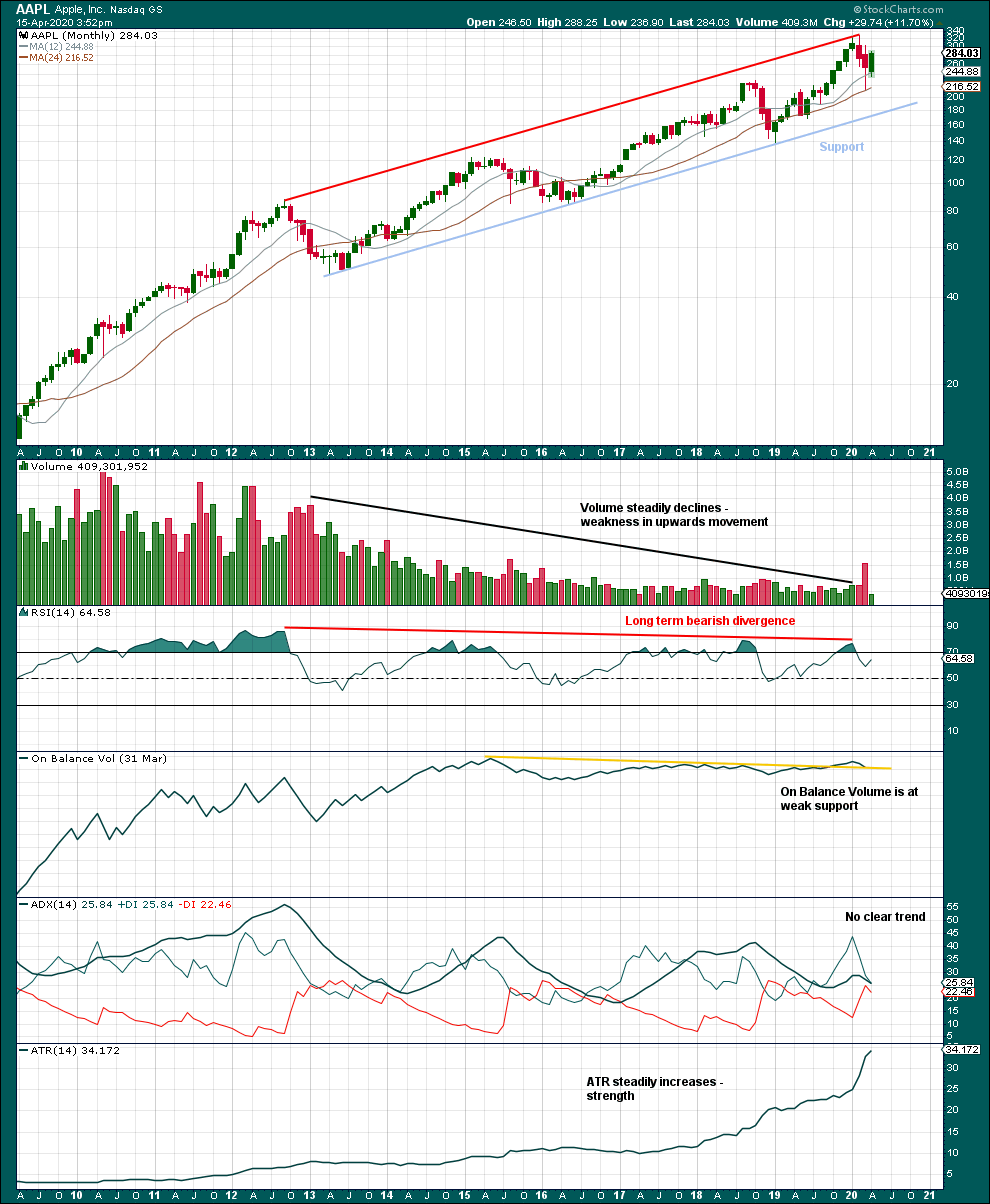
MONTHLY CHART
Click chart to enlarge.
Price may remain in an upwards trend. The last completed monthly candlestick for March has a bullish long lower wick.
However, strong volume for March suggests downwards movement may continue further here. Look for support at the light blue trend line. If that line is breached, then AAPL may be in a bear market.
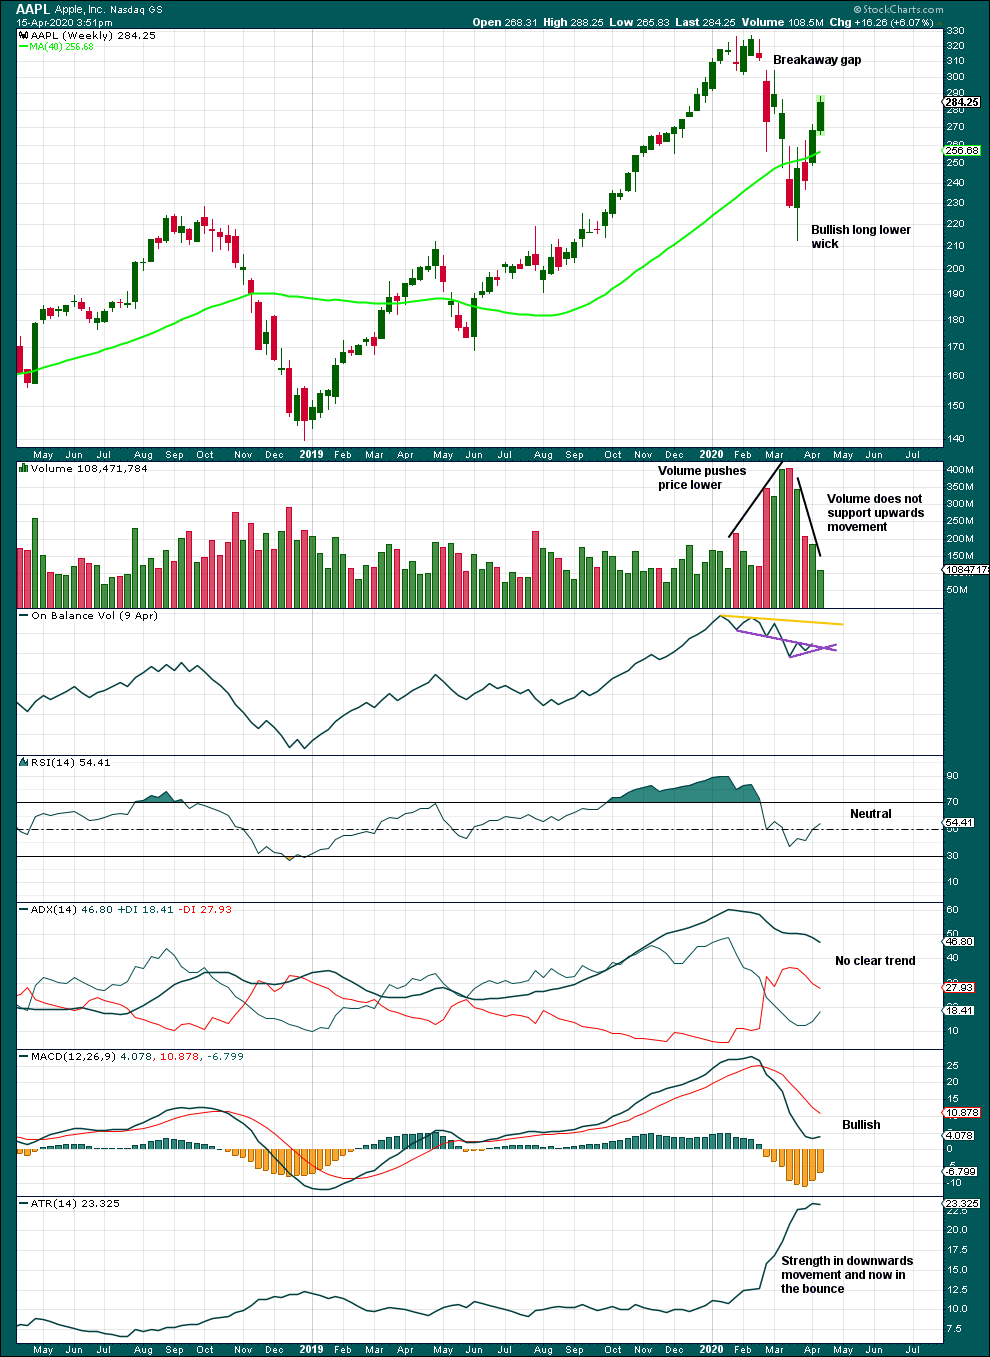
WEEKLY CHART
Click chart to enlarge.
Upwards movement of the last two weeks has good range, but this upwards movement may be considered with some suspicion as it lacks support from volume.
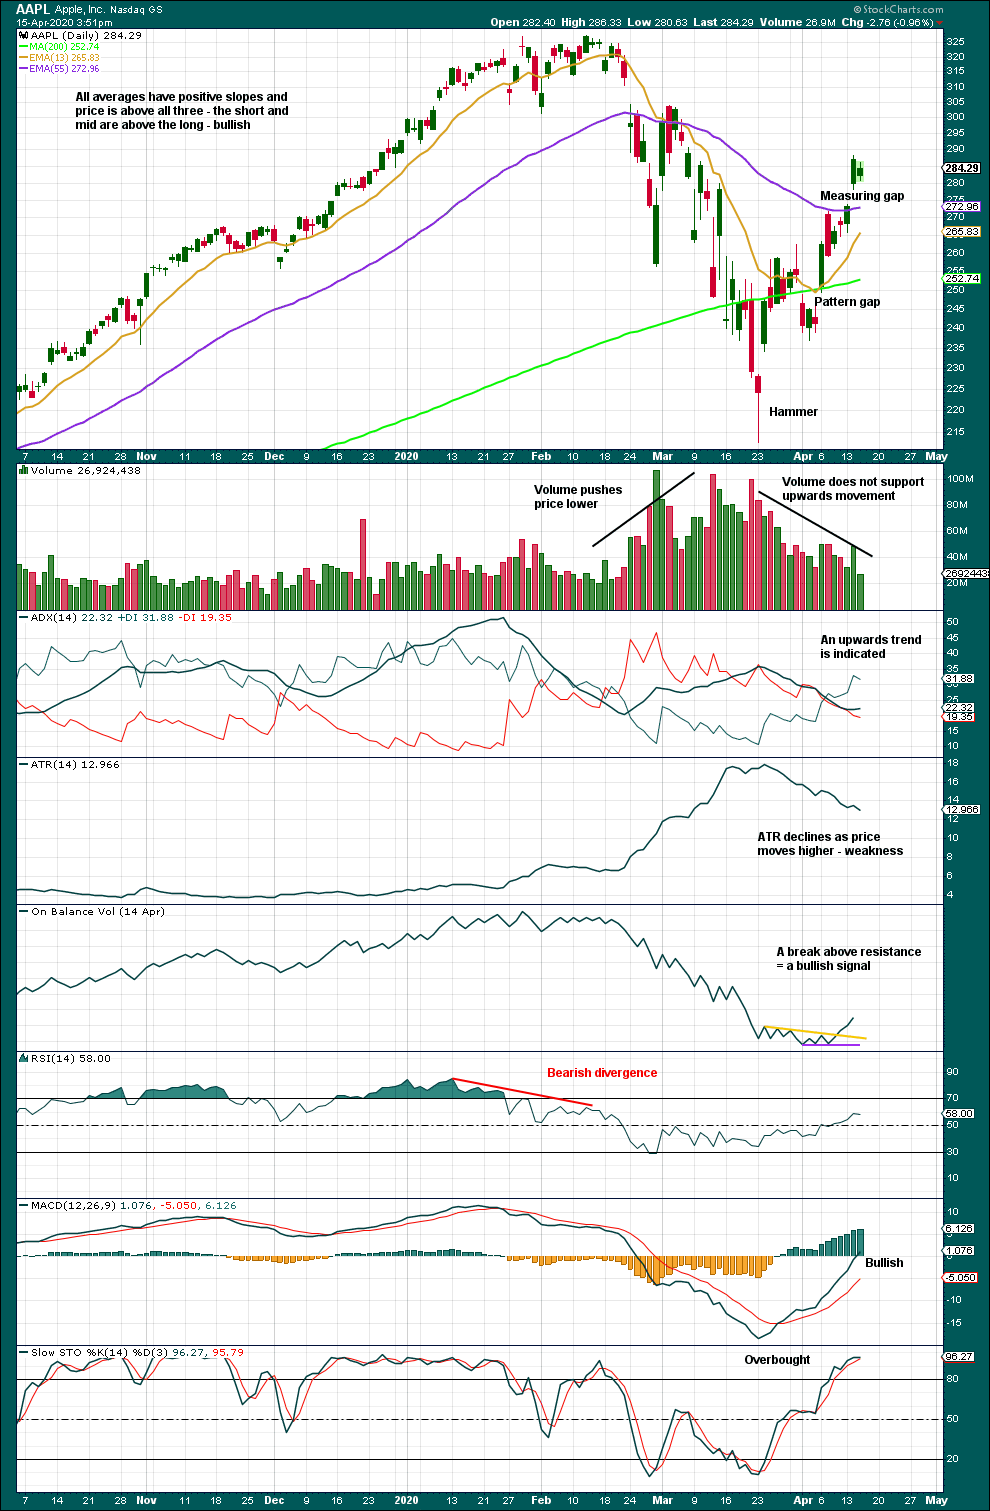
DAILY CHART
Click chart to enlarge.
A target calculated from the measuring gap is at 302.37.
The trend at this time frame is upwards. There is no bearish candlestick reversal pattern to indicate a trend change. Assume the trend remains the same until proven otherwise. Proven otherwise may be either a bearish candlestick reversal pattern or closure of the measuring gap with a new low below 273.70.
A new swing low below the prior low at 212.61 would be a strong bearish signal.
Published @ 07:15 p.m. EST.
—
Careful risk management protects your trading account(s).
Follow my two Golden Rules:
1. Always trade with stops.
2. Risk only 1-5% of equity on any one trade.
—
New updates to this analysis are in bold.