
TLT: Elliott Wave and Technical Analysis | Charts – December 23, 2020
Summary: For the short term, more downwards movement may be expected to make at least a slight new low below 153.16. Thereafter, the bull market may resume.
ELLIOTT WAVE COUNT
MONTHLY CHART
Click chart to enlarge.
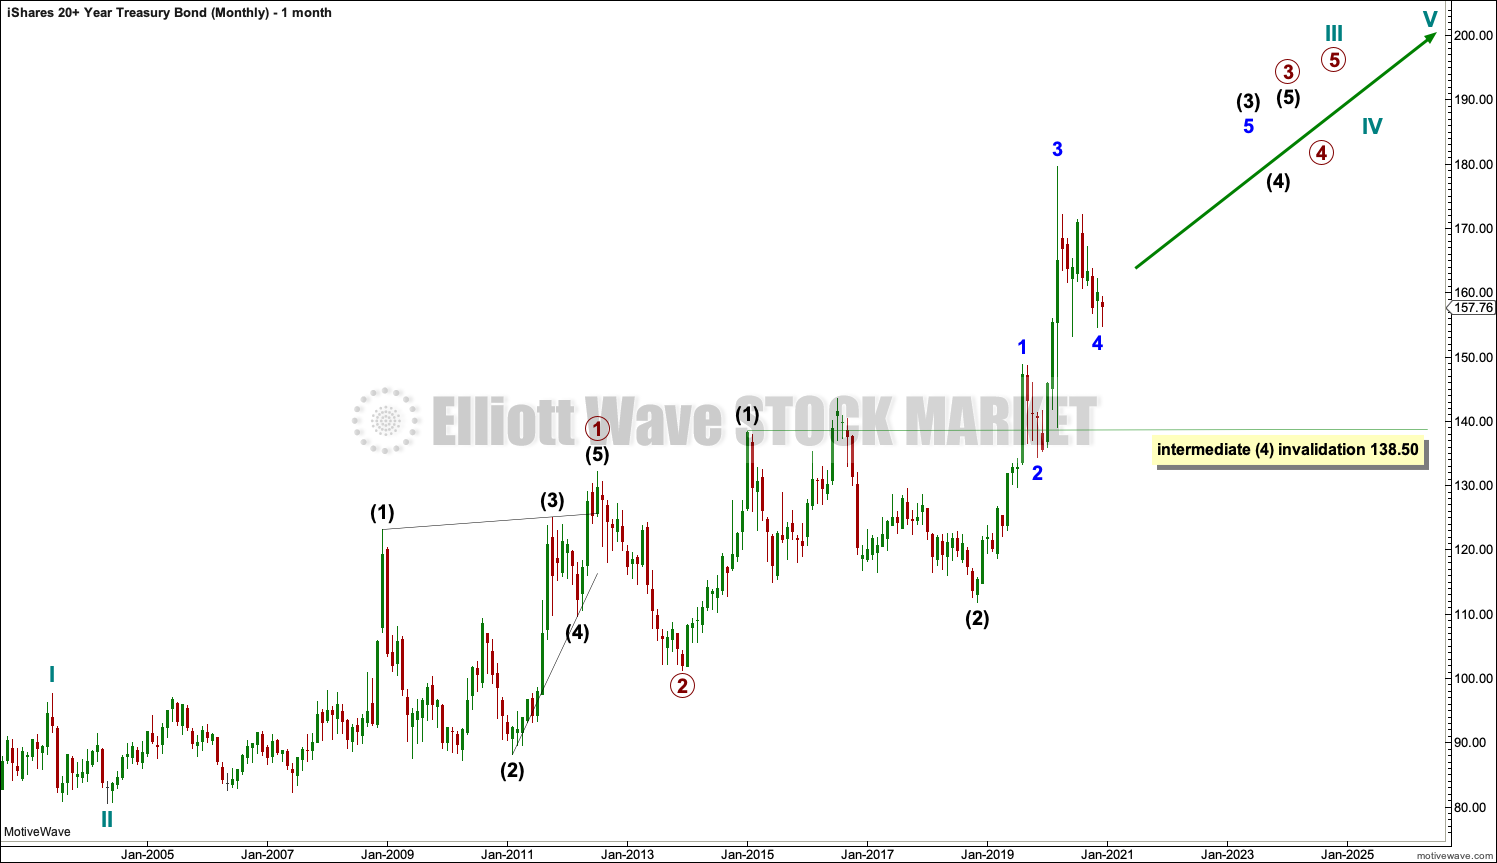
Data used is downloaded from Yahoo Finance and begins only at August 2012. This analysis makes an assumption that prior to this date TLT may have been in a bull market, which is labelled cycle wave I.
From the low labelled cycle wave II, there is overlapping up until the low labelled intermediate wave (2) (November 2018) of Primary wave 3. Thereafter, the overlapping is resolved by a strong impulse up with corrections that do not overlap prior highs of intermediate wave (1) and prior. This portion of the chart looks like the middle of a third wave, and is labelled as such.
Intermediate wave (3) has passed the 1.618 length of intermediate wave (1). At this stage, the structure looks incomplete. The next Fibonacci ratio in the sequence is used to calculate a target.
Intermediate wave (4) may not overlap intermediate wave (1) price territory below 138.50.
WEEKLY CHART
Click chart to enlarge.
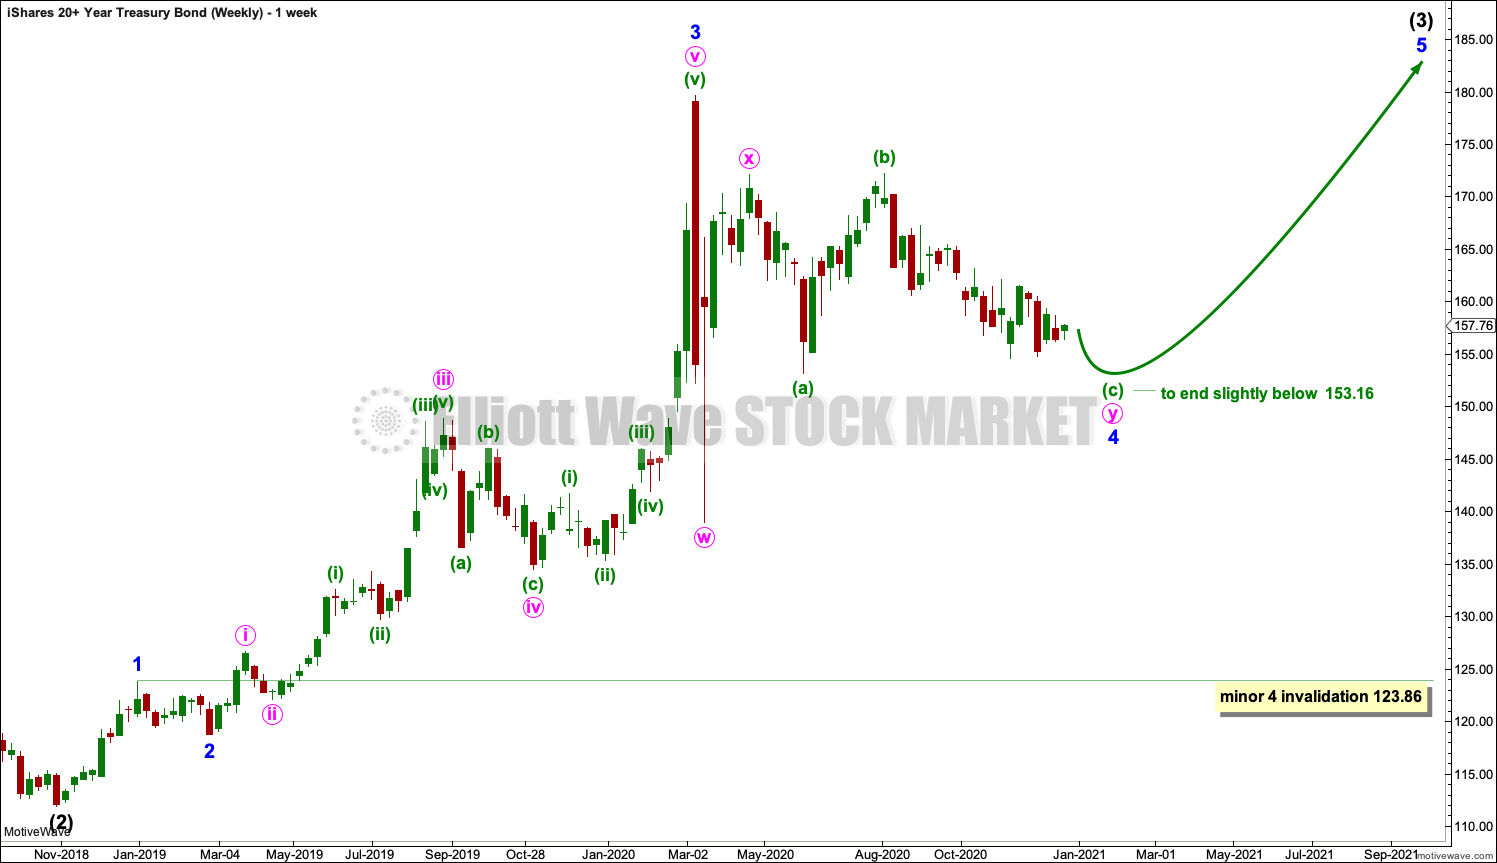
This chart focusses on the structure of minor wave 4.
Minor wave 4 may yet complete as a triangle, but it is my experience that combinations are more common structures. More sideways movement would be expected for both a triangle and a combination.
If minor wave 4 is a combination, then the first structure may be a complete zigzag, labelled minute wave w. The double may be joined by a complete three in the opposite direction, a complete zigzag, labelled minute wave w. The second structure in the double may be an incomplete flat, labelled minute wave y.
Within minute wave y: Minuette wave (b) is a 1.01 length of minuette wave (a), indicating a regular flat, and minuette wave (c) may move at least slightly below the end of minuette wave (a) at 153.16 to avoid a truncation and a very rare running flat.
Minor wave 4 may not move into minor wave 1 price territory below 123.86.
DAILY CHART

Click chart to enlarge.
This chart focusses on the structure of minuette wave (c).
Minuette wave (c) must subdivide as a five wave motive structure. It may be close to completion. There is alternation in structure within minuette wave (c) between an expanded flat of subminuette wave ii and a triangle of subminuette wave iv.
Assume the short-term downwards trend continues while price remains within the best fit channel. If this channel is breached by at least one full daily candlestick of upwards (not sideways) movement, then that may be taken as indication that the downwards trend is over, whether or not the target is met.
If the channel is breached prior to the target being met, then minor wave 4 may be relabelled as a complete triangle.
TECHNICAL ANALYSIS
MONTHLY CHART
Click chart to enlarge. Chart courtesy of StockCharts.com.
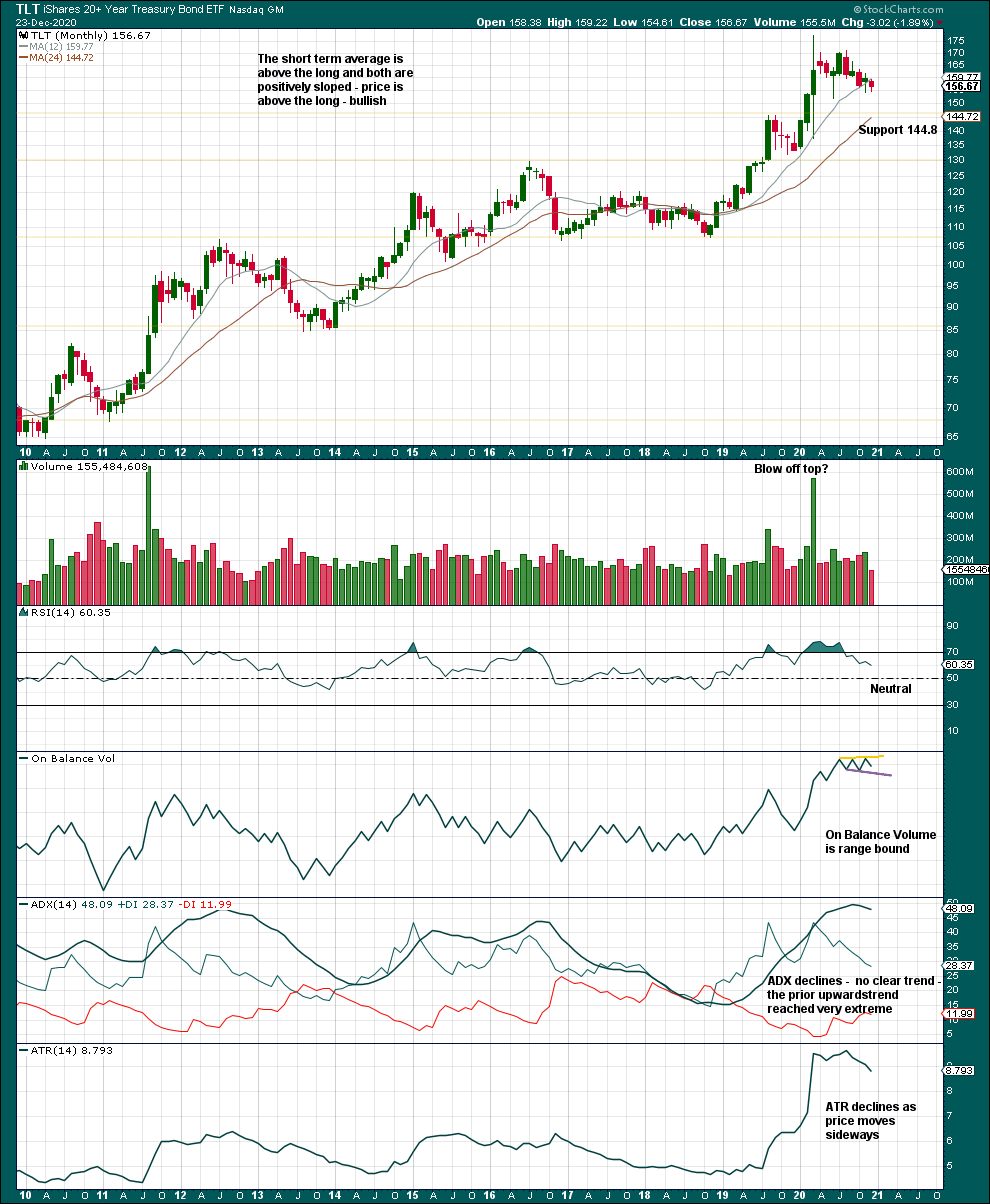
The upwards trend reached very extreme; ADX reached above both directional lines and above 45. Downwards movement from the high over the last nine months has not been enough to pull ADX below the directional lines or below 45. If another upwards trend develops here, then it would still be extreme.
Declining ATR since the high suggests the last nine months may be counter trend movement.
More downwards and sideways movement would be needed to relieve extreme conditions and bring RSI further into neutral territory.
WEEKLY CHART
Click chart to enlarge. Chart courtesy of StockCharts.com.
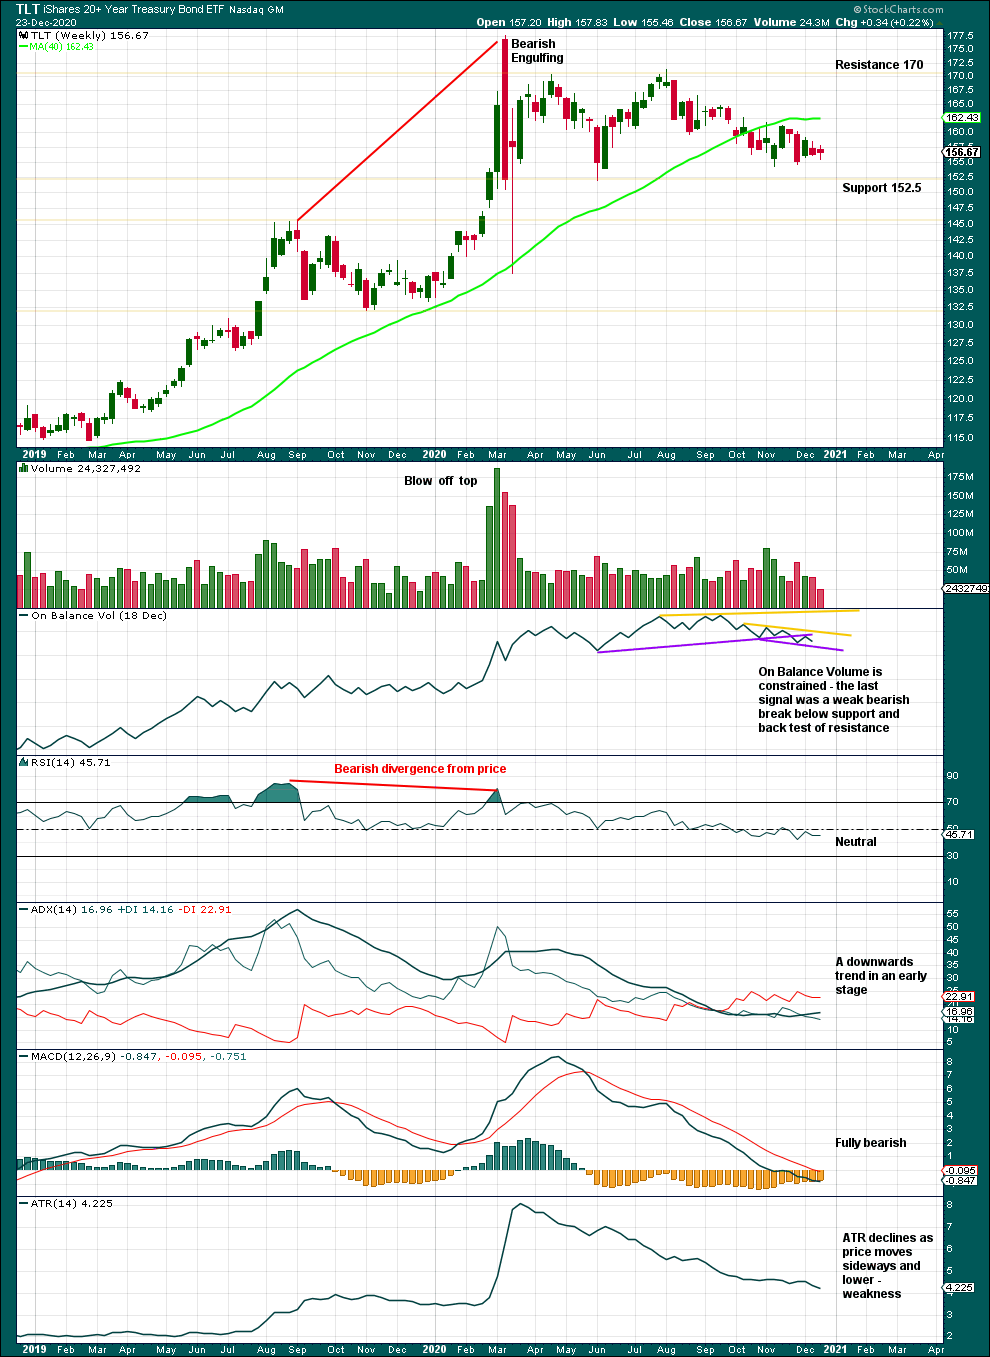
Price is range bound with resistance at 170 and support at 152.5. On Balance Volume is range bound. ADX indicate a downwards trend. A downwards breakout below support may occur.
DAILY CHART
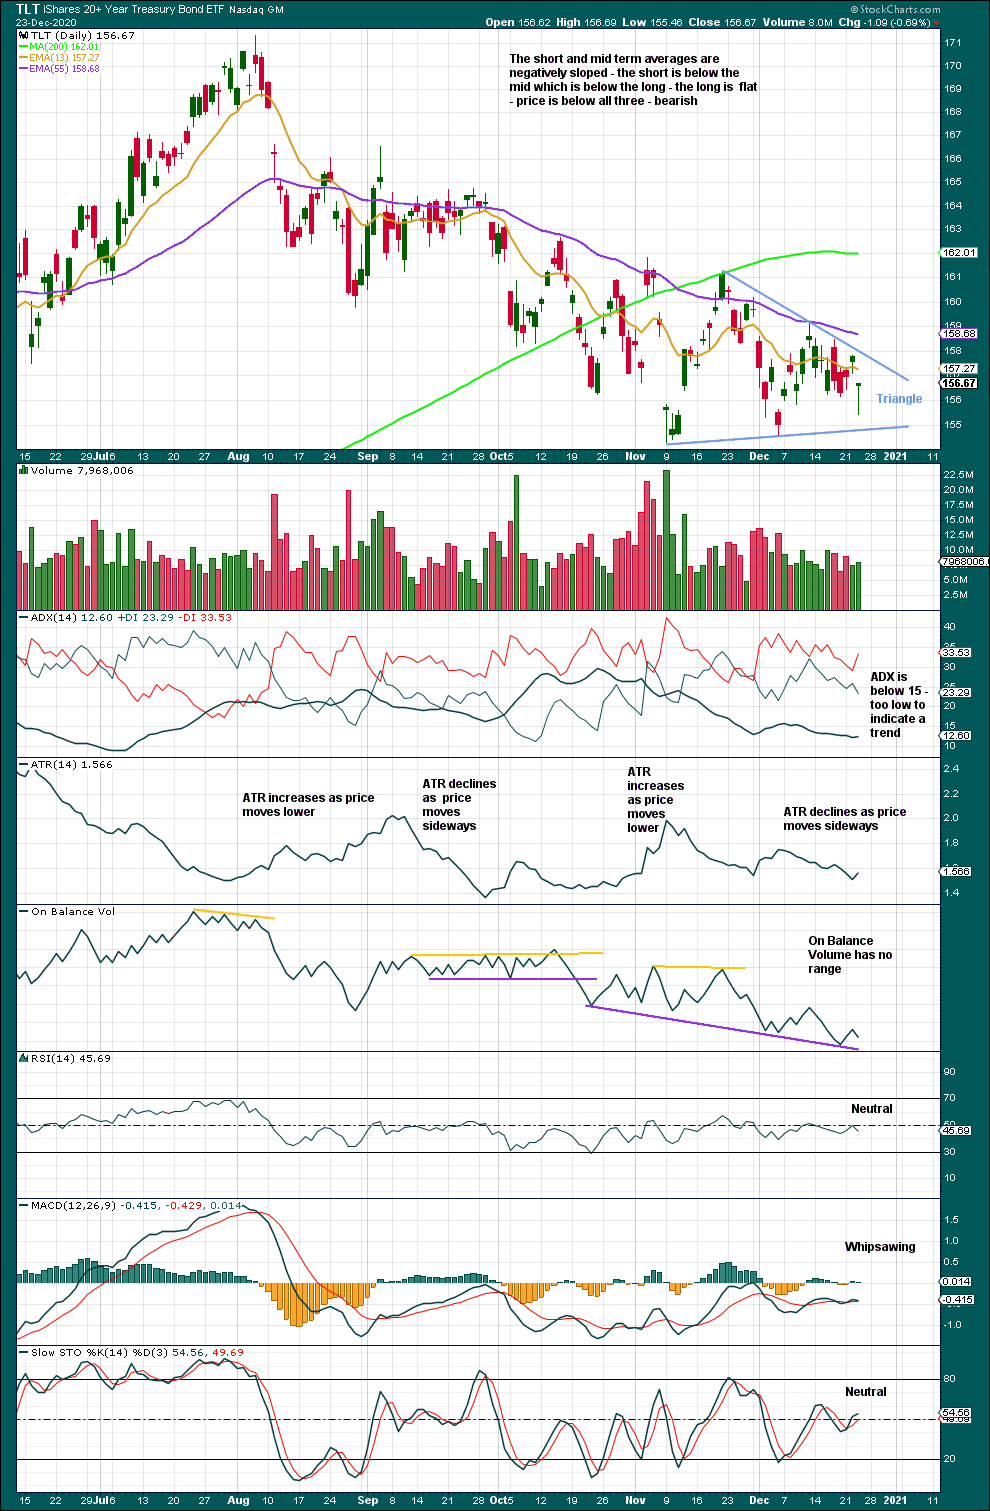
Click chart to enlarge. Chart courtesy of StockCharts.com.
A breakout from the triangle may be more likely downwards. A target would be at 148.1.
Published @ 08:43 p.m. ET.
—
Careful risk management protects your trading account(s).
Follow my two Golden Rules:
1. Always trade with stops.
2. Risk only 1-5% of equity on any one trade.
—
New updates to this analysis are in bold.