
Russell 2000: Elliott Wave Analysis | Charts – July 24, 2020
Summary: A target for a third wave down is at 326. The channel on the daily chart must be breached for any confidence in this view.
A new high above 1,715.08 would indicate a more bullish mid to long-term outlook.
Data used for this analysis is from Yahoo Finance.
ELLIOTT WAVE COUNTS
QUARTERLY CHART
Click chart to enlarge.
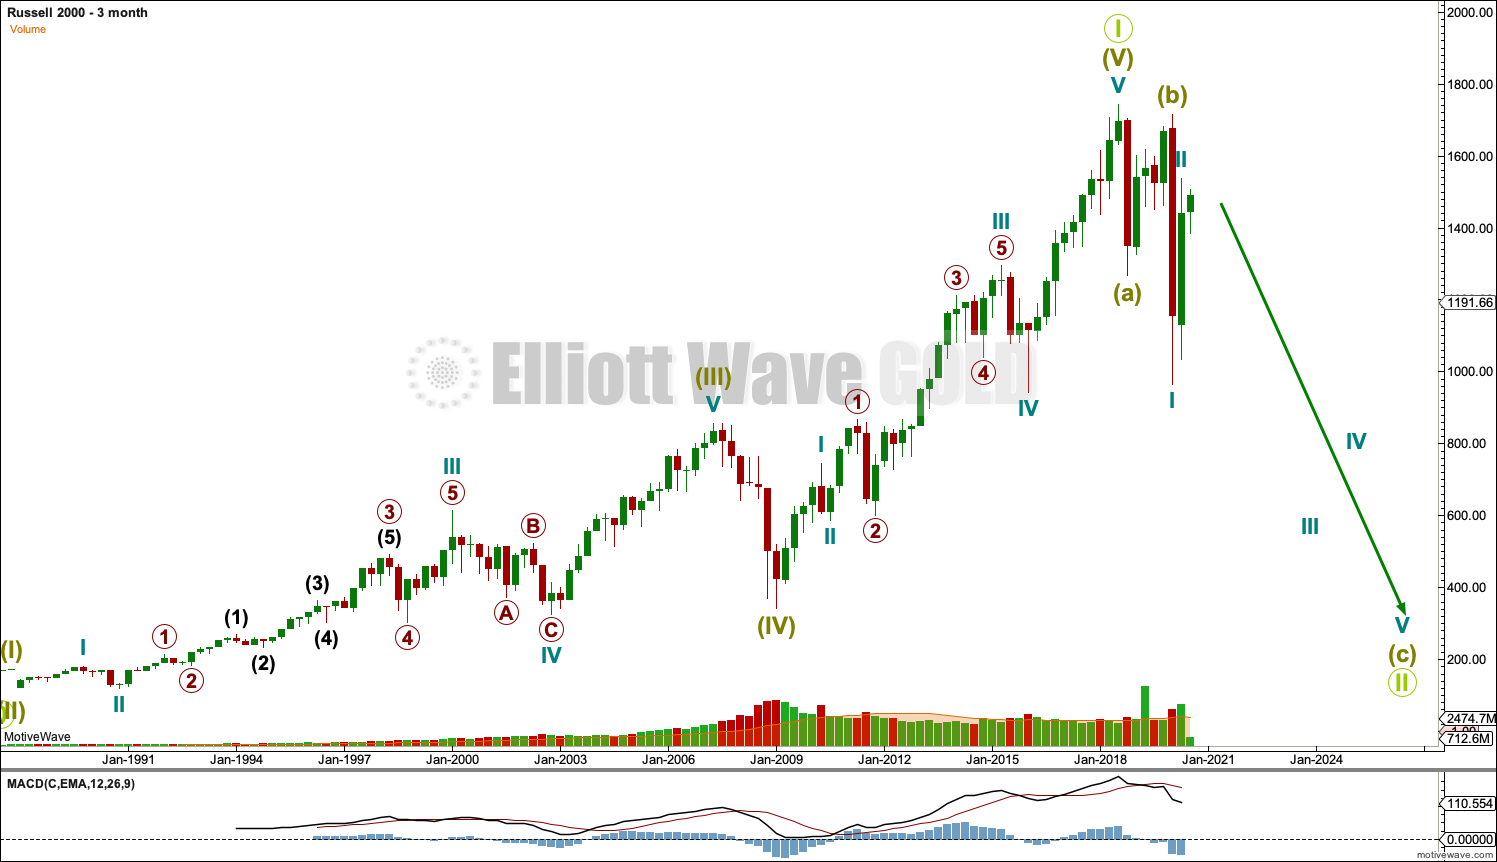
The simplest Elliott wave structure is a five wave impulse. This wave count sees a five wave impulse complete recently, in July 2018.
Russell 2000 begins in 1984, which is just off to the left of the chart. From 1984 to the high in 1987, the five wave impulse structure is labelled Super Cycle wave (I).
The 1987 crash is labelled Super Cycle wave (II).
Super Cycle wave (III) ends at the January 2007 high. Super Cycle wave (IV) is the bear market ending (for this market) January 2009.
From January 2009 to July 2018, Super Cycle wave (V) may be seen as a complete five wave impulse. If this analysis is correct, then July 2018 may have seen a trend change at Grand Super Cycle degree, a once in a generation change.
Following five steps forward should be three steps back. This three step back pattern will be labelled Grand Super Cycle wave II.
MONTHLY CHART
Click chart to enlarge.
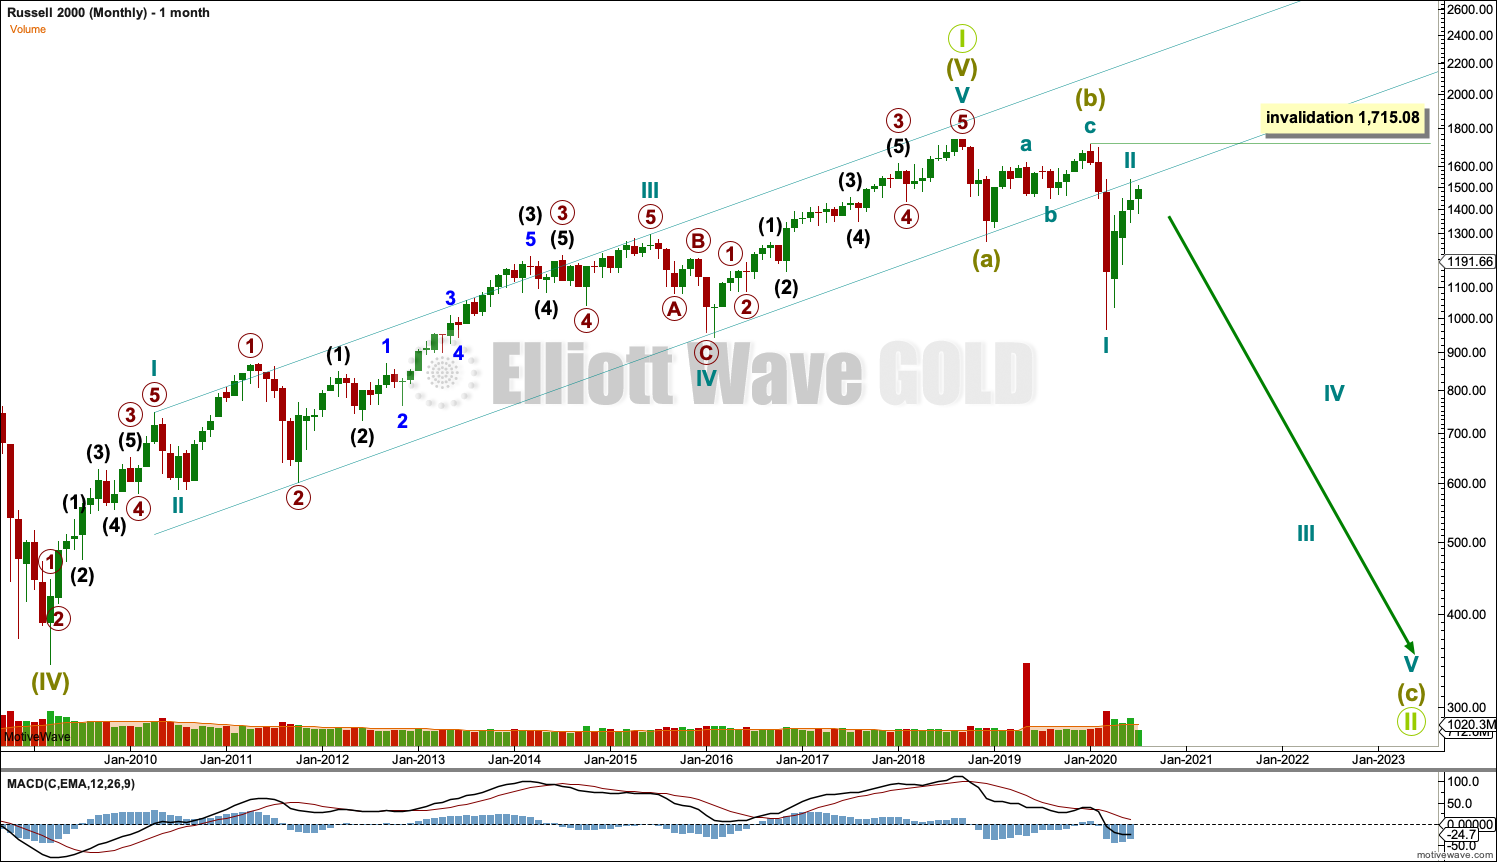
This monthly chart shows all of Super Cycle wave (V). This structure fits very well as a completed five wave impulse.
The blue channel is a best fit channel about Super Cycle wave (V). The lower edge is strongly breached. This may be taken as an indication that Super Cycle wave (V) may be over and the next wave in the opposite direction may have begun.
If this wave count is wrong, then it may be in the degree of labelling within Super Cycle wave II. The degree may need to be moved back down one.
WEEKLY CHART
Click chart to enlarge.
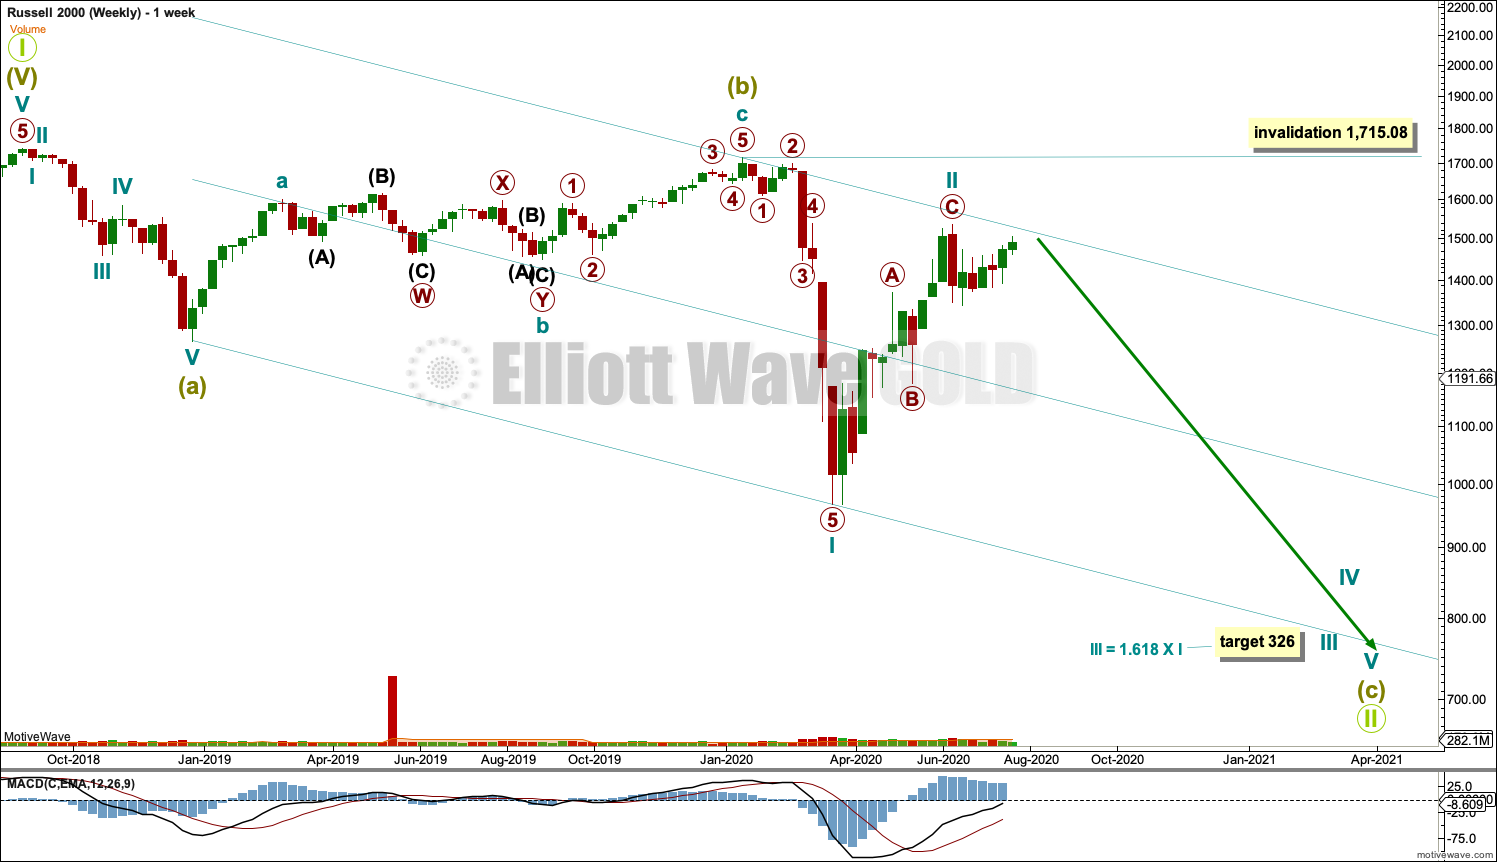
The weekly chart focusses on the beginning of the three step back pattern, which is labelled Grand Super Cycle wave II and is most likely incomplete.
Grand Super Cycle waves should be expected to last about a generation. However, stock markets have a strong bullish bias that results in bullish waves being much longer lasting than their bearish counterparts. While Grand Super Cycle wave I lasted from 1984 (the inception of Russell 2000) to August 2018 (34 years), Grand Super Cycle wave II may be much more brief than this. It may be over within about 2 years at the shortest or may last about 10 years at the longest.
The most likely structure for Grand Super Cycle wave II would be a zigzag. This is the most common Elliott wave corrective structure for a correction.
Zigzags subdivide 5-3-5. Within Grand Super Cycle wave II, Super Cycle wave (a) may be a complete five wave structure.
Super Cycle wave (b) may be a complete three wave structure.
Super Cycle wave (c) may have begun and may only subdivide as a five wave structure. Cycle wave I within Super Cycle wave (c) may be complete. Cycle wave II may not move beyond the start of cycle wave I above 1,715.08.
DAILY CHART
Click chart to enlarge.
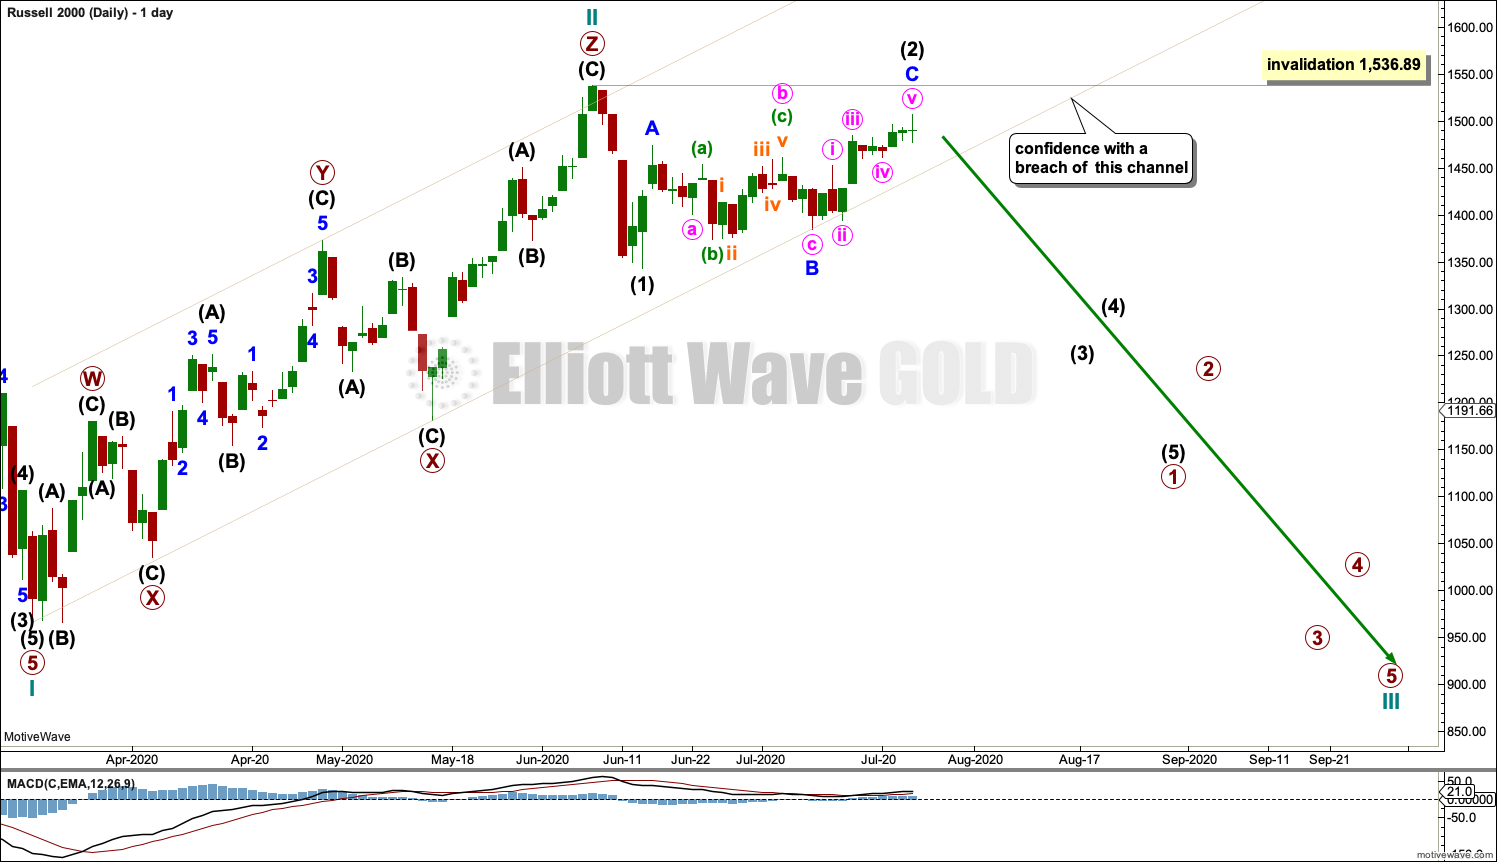
Cycle wave II may be a complete triple zigzag. This structure has a good fit. Although a triple zigzag is an uncommon Elliott wave corrective structure, it is the best fit for this movement.
Cycle wave III may have begun. It may only subdivide as an impulse. Neither intermediate wave (2) nor primary wave 2 within Cycle wave III may move beyond the start of their respective first waves above 1,536.89.
ALTERNATE WAVE COUNT
MONTHLY CHART
Click chart to enlarge.
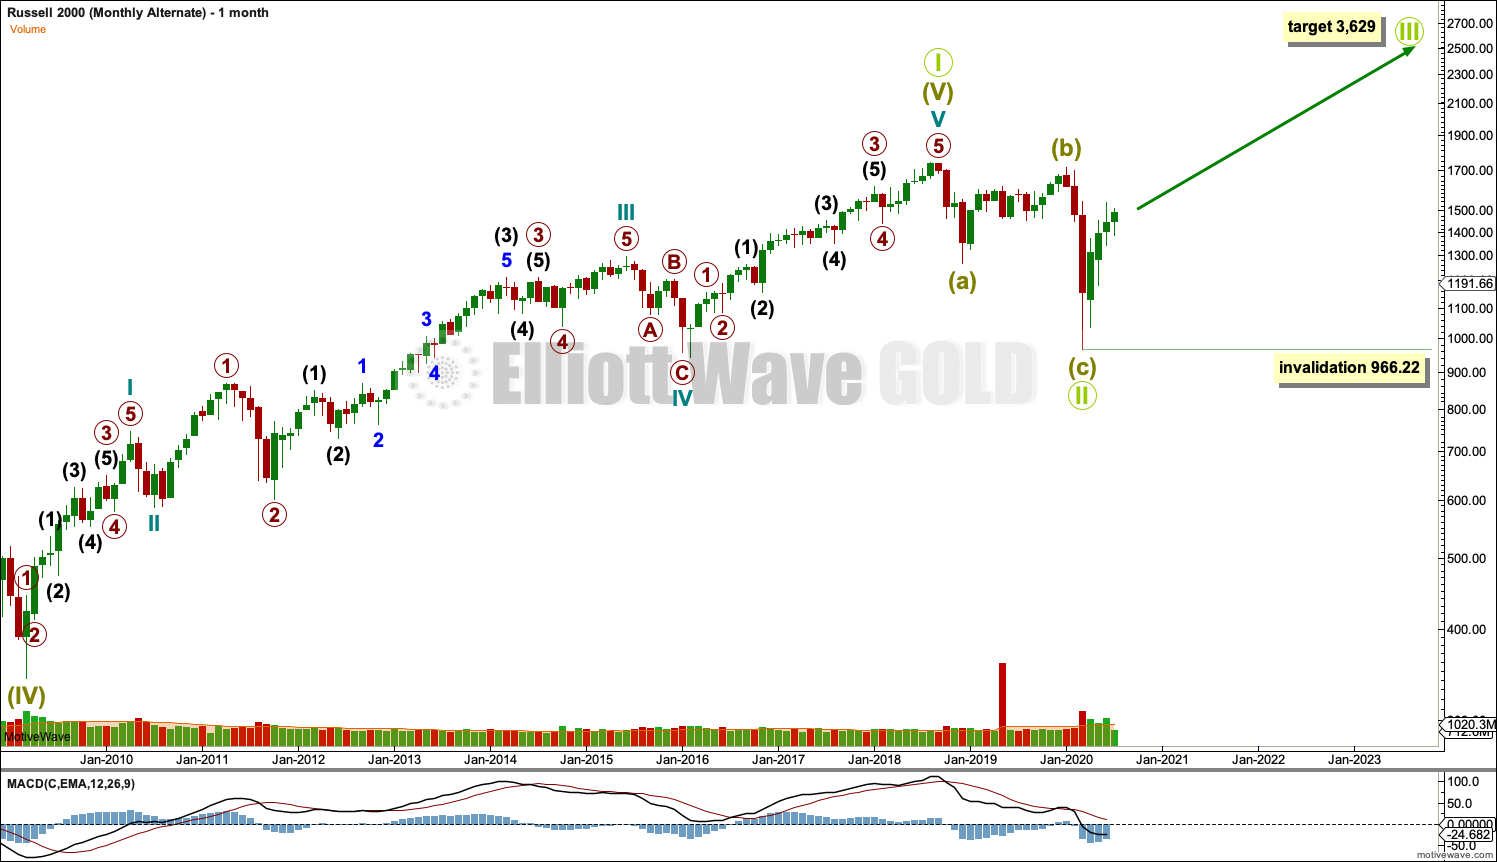
It is possible that Grand Super Cycle wave II was over in just 18 months. This is possible but unlikely for a wave at Super Cycle degree.
A target is calculated for Grand Super Cycle wave III. A third wave up should exhibit strength. It should have support from volume and range.
SECOND ALTERNATE WAVE COUNT
MONTHLY CHART
Click chart to enlarge.
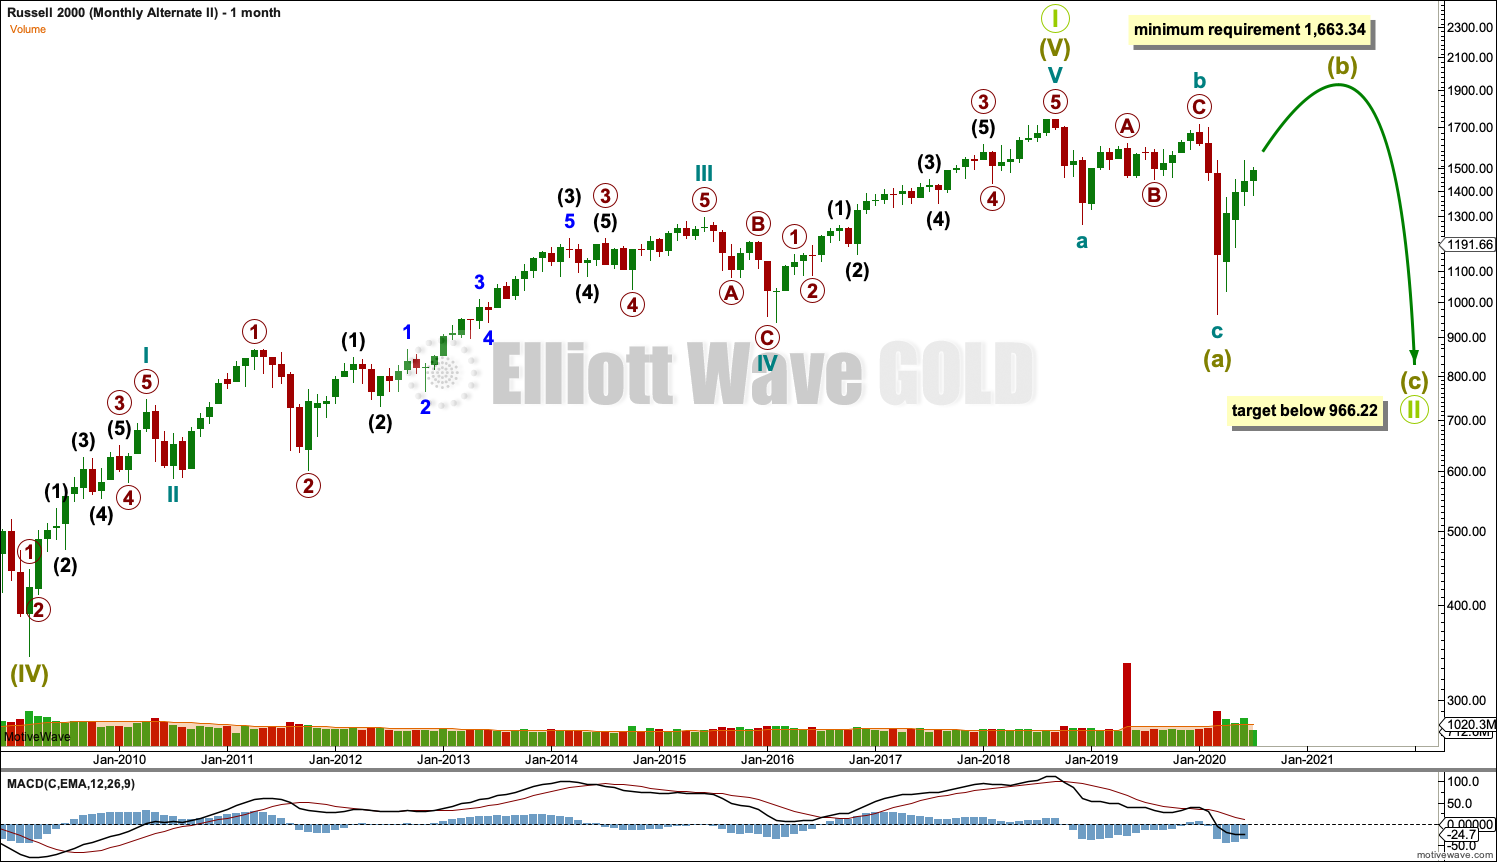
The main wave count expects Grand Super Cycle wave II to subdivide as a zigzag. But that is not the only Elliott wave corrective structure which may unfold in a second wave position.
Grand Super Cycle wave II may unfold as any Elliott wave corrective structure except a triangle. The second most common corrective structure is a flat correction, which is what this alternate wave count considers.
If Grand Super Cycle wave II subdivides as a flat correction, then within it both Super Cycle waves (a) and (b) must subdivide as three wave structures. Super Cycle wave (b) must retrace a minimum 0.9 length of Super Cycle wave (a) at 1,663.24. Super Cycle wave (b) may make a new high above the start of Super Cycle wave (a) at 1,740.80 as in an expanded flat; there is no upper invalidation point for this wave count for this reason.
Published @ 10:00 a.m. EST on July 25, 2020.
—
Careful risk management protects your trading account(s).
Follow my two Golden Rules:
1. Always trade with stops.
2. Risk only 1-5% of equity on any one trade.
—
New updates to this analysis are in bold.