
CCJ: Technical Analysis | Charts – May 1, 2020
Summary: A new low below 6.52 would indicate a bounce may be over. However, expect more upwards movement for the short term while price remains above 6.52.
MONTHLY CHART
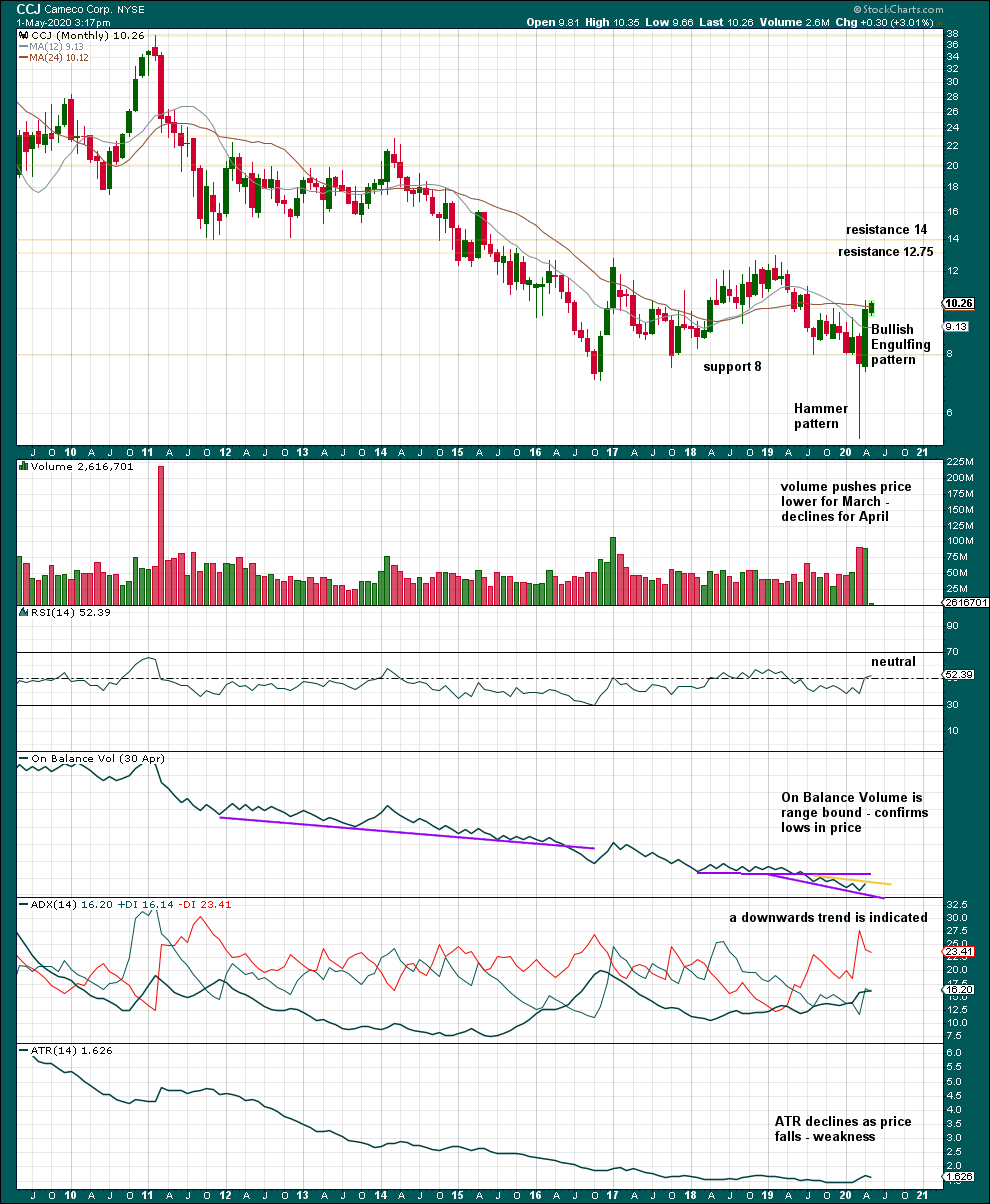
Click chart to enlarge.
For the short term, at least CCJ has found a low. Volume remains heavy. Although volume declined for April, the decline is slight.
RSI is neutral. There is room for price to rise or fall further.
WEEKLY CHART
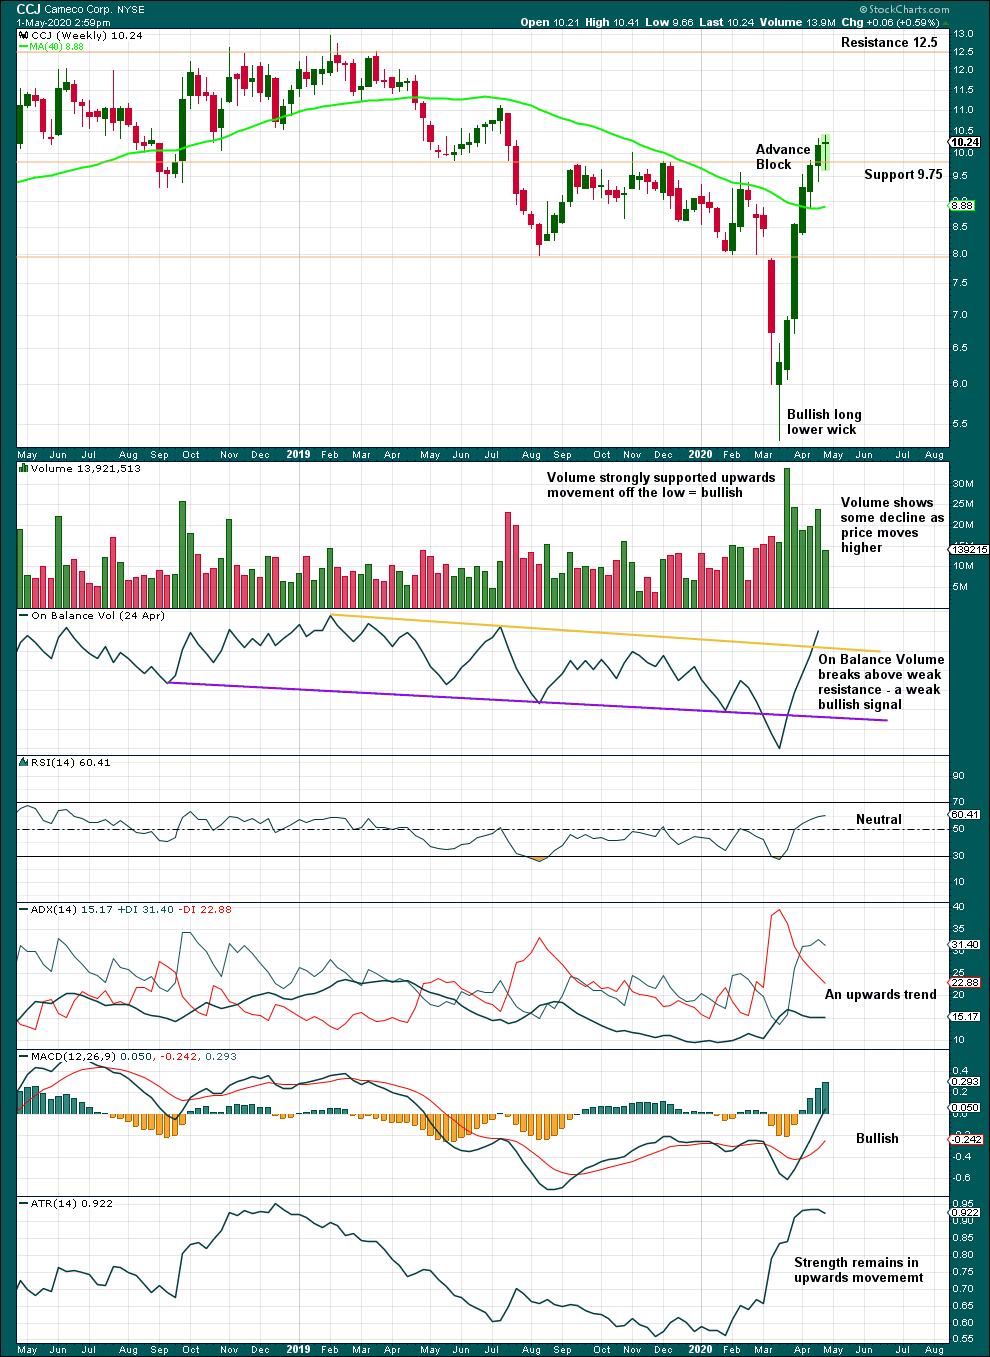
Click chart to enlarge.
A decline in volume and range for this bounce suggests some weakness. This should be viewed with suspicion.
DAILY CHART
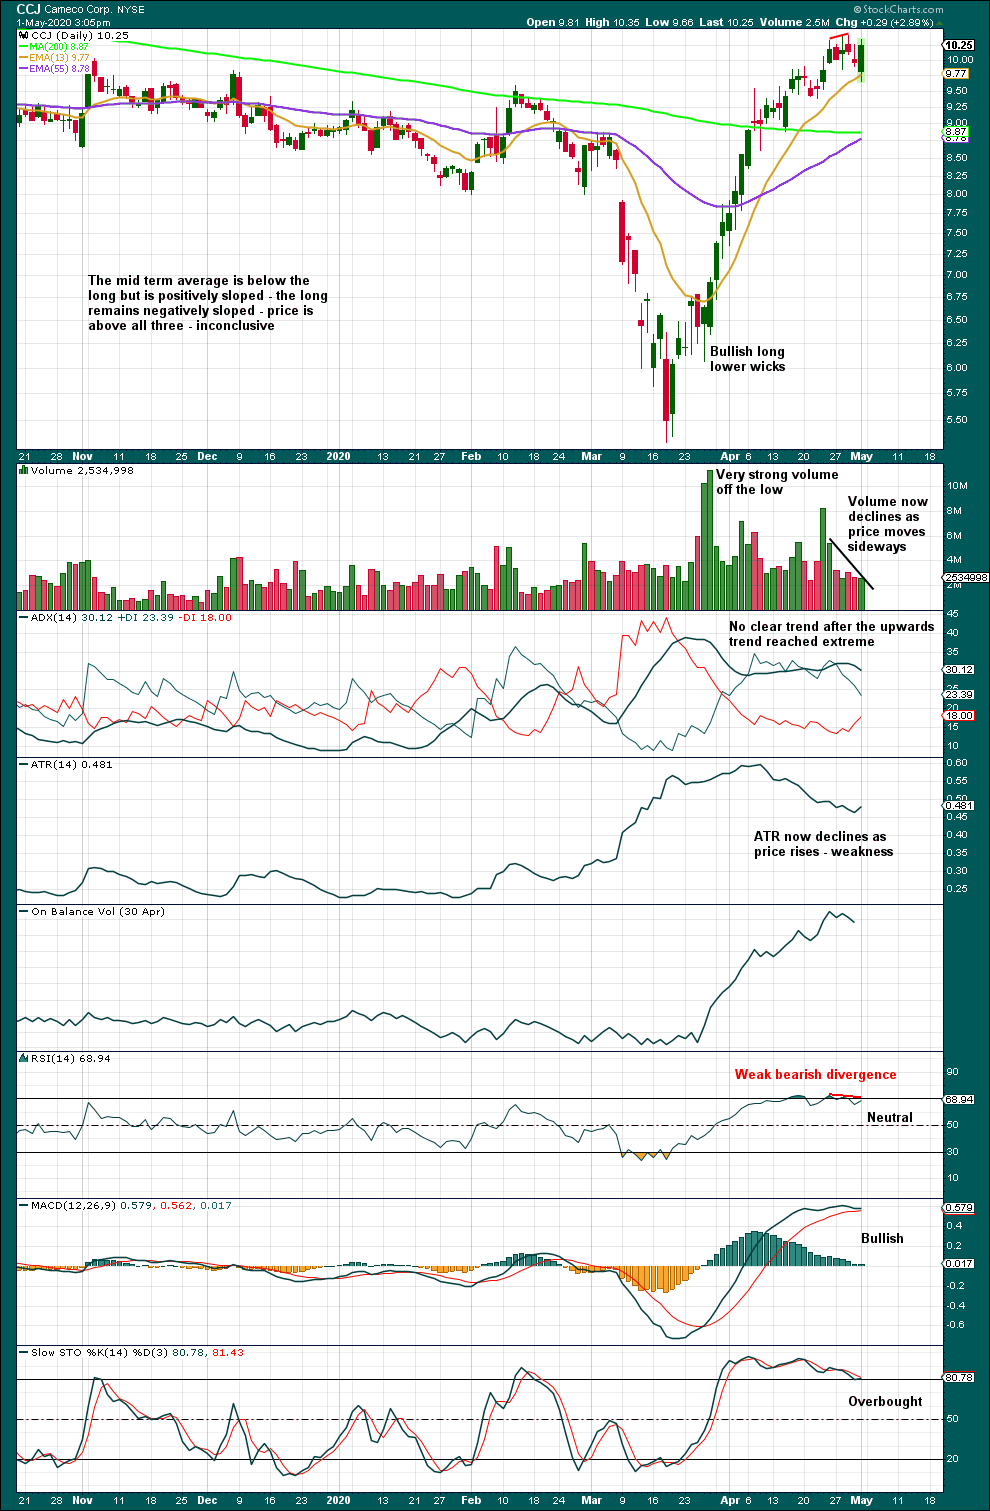
Click chart to enlarge.
Conditions are overbought, but divergence is weak. At this stage, there is no bearish reversal signal; it would be safest to assume this upwards trend remains intact, but weakness in volume and range suggests it may not continue for much longer.
Published @ 12:00 p.m. EST on May 3, 2020.
—
Careful risk management protects your trading account(s).
Follow my two Golden Rules:
1. Always trade with stops.
2. Risk only 1-5% of equity on any one trade.
—
New updates to this analysis are in bold.