
TSLA: Technical Analysis | Charts – April 23, 2020
It is possible that TSLA may have a sustainable high in place.
Summary: There is reasonable risk here of more downwards movement. A new low below 652 would indicate a bounce may be over. However, expect more upwards movement for the short term while price remains above 652.
MONTHLY CHART
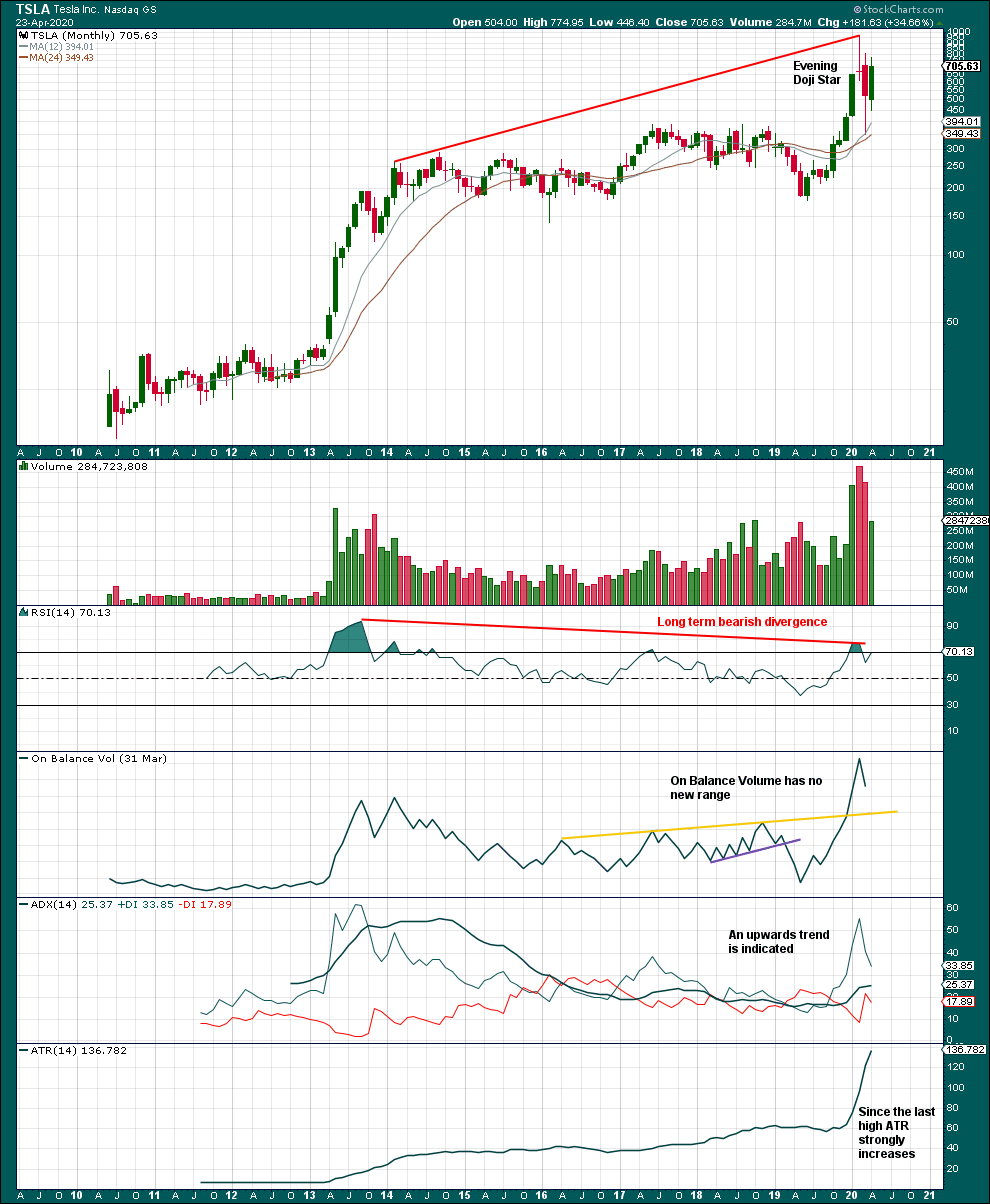
Click chart to enlarge.
It looks like TSLA may have had a blow off top. Strong bearish divergence between price and RSI and a bearish Evening Doji Star reversal pattern suggest a high may possibly be in place for the longer term.
WEEKLY CHART
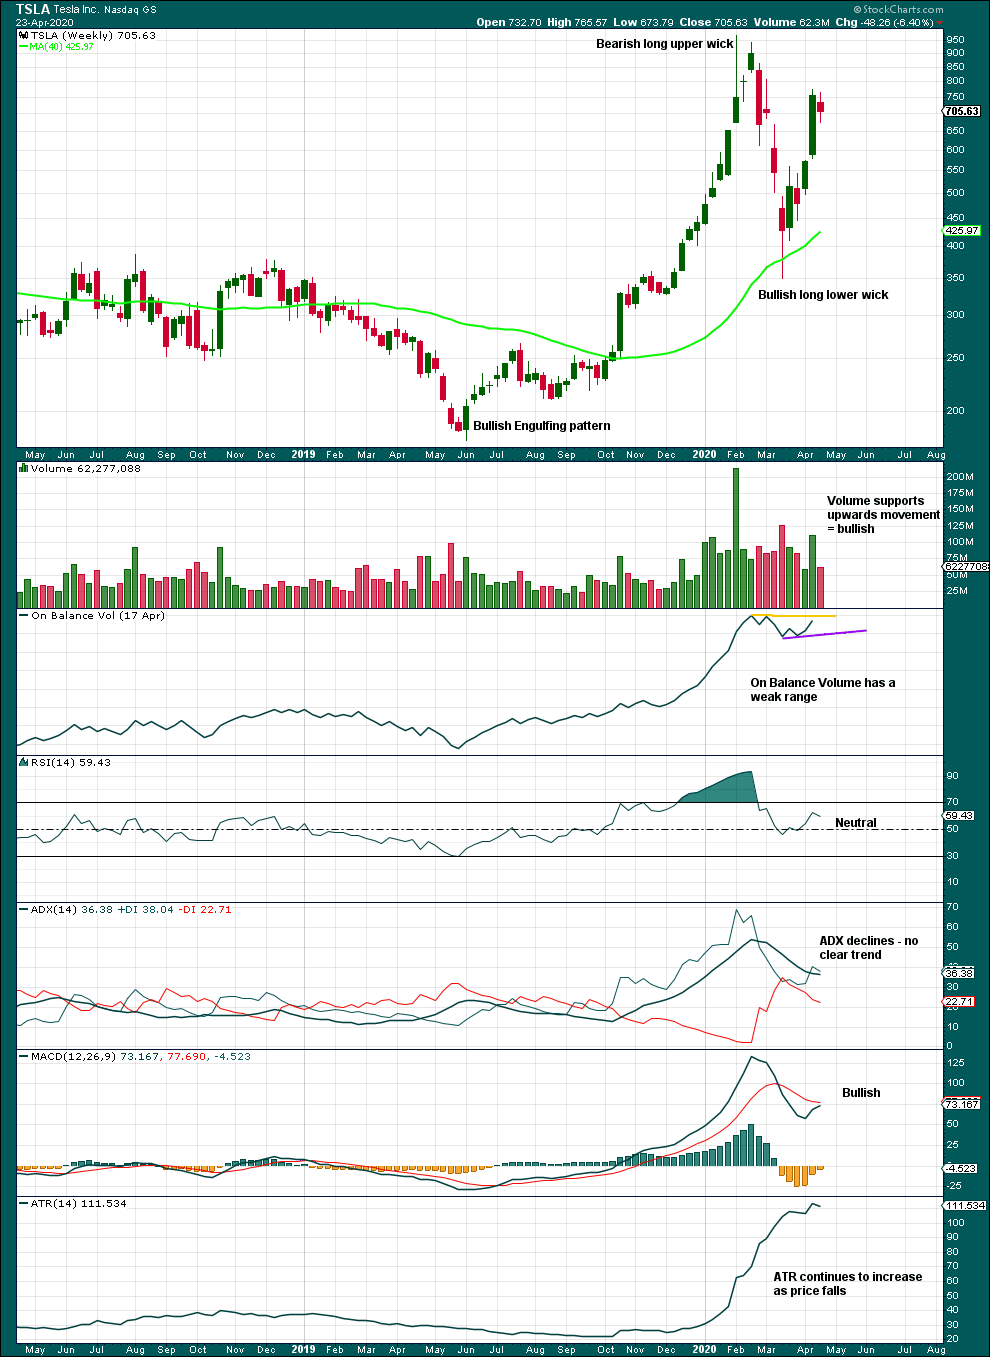
Click chart to enlarge.
For the short term, volume suggests upwards movement may continue.
DAILY CHART
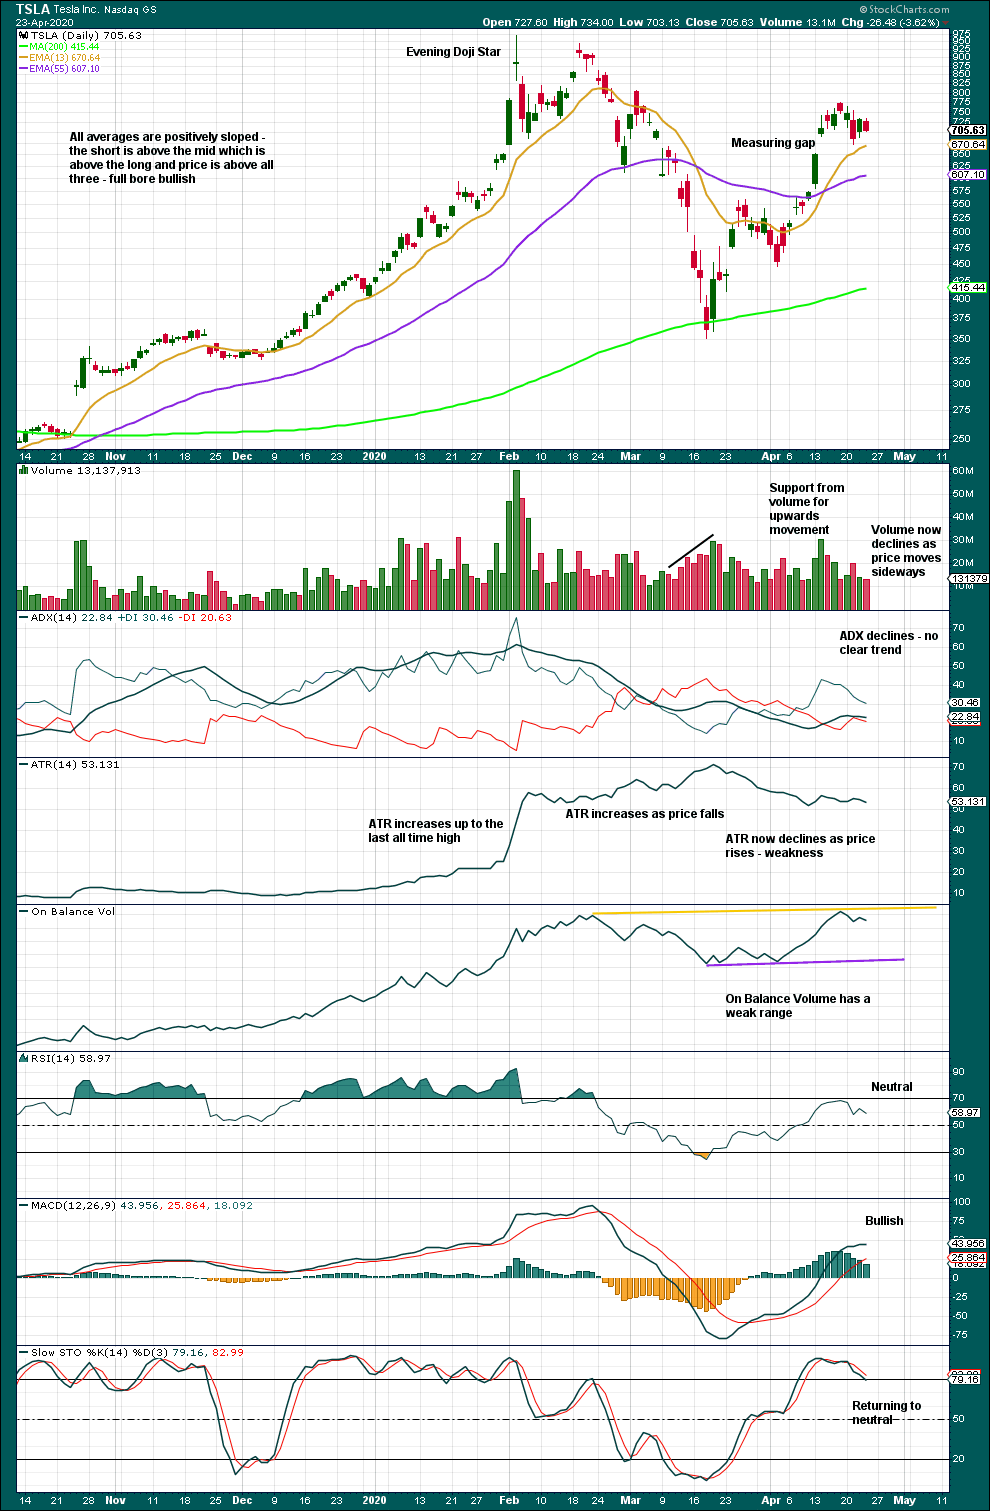
Click chart to enlarge.
A target calculated from the last measuring gap is 76.39, which has been passed. Assume upwards movement may continue while the last gap remains open at 652.00.
Published @ 06:56 p.m. EST.
—
Careful risk management protects your trading account(s).
Follow my two Golden Rules:
1. Always trade with stops.
2. Risk only 1-5% of equity on any one trade.
—
New updates to this analysis are in bold.