
TSLA: Technical Analysis | Charts – July 16, 2020
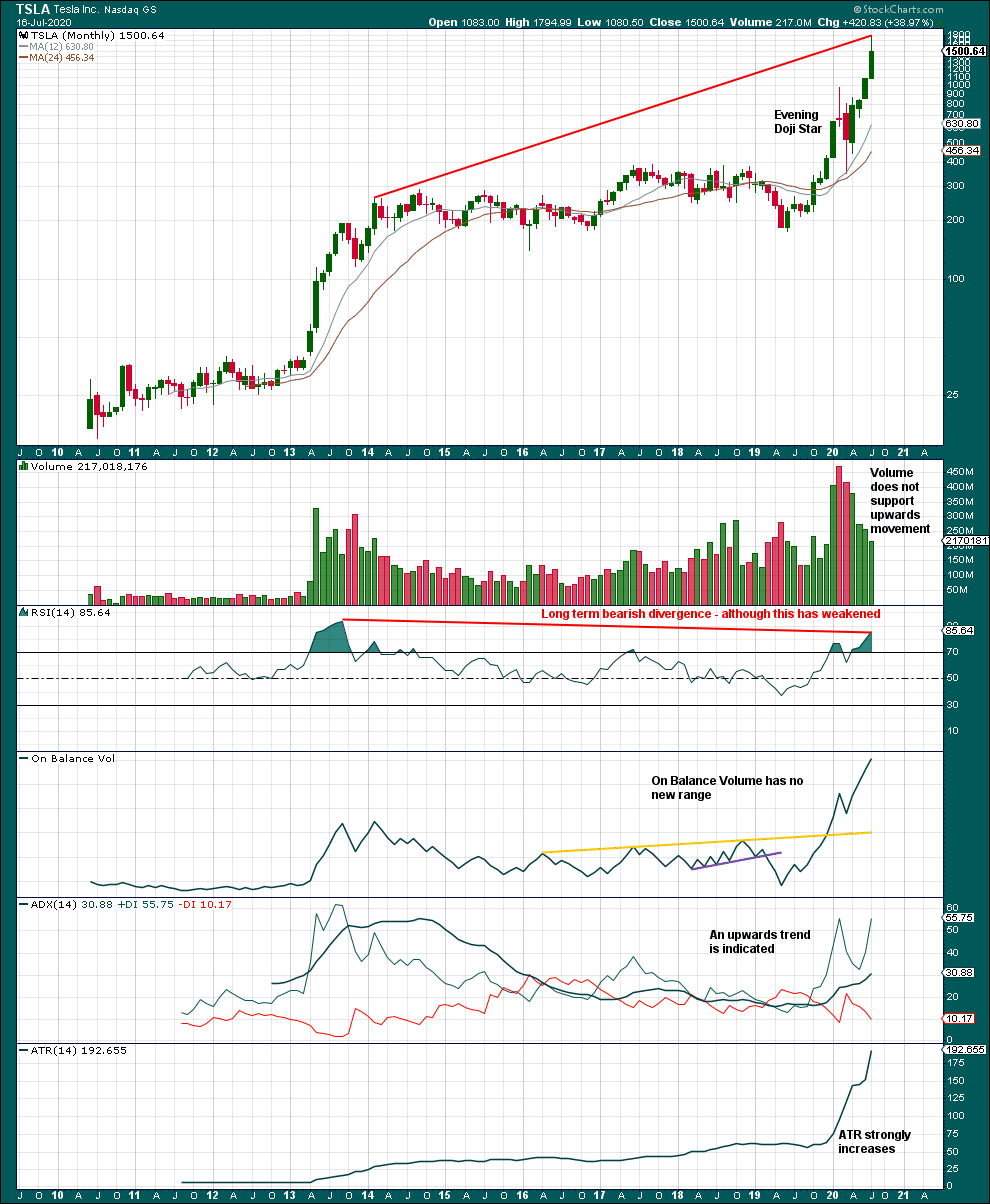
MONTHLY CHART
Click chart to enlarge.
Longer-term bearish divergence between price and RSI does not look to be very reliable.
There is an upwards trend that is not yet extreme. However, weakness in volume strongly suggests caution.
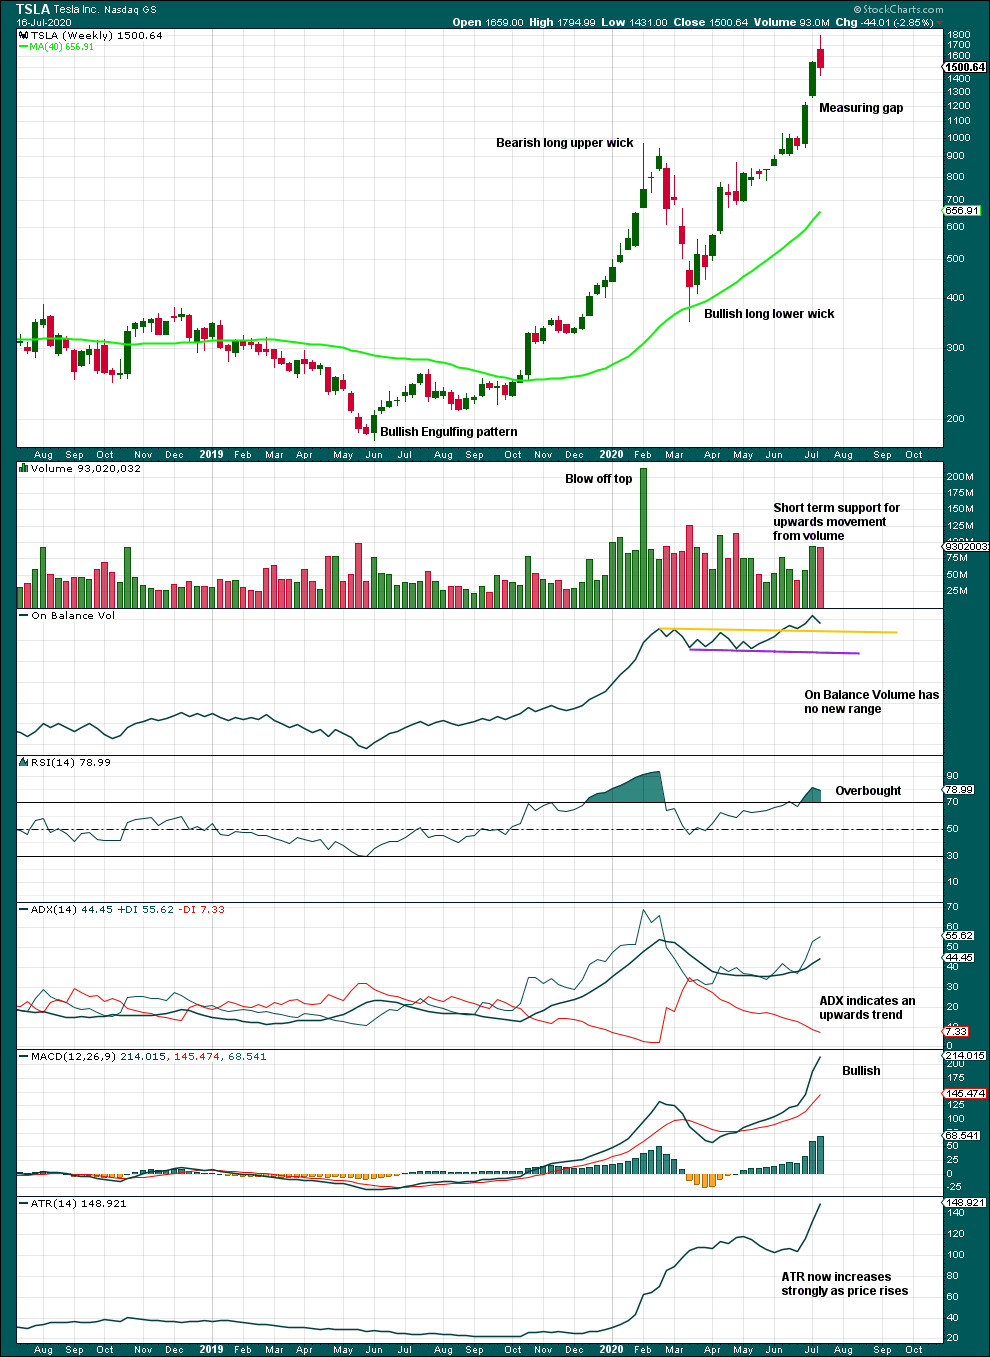
WEEKLY CHART
Click chart to enlarge.
There is an upwards trend in place. Conditions are now extreme but may continue to be so for a while.
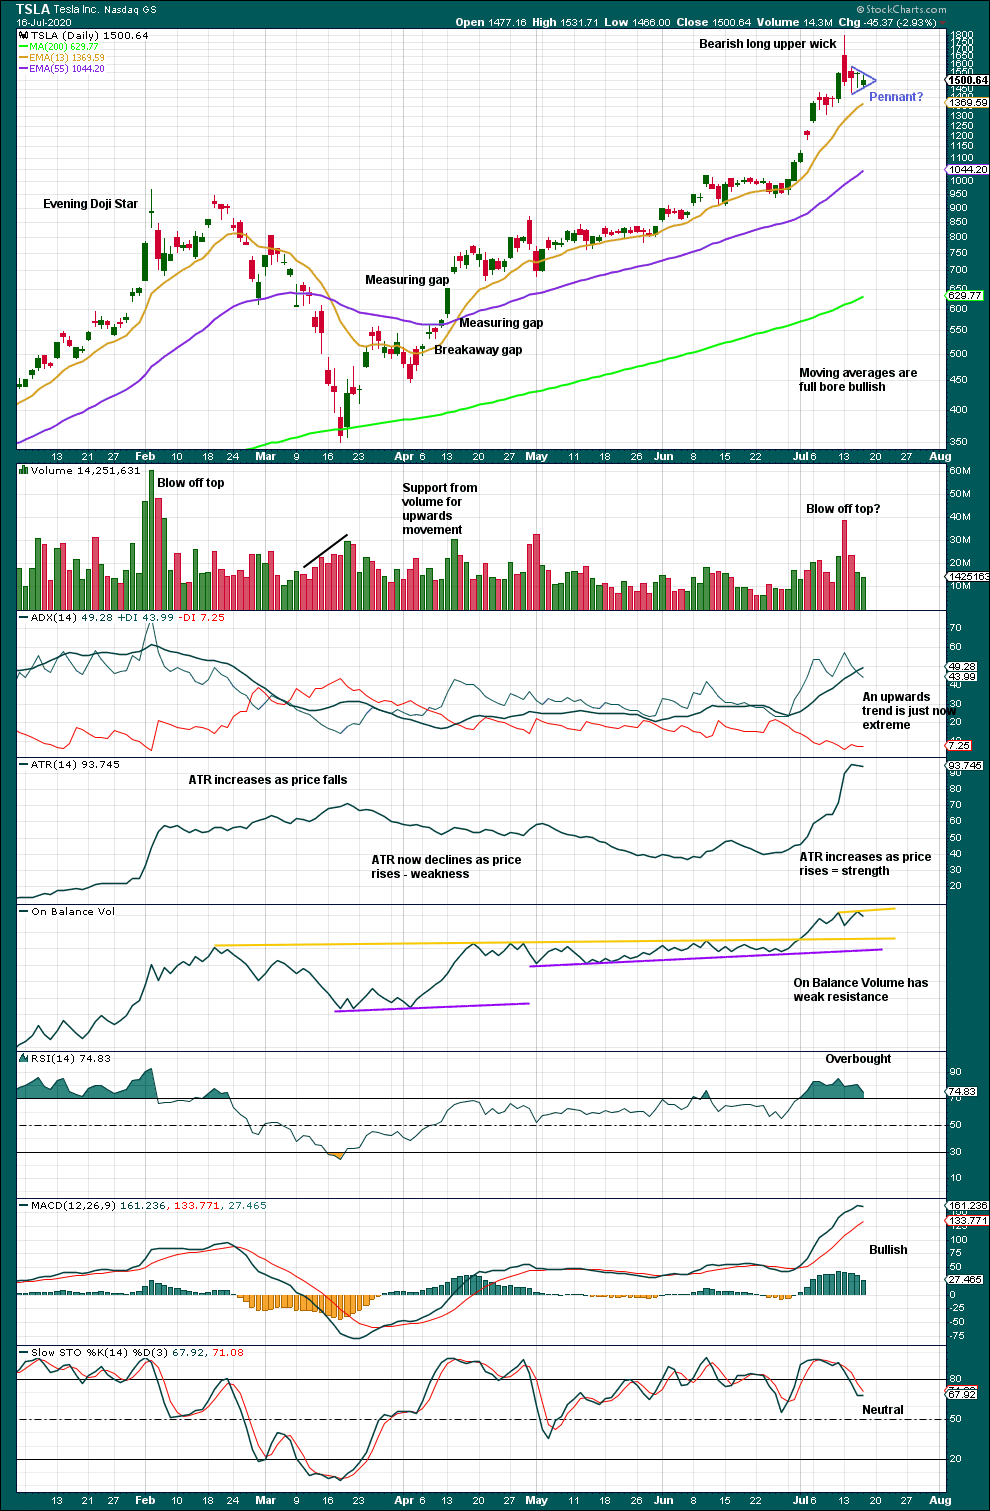
DAILY CHART
Click chart to enlarge.
TSLA can reach extreme conditions at the daily chart time frame and remain there for a reasonable time. Look for bearish candlestick reversal pattern and closure of the last gap with a new low below 1,228 for indication of a trend change. While these conditions are not present, assume the upwards trend is most likely to continue.
Published @ 11:12 a.m. EST on July 17, 2020.
—
Careful risk management protects your trading account(s).
Follow my two Golden Rules:
1. Always trade with stops.
2. Risk only 1-5% of equity on any one trade.
—
New updates to this analysis are in bold.