
TYX: Elliott Wave and Technical Analysis | Charts – May 13, 2020
TYX is in a downwards trend at the monthly and quarterly time frames.
Summary: A counter trend movement may continue for some months. A target is at 2.23. Thereafter, a larger downwards trend may resume to new lows. The final target is at -1.72.
ELLIOTT WAVE ANALYSIS
QUARTERLY CHART
Click chart to enlarge.
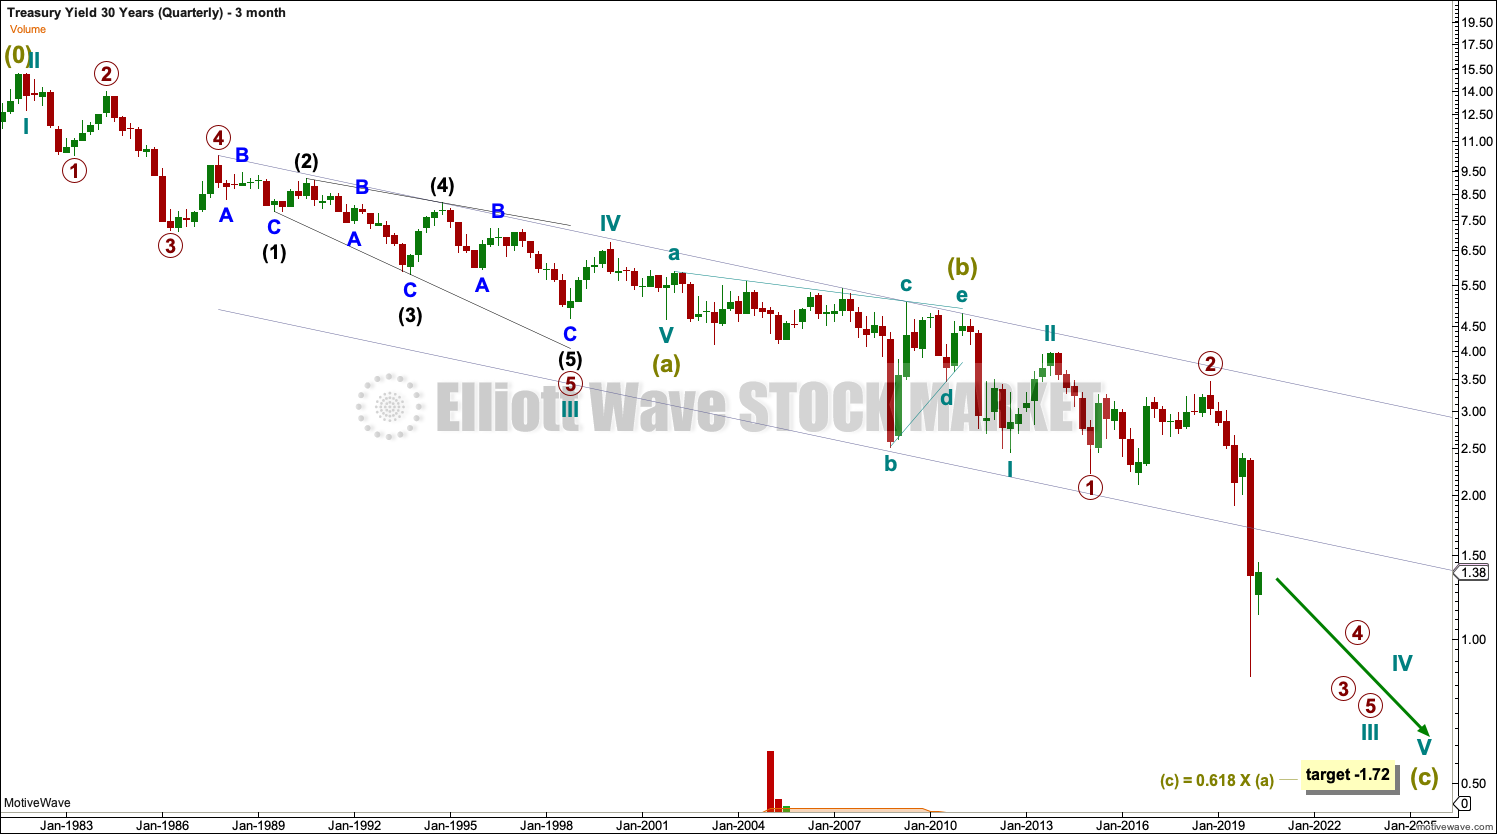
This wave count begins at the high in July 1981. Prior to that price had moved higher.
This downwards movement is viewed as an Elliott wave corrective structure. This structure may be a single or multiple zigzag. A single zigzag has a good fit.
A target is calculated for Super Cycle wave (C) to end that would see yields reach negative values. If this target is wrong, it may be too low.
The channel is a best fit. It is overshot by a third wave, which is normal third wave behaviour.
MONTHLY CHART
Click chart to enlarge.
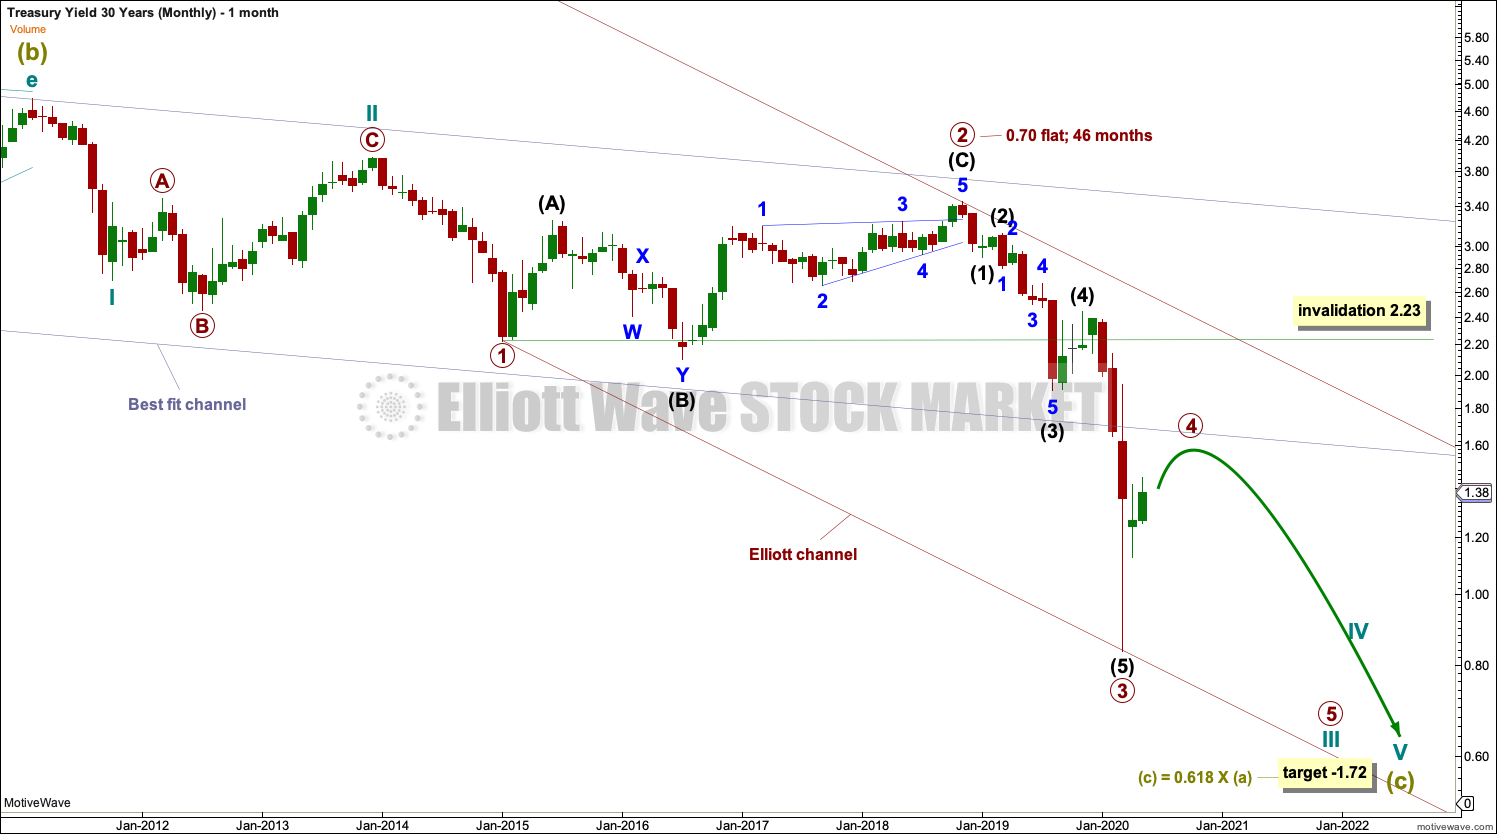
The monthly chart focusses on all of Super Cycle wave (C).
Super Cycle wave (c) may have passed through the middle strongest portion. Cycle wave III may only subdivide as an impulse. Primary wave 4 within cycle wave III may now continue higher. Primary wave 4 may not move into primary wave 1 price territory above 2.23.
Draw a channel about cycle wave III using Elliott’s technique. Draw the first trend line from the ends of primary waves 1 to 3, then place a parallel copy on the end of primary wave 2. If it is long lasting enough, then primary wave 4 may find resistance at the upper edge of the channel.
Primary wave 2 lasted 46 months. Primary wave 4 may not last as long but should continue for months yet.
WEEKLY CHART
Click chart to enlarge.
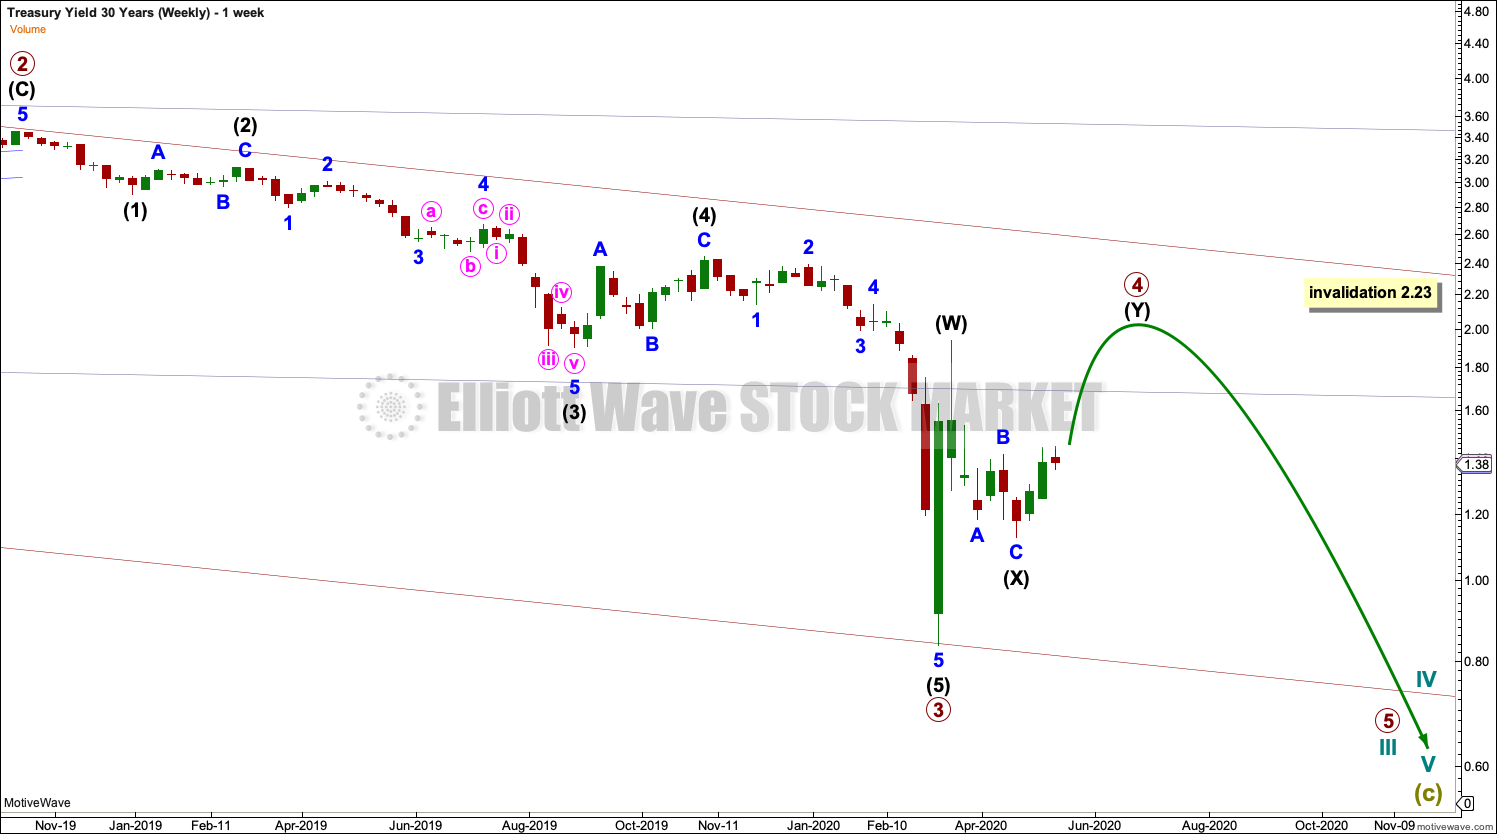
Primary wave 4 may be subdividing as a double zigzag. It may also be subdividing as a triangle or combination.
DAILY CHART
Click chart to enlarge.
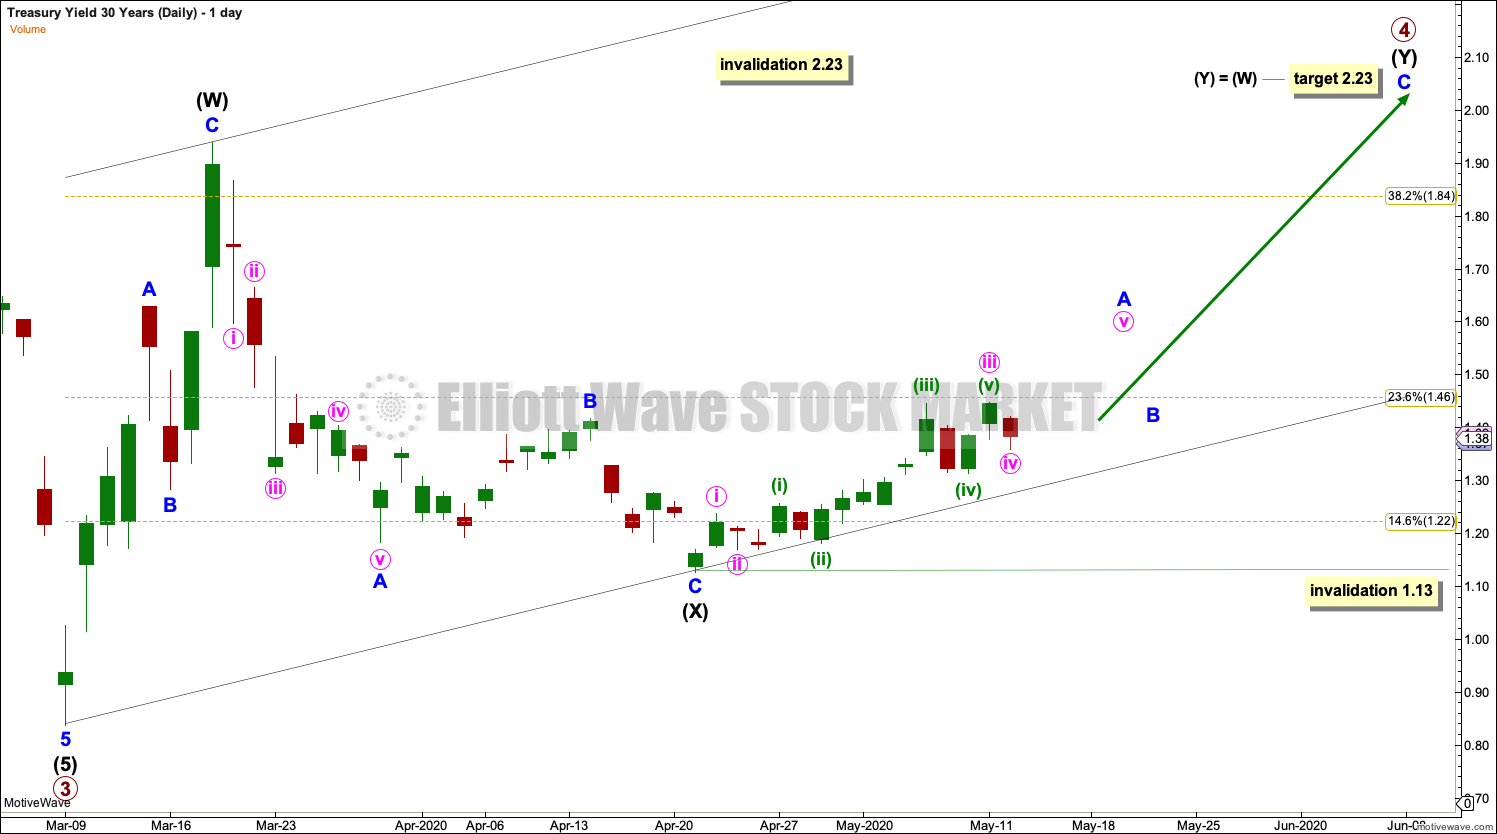
A target is calculated for primary wave 4 to end. This target only works for a double zigzag. If primary wave 4 subdivides as a triangle or combination, then only sideways movement would be expected.
The target expects primary wave 4 to touch the end of primary wave 1. An overlap would be required for invalidation of this wave count; primary wave 4 may not move into primary wave 1 price territory. A new high by any amount at any time frame above 2.23 invalidates this wave count.
TECHNICAL ANALYSIS
MONTHLY CHART
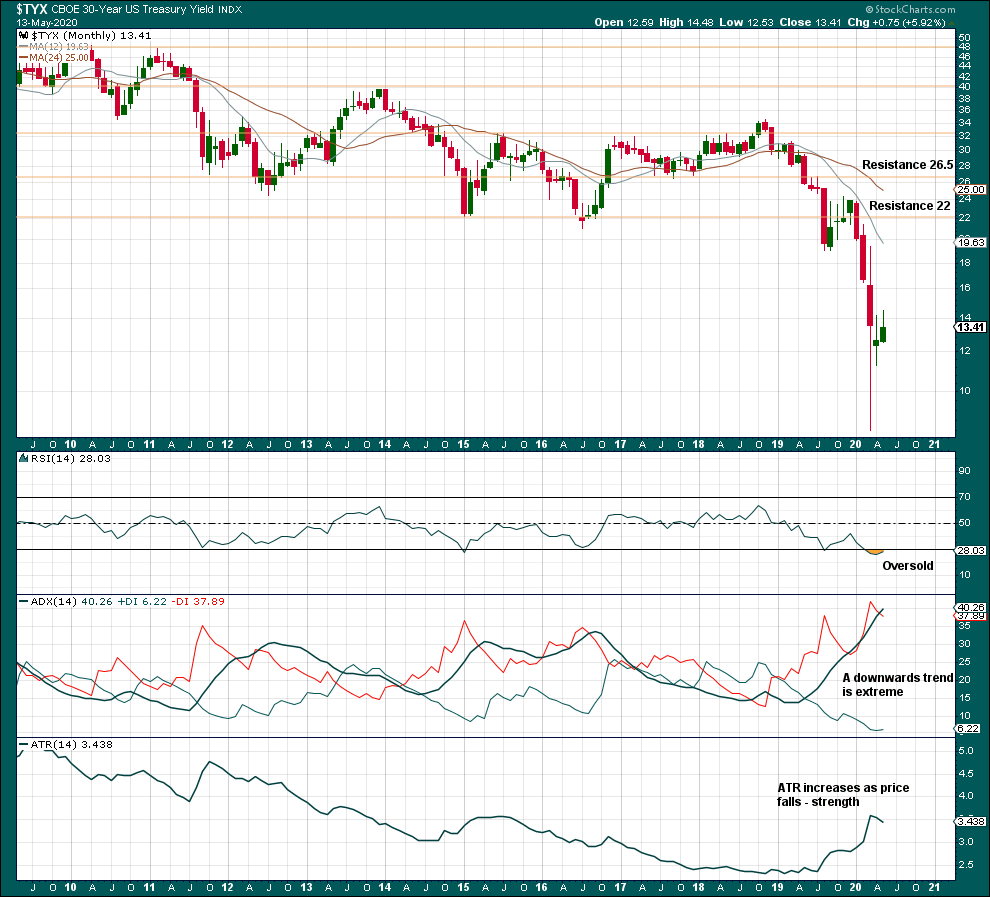
Click chart to enlarge.
There is no candlestick reversal pattern to indicate an end to the downwards trend. However, the trend is extreme and RSI recently reached oversold. A bounce or some sideways movement may continue here to relieve extreme conditions.
WEEKLY CHART
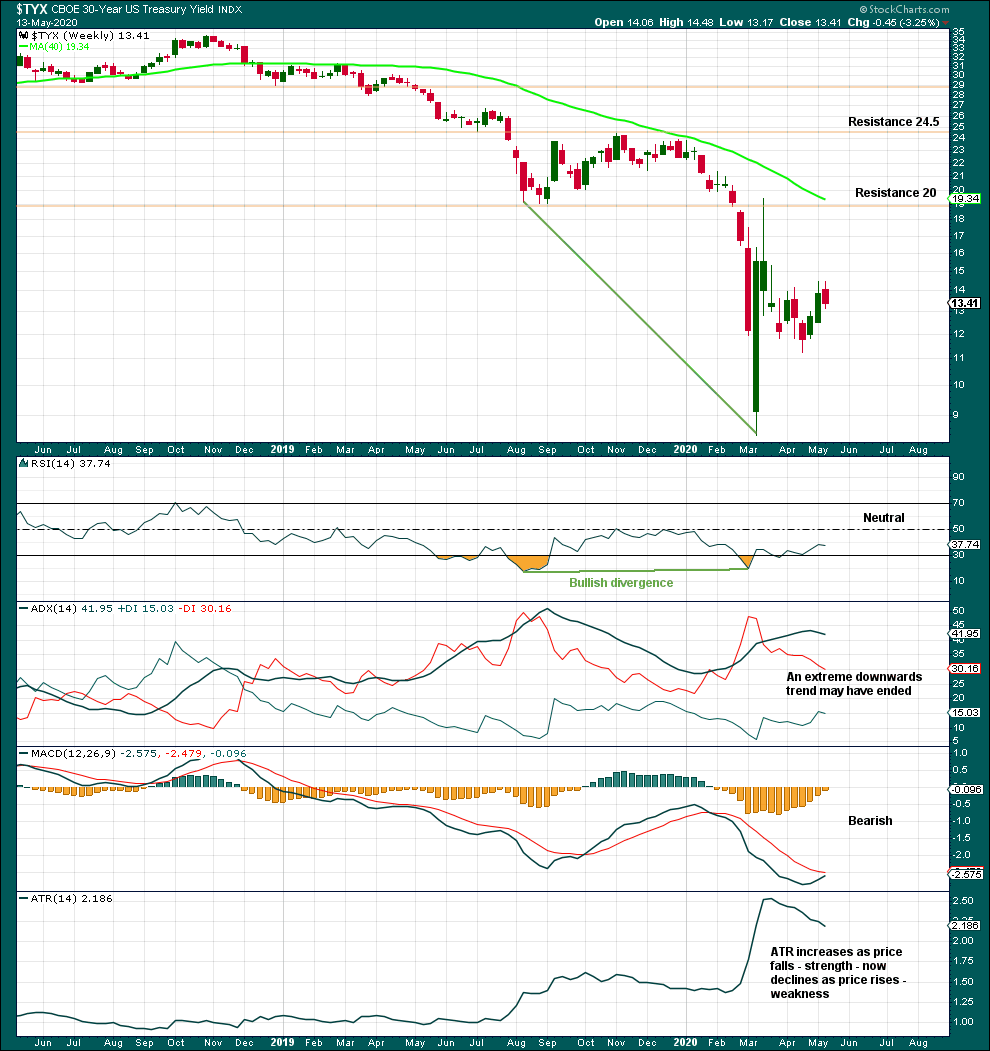
Click chart to enlarge.
Strong bullish divergence between price and RSI after RSI reached oversold suggests a bounce or consolidation to relieve extreme conditions. That may be incomplete.
DAILY CHART
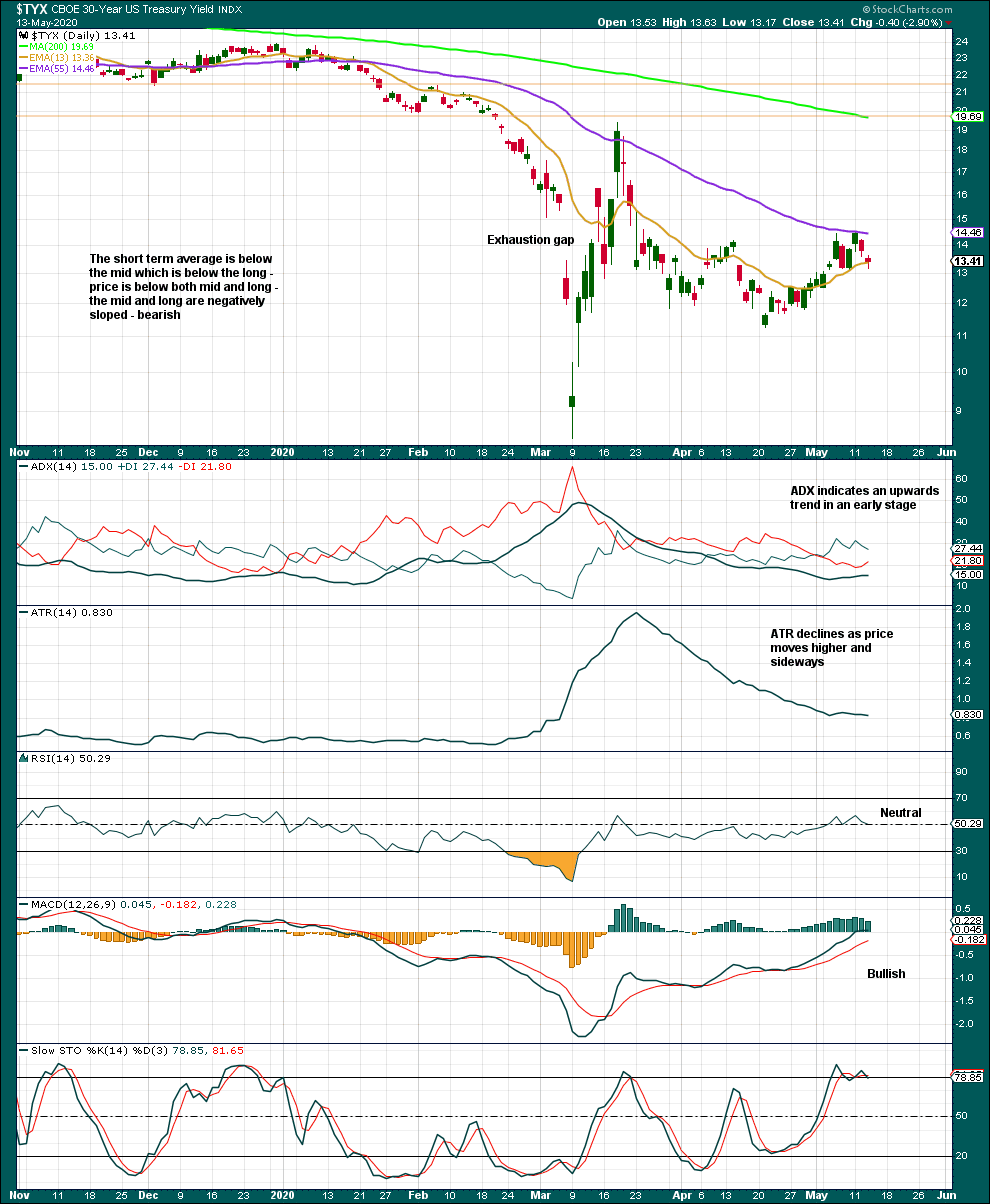
Click chart to enlarge.
Upwards and sideways movement so far looks like a counter trend movement. It is an upwards trend at this time frame. There is no bearish candlestick reversal pattern and conditions are not yet overbought. If either of these situations arise, then the counter trend movement may be over and a downwards trend may then resume.
Published @ 12:00 a.m. EST on May 14, 2020.
—
Careful risk management protects your trading account(s).
Follow my two Golden Rules:
1. Always trade with stops.
2. Risk only 1-5% of equity on any one trade.
—
New updates to this analysis are in bold.