
MU: Technical Analysis | Charts – April 16, 2020
The larger picture is bullish, but the short-term picture suggests a possible change to a bear market.
Summary: For the short term, a bounce may be over. A close below the prior major swing low at 28.39 may indicate a bear market.
MONTHLY CHART
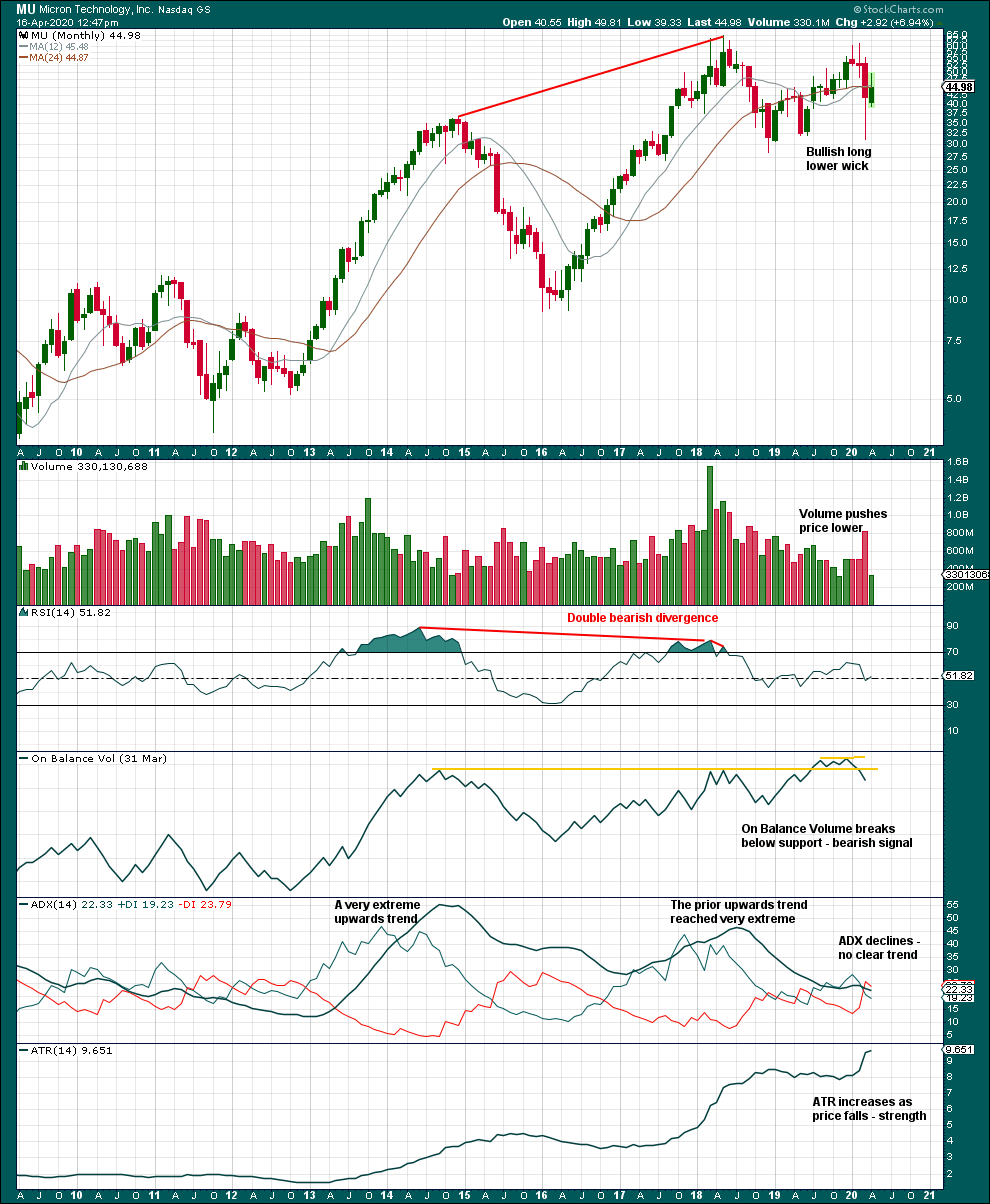
Click chart to enlarge.
The bullishness of the long lower wick on the March candlestick is overshadowed by bearishness in volume. More downwards movement may overall be expected.
The last major swing low at 28.39 has not been breached. This price point is significant. A close below 28.39 may indicate a bear market for MU, but at this stage, MU may remain in a bull market.
WEEKLY CHART
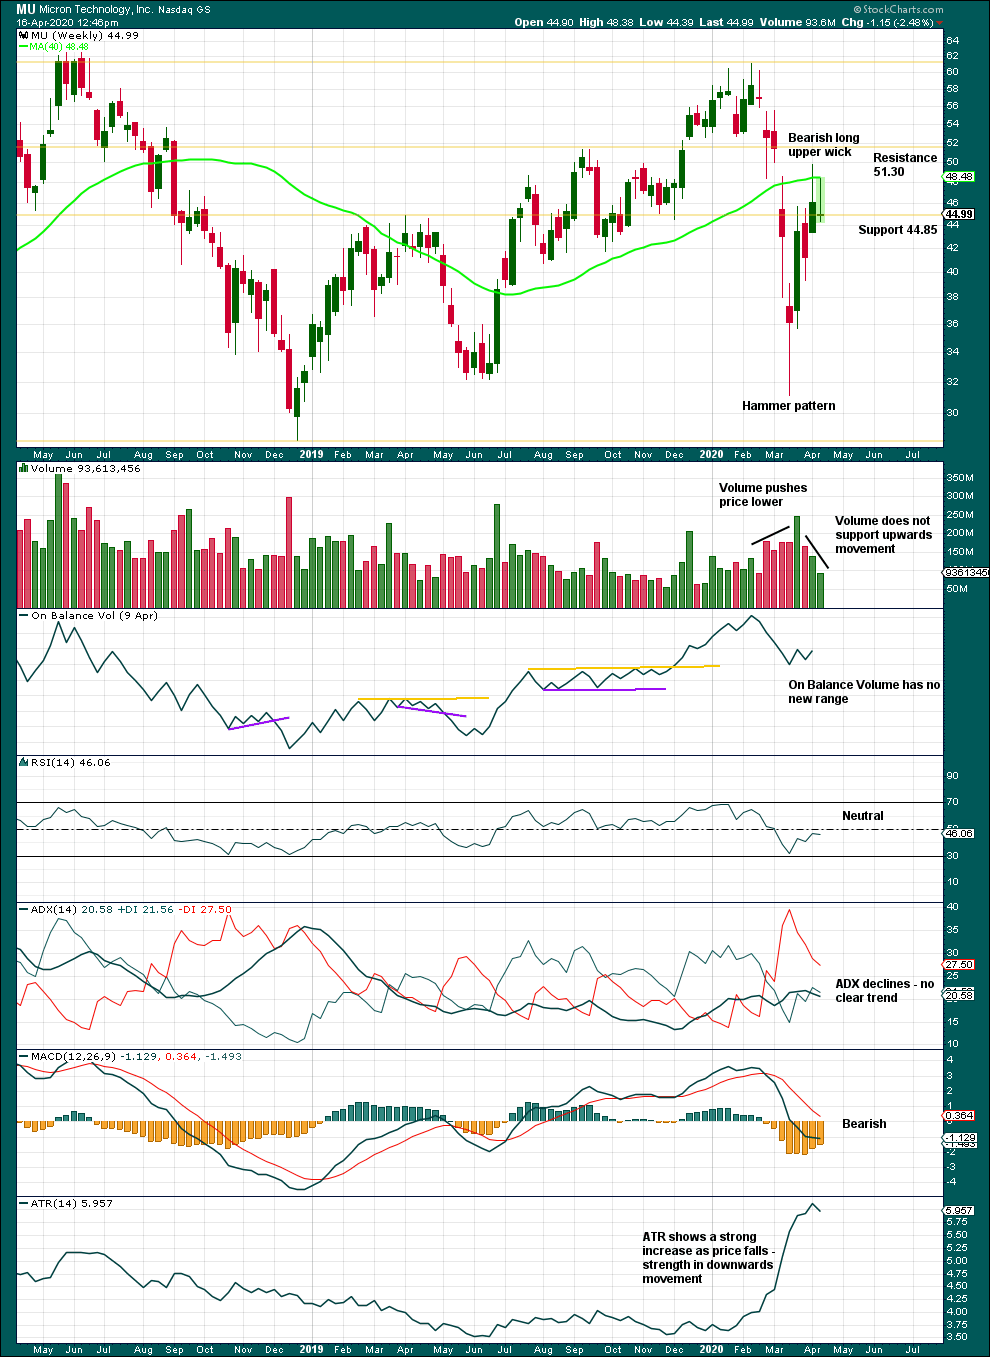
Click chart to enlarge.
Upwards movement of the last three weeks lacks volume and ends with a bearish long upper wick. This may be a counter trend movement.
DAILY CHART
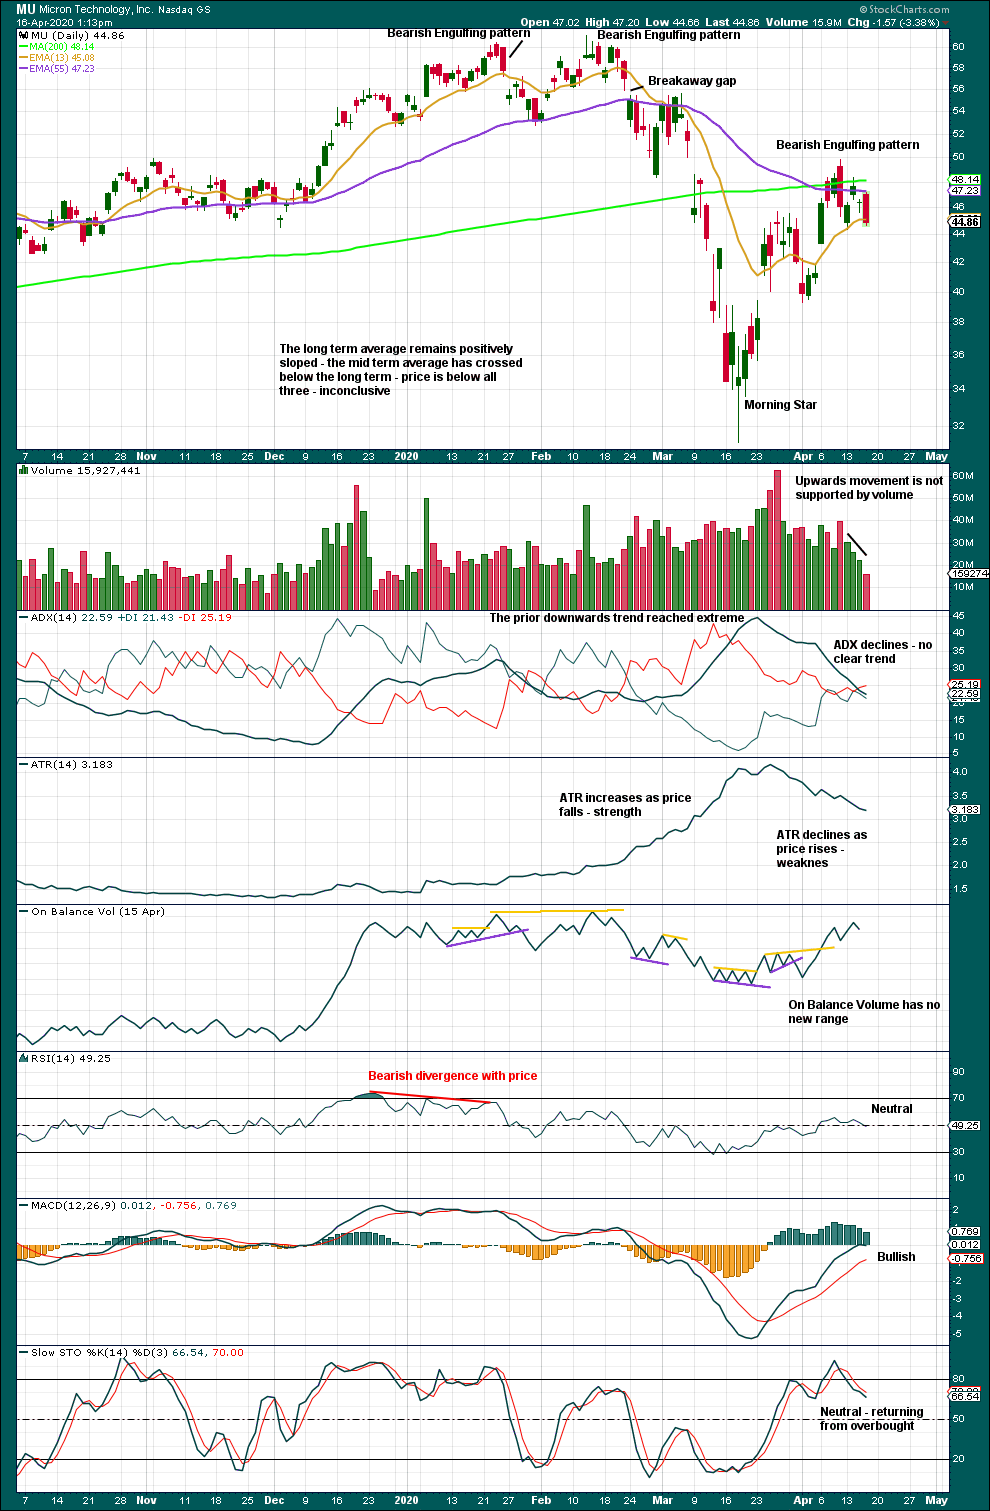
Click chart to enlarge.
MU may have finished an upwards bounce.
Published @ 09:13 p.m. EST.
—
Careful risk management protects your trading account(s).
Follow my two Golden Rules:
1. Always trade with stops.
2. Risk only 1-5% of equity on any one trade.
—
New updates to this analysis are in bold.