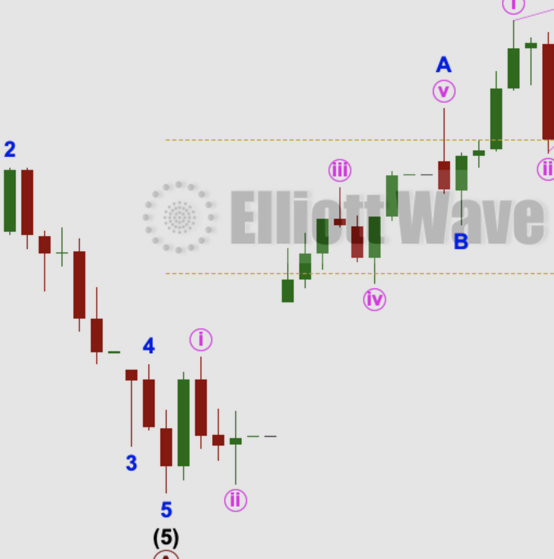
by Lara | Dec 9, 2020 | S&P 500, S&P 500 + DJIA
S&P 500: Elliott Wave and Technical Analysis | Charts – December 9, 2020 A little downwards movement was expected. Price has remained above the short-term invalidation point. Summary: The wave count expects the low of the 30th of October to not be breached for...
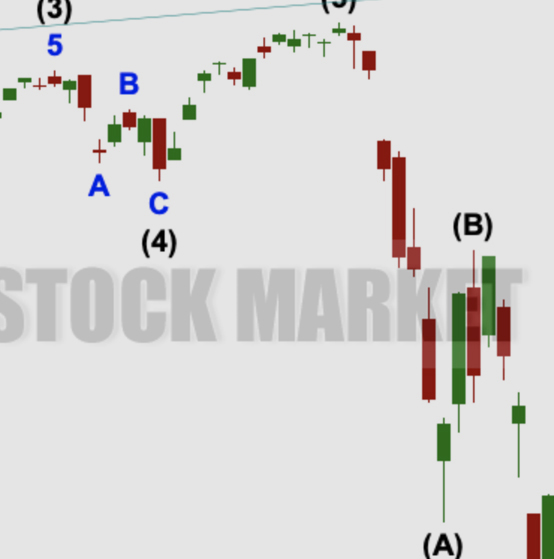
by Lara | Nov 16, 2020 | S&P 500, S&P 500 + DJIA
S&P 500: Elliott Wave and Technical Analysis | Charts – November 16, 2020 Upwards movement continues as the main short and long-term Elliott wave counts expect. Today all of On Balance Volume, ADX, the AD line and, for the short term, VIX support the main Elliott...

by Lara | Oct 22, 2020 | S&P 500, S&P 500 + DJIA
S&P 500: Elliott Wave and Technical Analysis | Charts – October 22, 2020 For the very short term, a little more downwards movement to a target at 3,418 was expected before a reversal and upwards movement. Today the session began with downwards movement to a low...
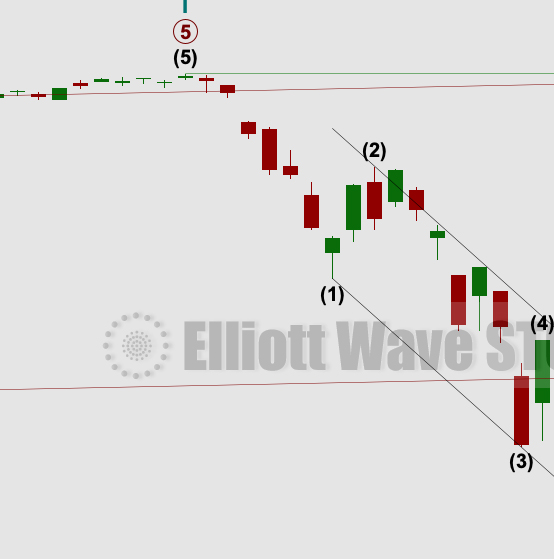
by Lara | Sep 29, 2020 | S&P 500, S&P 500 + DJIA
S&P 500: Elliott Wave and Technical Analysis | Charts – September 29, 2020 After strength in upwards movement yesterday, a lack of follow through today supports either of the first two short-term Elliott wave counts. The larger picture at the weekly chart level...

by Lara | Sep 3, 2020 | S&P 500, S&P 500 + DJIA
S&P 500: Elliott Wave and Technical Analysis | Charts – September 3, 2020 A new low below 3,514.77 in the second hour of the session indicated at least a short-term high in place. Four Elliott wave counts are used that look at different degrees of correction....

by Lara | Aug 11, 2020 | S&P 500, S&P 500 + DJIA
S&P 500: Elliott Wave and Technical Analysis | Charts – August 11, 2020 Upwards movement continued a little further before the session ended strongly lower. Summary: A high may be in place for the mid or long term. A new low now below 3,235.32 would add...
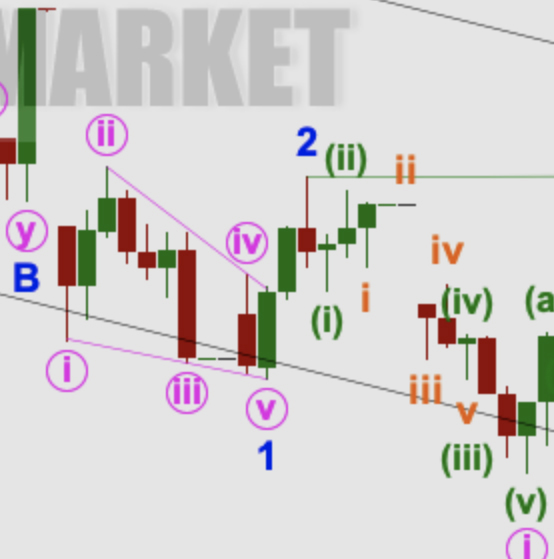
by Lara | Jul 17, 2020 | S&P 500, S&P 500 + DJIA
S&P 500: Elliott Wave and Technical Analysis | Charts – July 17, 2020 Sideways movement ends the week and sees the Elliott wave count remain the same. Summary: Sideways movement may continue next week. It may then be followed by a short lived upwards breakout...
by Lara | Jun 23, 2020 | S&P 500, S&P 500 + DJIA
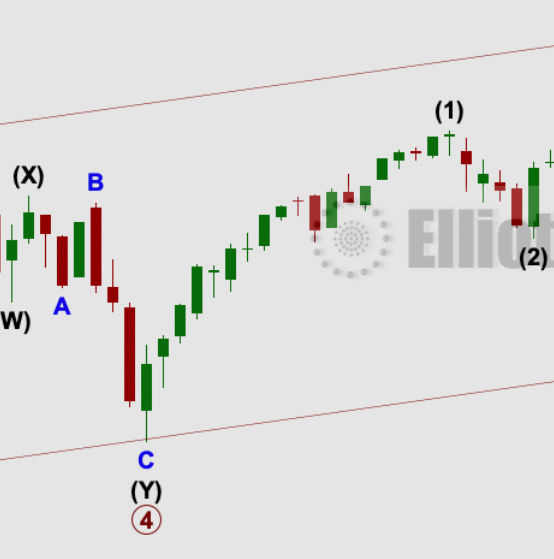
S&P 500: Elliott Wave and Technical Analysis | Charts – June 23, 2020 Again, price remains range bound. Summary: The bounce may be over. Downwards movement may resume. A mid-term target is at 2,723. The breakaway gap that forms the Island Reversal pattern may...

by Lara | May 29, 2020 | S&P 500, S&P 500 + DJIA
S&P 500: Elliott Wave and Technical Analysis | Charts – May 29, 2020 The first target has been exceeded. Now attention turns to the second target. Summary: The next target is at 3,238. Use the lower edge of the Elliott channel to indicate where support may be...


