
S&P 500: Elliott Wave and Technical Analysis | Charts – November 16, 2020
Today all of On Balance Volume, ADX, the AD line and, for the short term, VIX support the main Elliott wave count.
Summary: The main wave count expects a low is now in. The target is at 4,606 and an invalidation point at 3,233.94.
If the main wave count is invalidated with a new low below 3,233.94 and then 2,191.86, then an alternate may be used. This wave count is very bearish. It expects a strong wave down to a target at 1,708. The invalidation point is 666.76. This alternate wave count does not have support from classic technical analysis.
The biggest picture, Grand Super Cycle analysis, is here.
Monthly charts are last updated here with video here.
ELLIOTT WAVE COUNTS
MAIN WAVE COUNT
WEEKLY CHART
Click chart to enlarge.
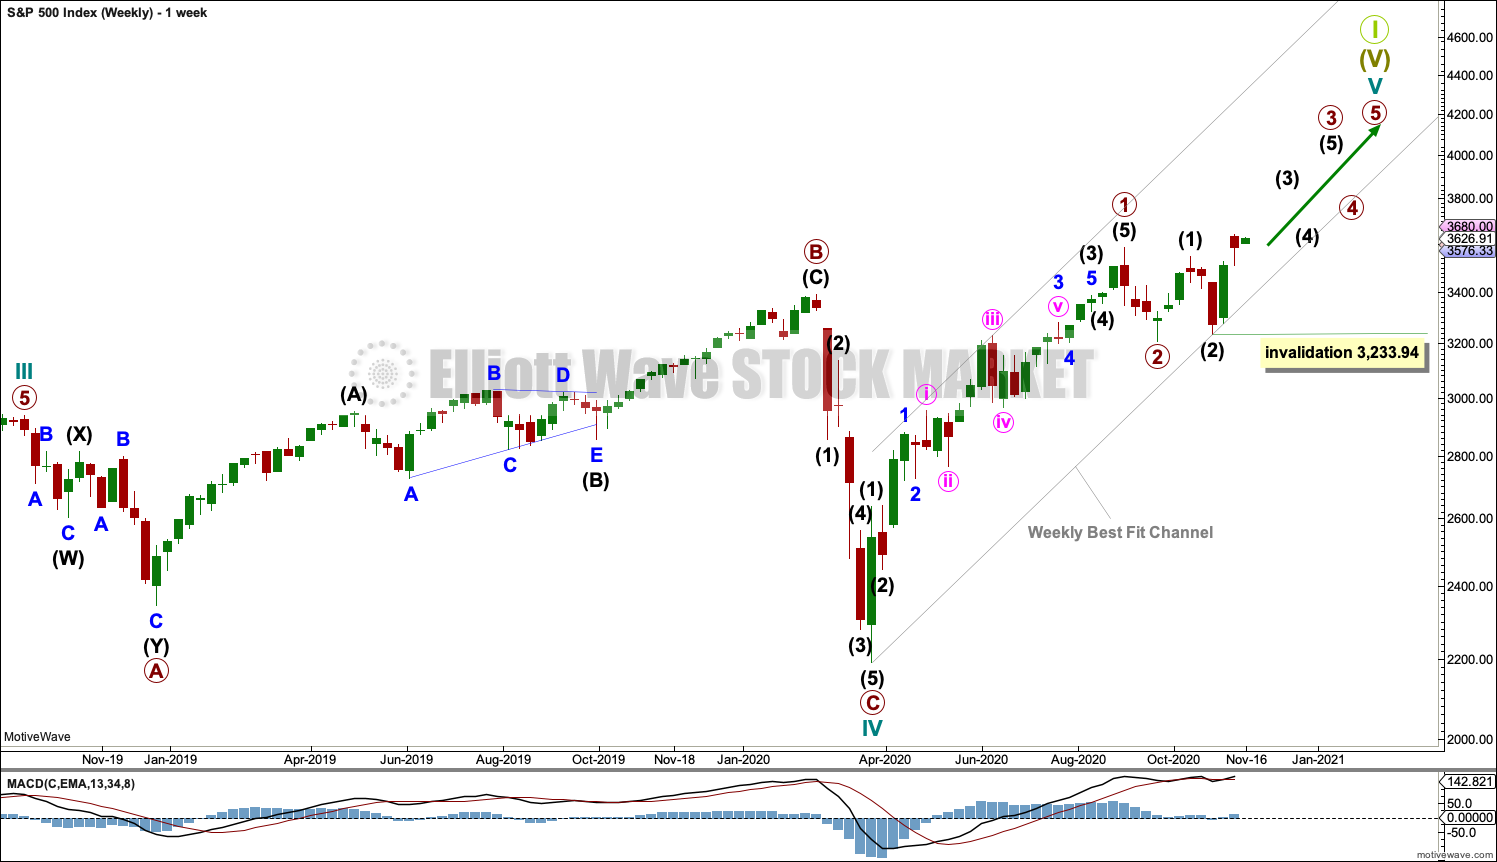
Cycle wave V may last from one to several years. So far it is in its eighth month.
This wave count may allow time for the AD line to diverge from price as price makes final highs before the end of the bull market. The AD line most commonly diverges a minimum of 4 months prior to the end of a bull market.
Cycle wave V would most likely subdivide as an impulse. But if overlapping develops, then an ending diagonal should be considered. This chart considers the more common impulse.
Primary waves 1 and 2 may be complete.
Primary wave 3 may only subdivide as an impulse.
There is already a Fibonacci ratio between cycle waves I and III within Super Cycle wave (V). The S&P500 often exhibits a Fibonacci ratio between two of its actionary waves but rarely between all three; it is less likely that cycle wave V would exhibit a Fibonacci ratio. The target for Super Cycle wave (V) to end would best be calculated at primary degree, but that cannot be done until all of primary waves 1, 2, 3 and 4 are complete.
DAILY CHART
Click chart to enlarge.
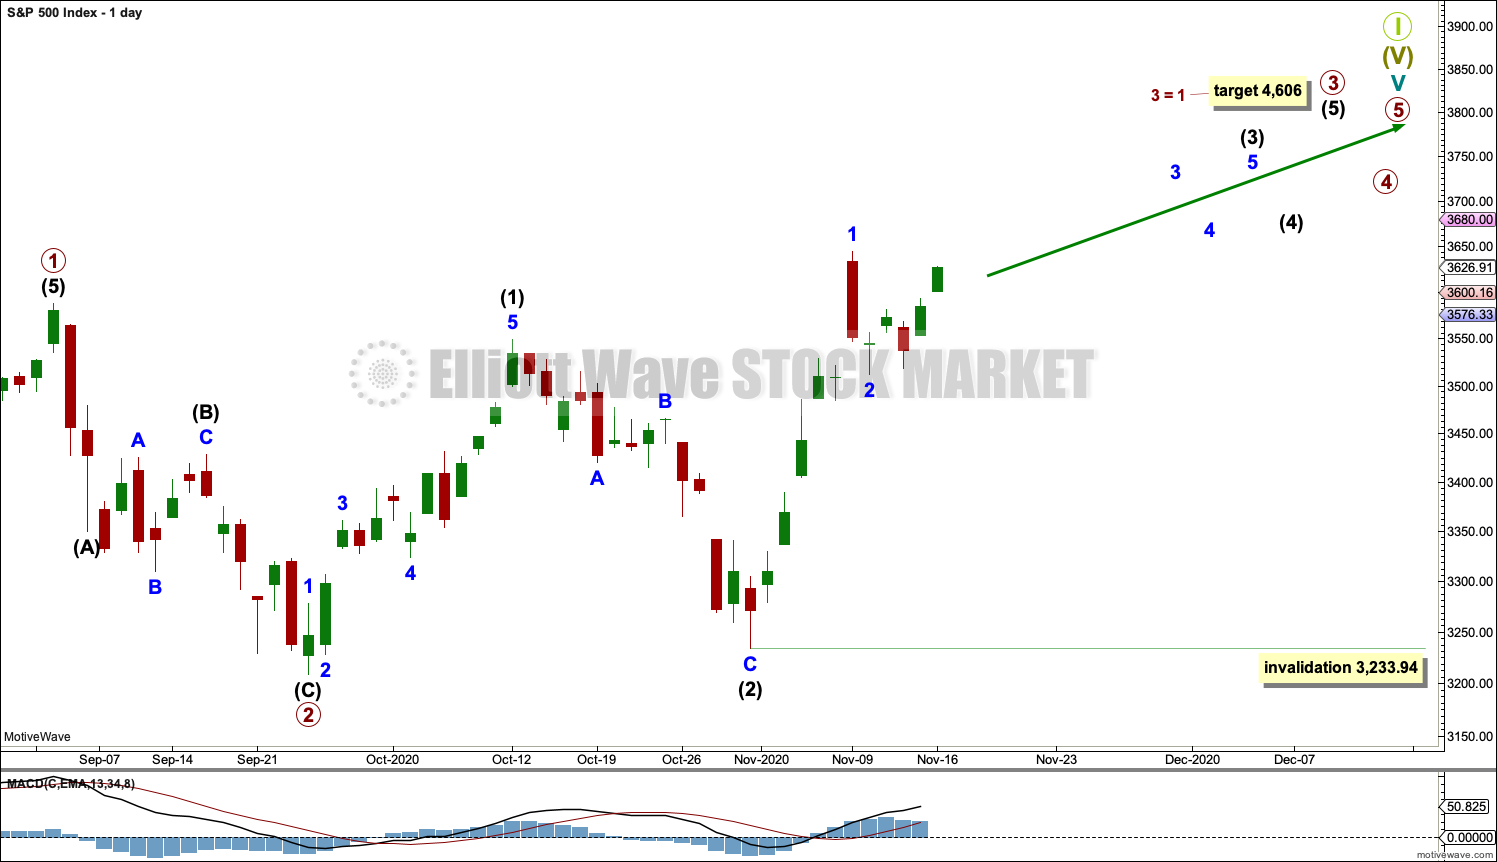
Primary waves 1 and 2 may both be complete. Primary wave 3 may now be underway.
Primary wave 3 may only subdivide as an impulse. Within primary wave 3: Intermediate waves (1) and (2) may both be complete, and intermediate wave (3) may now be underway and may only subdivide as an impulse.
No second wave correction within intermediate wave (3) may move beyond the start of its first wave below 3,233.94.
Primary wave 1 looks extended. The target for primary wave 3 expects it to also be extended.
This wave count now expects that a third wave at three degrees (minor, intermediate and primary) has just begun. An increase in upwards momentum is expected if this wave count is correct.
HOURLY CHART
Click chart to enlarge.
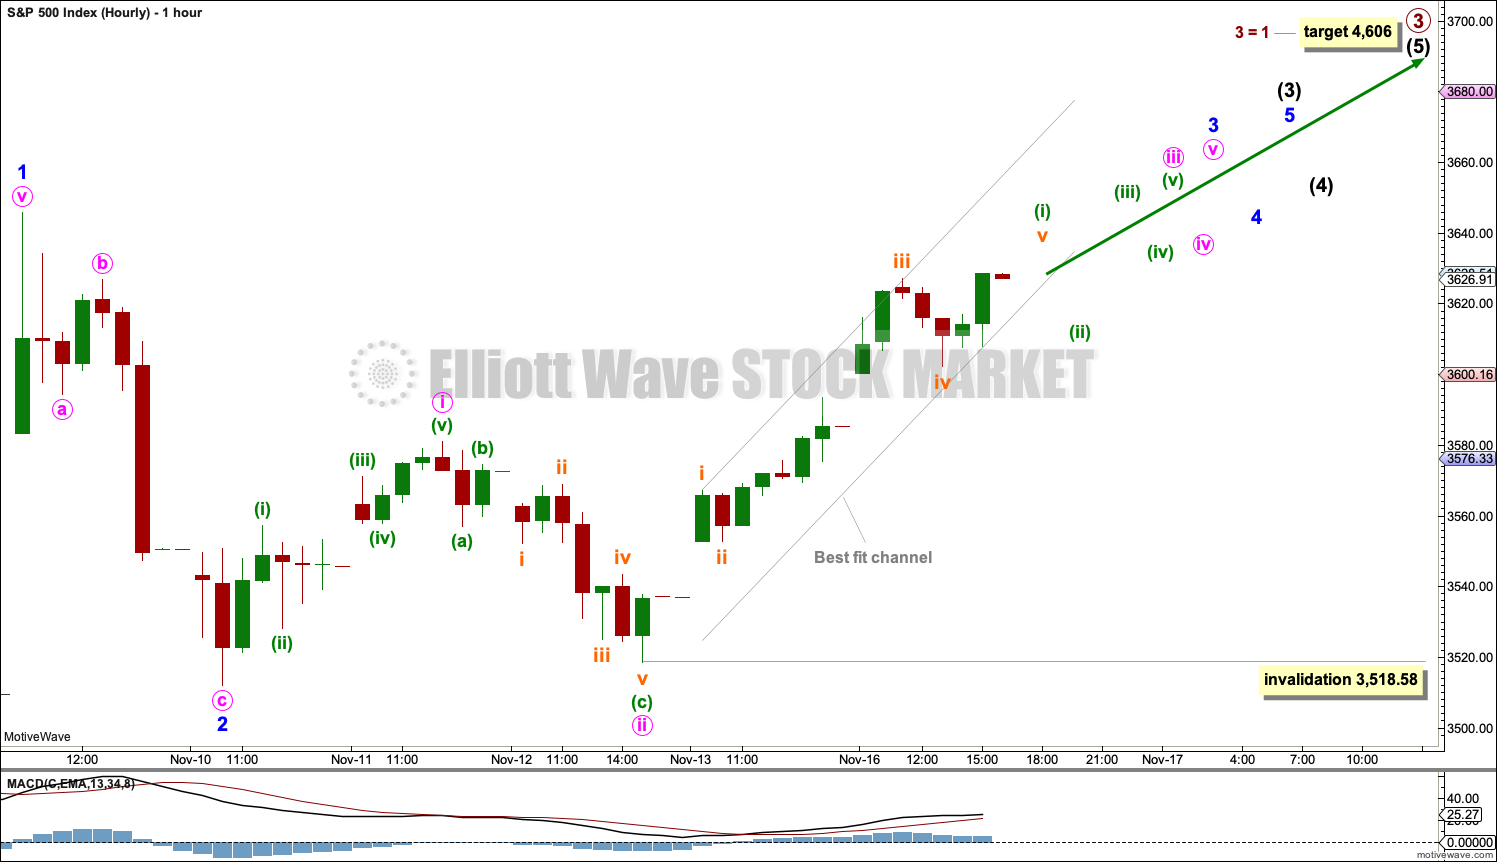
Intermediate wave (3) may only subdivide as an impulse at minor degree.
Minor waves 1 and 2 within intermediate wave (3) may be complete. A third wave up at three degrees may now begin. This wave count expects an increase in upwards momentum.
Minor wave 3 may only subdivide as an impulse. Minute waves i and ii within minor wave 3 may be complete. Minuette wave (ii) within minute wave iii may not move beyond the start of minuette wave (i) below 3,518.58.
Draw a narrow best fit channel about minuette wave (i) as shown. If this channel is breached by downwards movement with at least one full hourly candlestick below and not touching the lower edge of the channel, then that may be taken as an indication that minuette wave (i) may be over and minuette wave (ii) may be underway. Draw a Fibonacci retracement along the length of minuette wave (i) and use the 0.382 Fibonacci ratio as a preferred target for support.
At this point in a third wave at multiple degrees, corrections may now begin to be more shallow although they may not necessarily be brief. When third waves extend, they do so in price and time, which may cause corrections within them to be of a longer duration, which requires patience.
ALTERNATE HOURLY CHART
Click chart to enlarge.
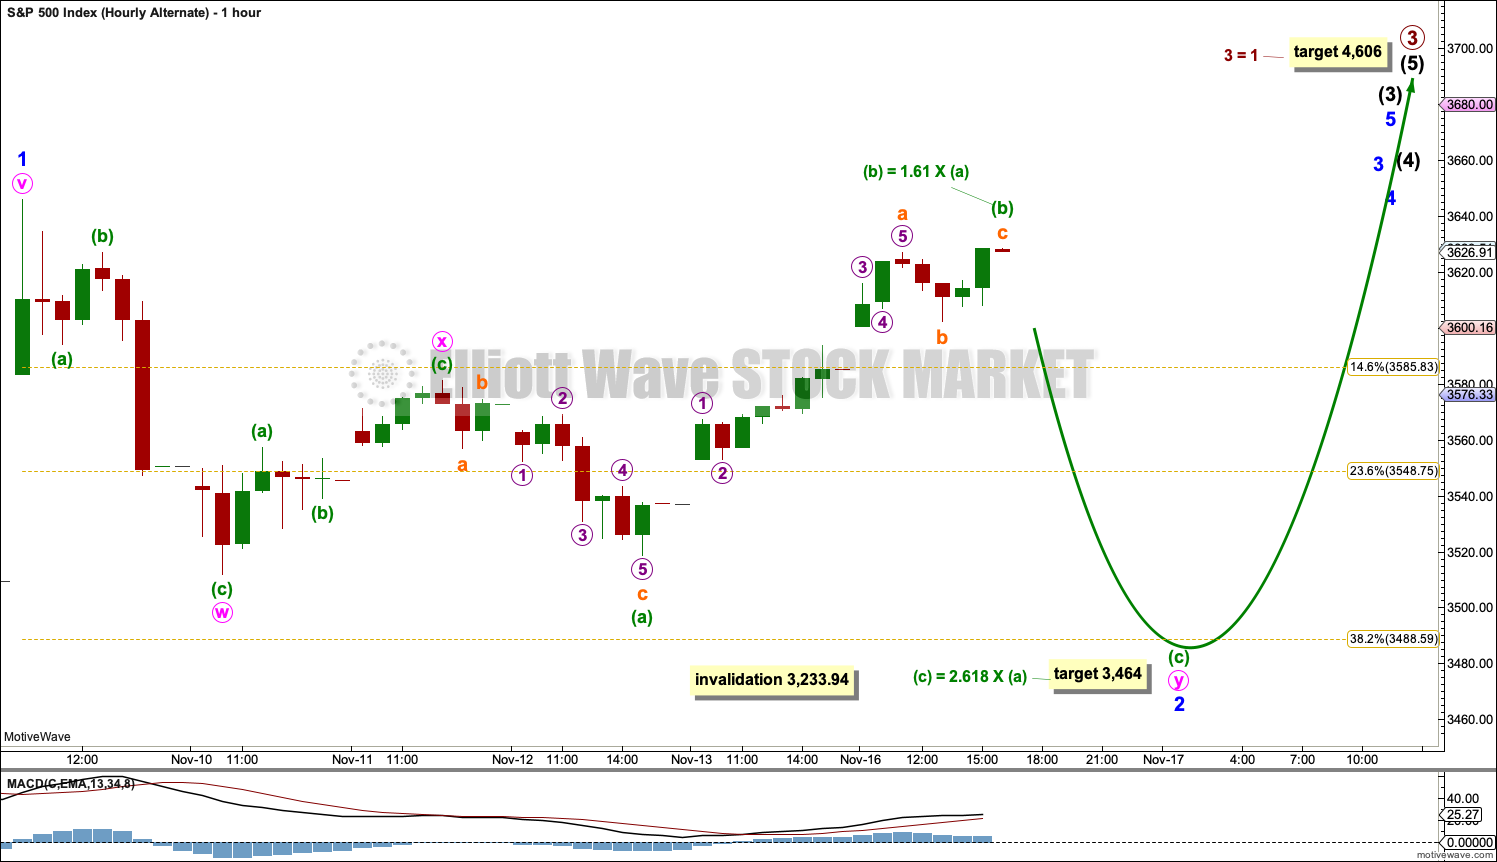
This alternate wave count only moves the degree of labelling within minor wave 2 down one degree. Minor wave 2 may continue sideways as a double combination. The first structure in the double may be a zigzag labelled minute wave w. The double may be joined by a complete three in the opposite direction, a zigzag labelled minute wave x. The second structure in the double may be an incomplete expanded flat labelled minute wave y. Today minuette wave (b) may have continued higher. It is now beyond the common range of up to 1.38 times the length of minuette wave (a). The probability of this wave count is slightly reduced.
Minuette wave (c) within minute wave y would be extremely likely to make at least a slight new low below the end of minuette wave (a) at 3,518.58 to avoid a truncation and a very rare running flat. A target is re-calculated that expects minuette wave (c) to exhibit a Fibonacci ratio to minuette wave (a).
Combinations are sideways consolidations. When this consolidation is complete, then an upwards breakout to new all time highs would be expected.
Minor wave 2 may not move beyond the start of minor wave 1 below 3,233.94.
Today this wave count lacks support from classic technical analysis. It now has a fairly low probability.
ALTERNATE WAVE COUNT
WEEKLY CHART
Click chart to enlarge.
To view the material difference between the main and this alternate wave count, monthly charts should be viewed. There is a link to charts, text and video analysis of monthly charts at the top of this analysis.
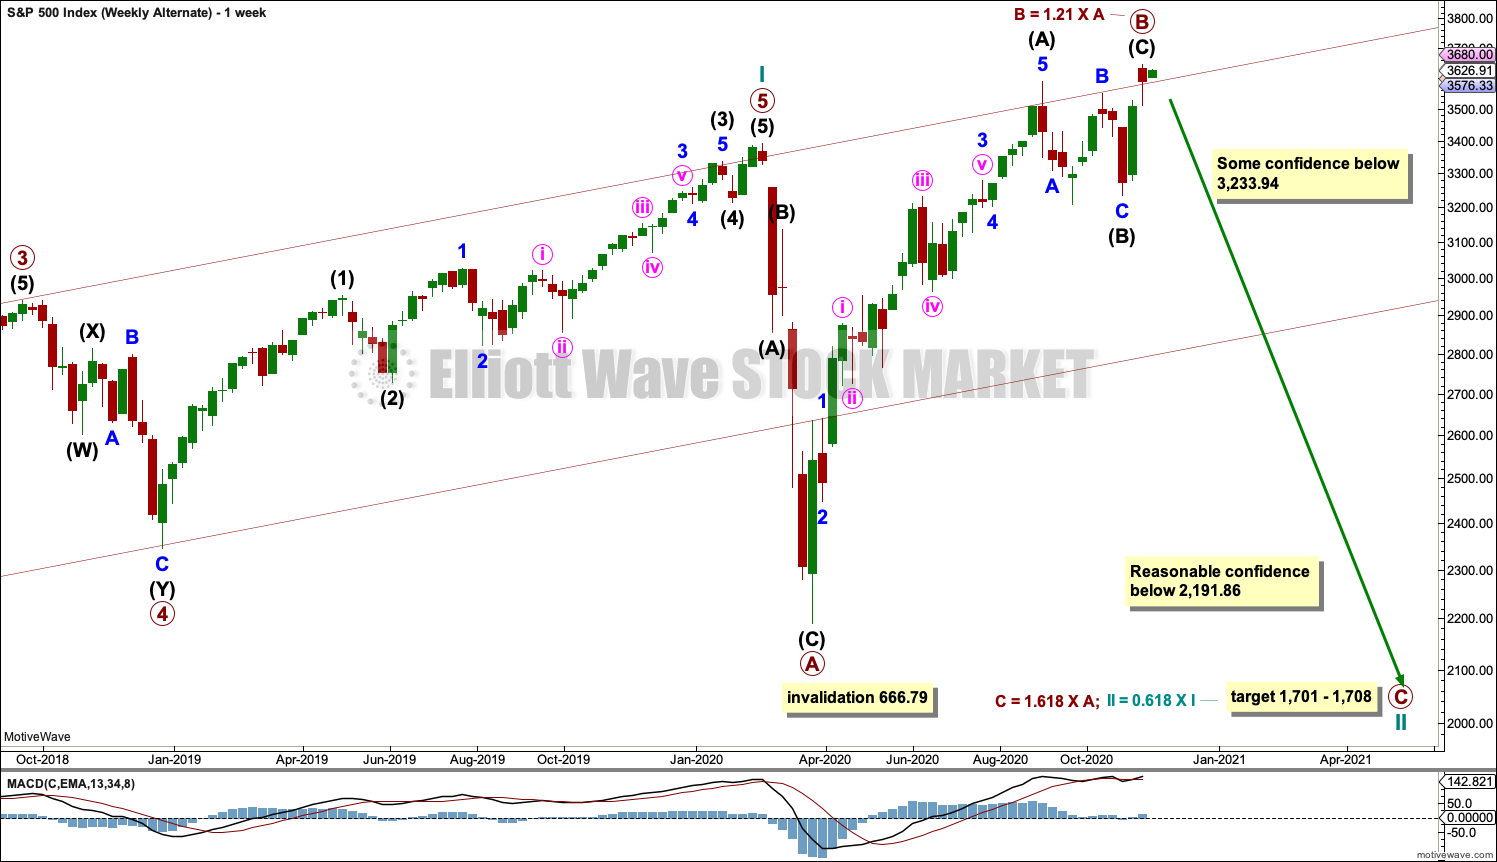
Cycle wave II may be subdividing as an expanded flat. Primary wave B within the expanded flat is a 1.21 length of primary wave A, which is within the most common range for B waves within flats of up to 1.38. Expanded flats are reasonably common structures.
A 7 point target zone is calculated at two wave degrees.
Cycle wave II may not move beyond the start of cycle wave I below 666.79.
DAILY CHART
Click chart to enlarge.
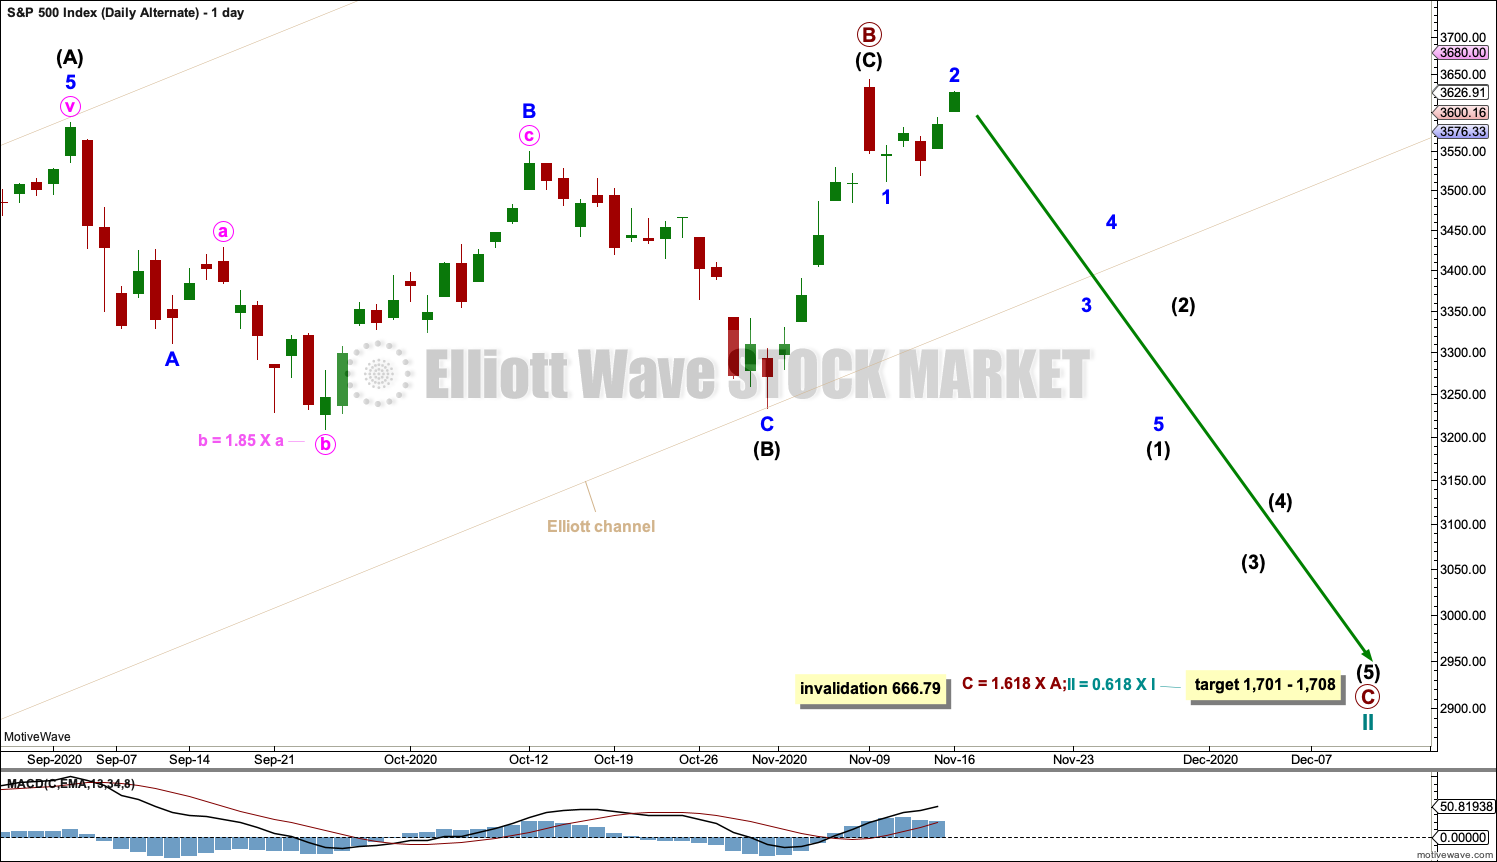
Primary wave B may be complete as a zigzag at today’s high. Primary wave C may now begin and must subdivide as a five wave motive structure, most likely an impulse.
Cycle wave II may not move beyond the start of cycle wave I below 666.79.
There is no upper invalidation point for this wave count; primary wave B could continue higher as a double zigzag. The common range for B waves within flat corrections is from 1 to 1.38 times the length of their corresponding A waves. This gives a range within primary wave B that may continue up to 3,850.15. Prior to this price point being reached, it may be possible to discard this alternate wave count based upon technical analysis.
TECHNICAL ANALYSIS
WEEKLY CHART
Click chart to enlarge. Chart courtesy of StockCharts.com.
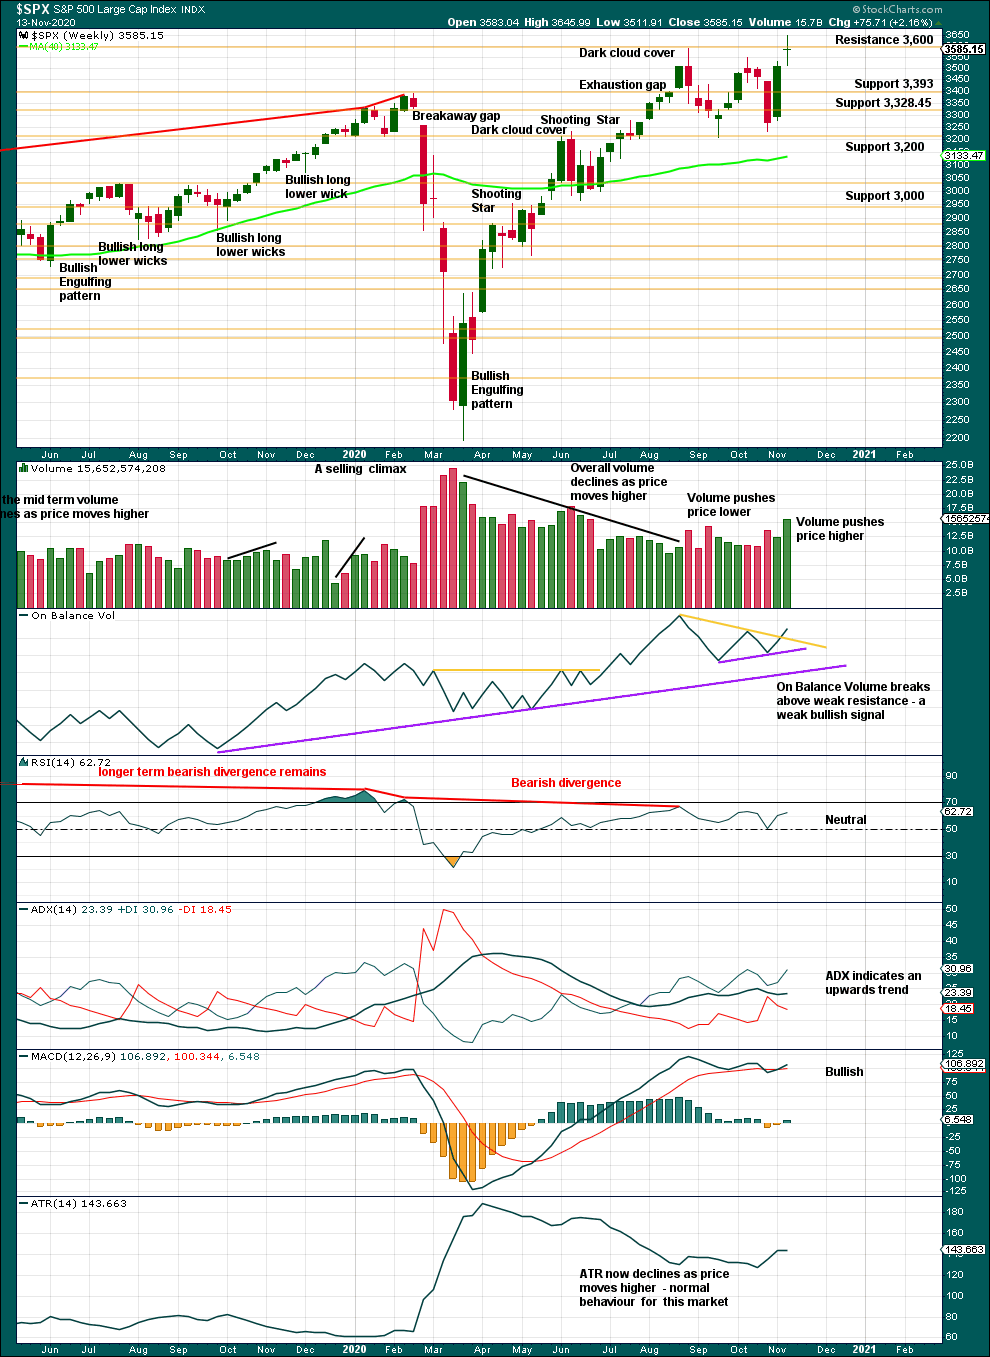
This chart is bullish and supports the main Elliott wave count. All of volume, On Balance Volume, ADX and MACD are bullish. The doji last week is not on its own a reversal signal; on its own a doji represents a pause. Only if this week completes a red candlestick that opens lower would the doji then be part of a bearish pattern, which has not happened yet.
DAILY CHART
Click chart to enlarge. Chart courtesy of StockCharts.com.
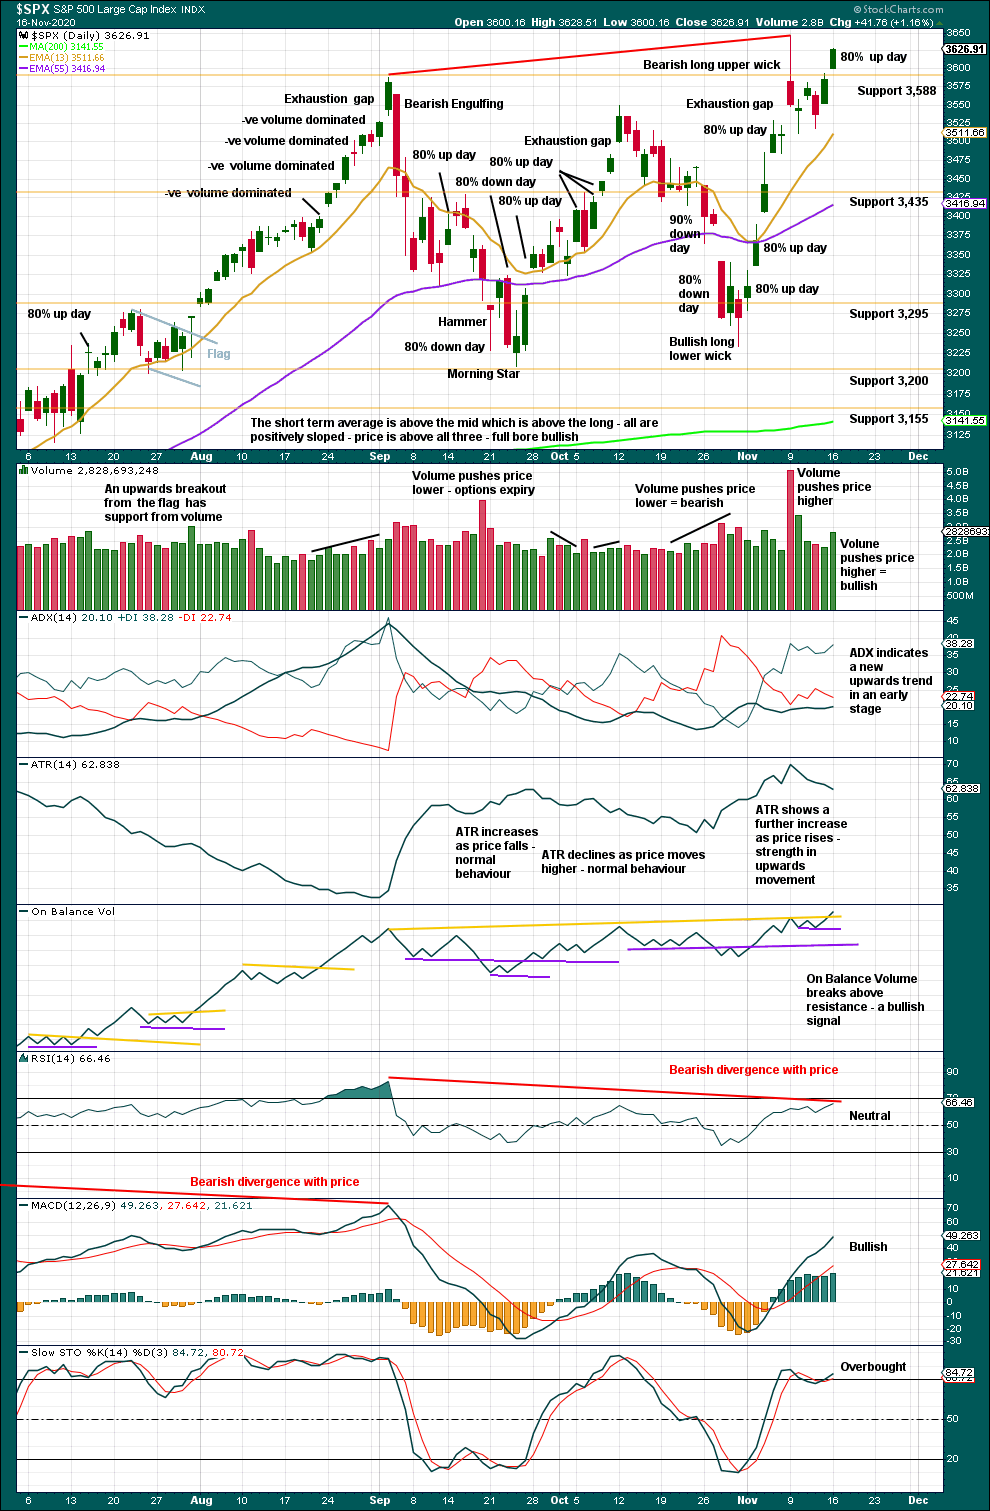
There is an upwards trend. When this market trends, then Stochastics may remain overbought for extended periods of time while price moves a considerable distance.
Today resistance at a prior high has been overcome. This chart is bullish and supports the main Elliott wave count.
BREADTH – AD LINE
WEEKLY CHART
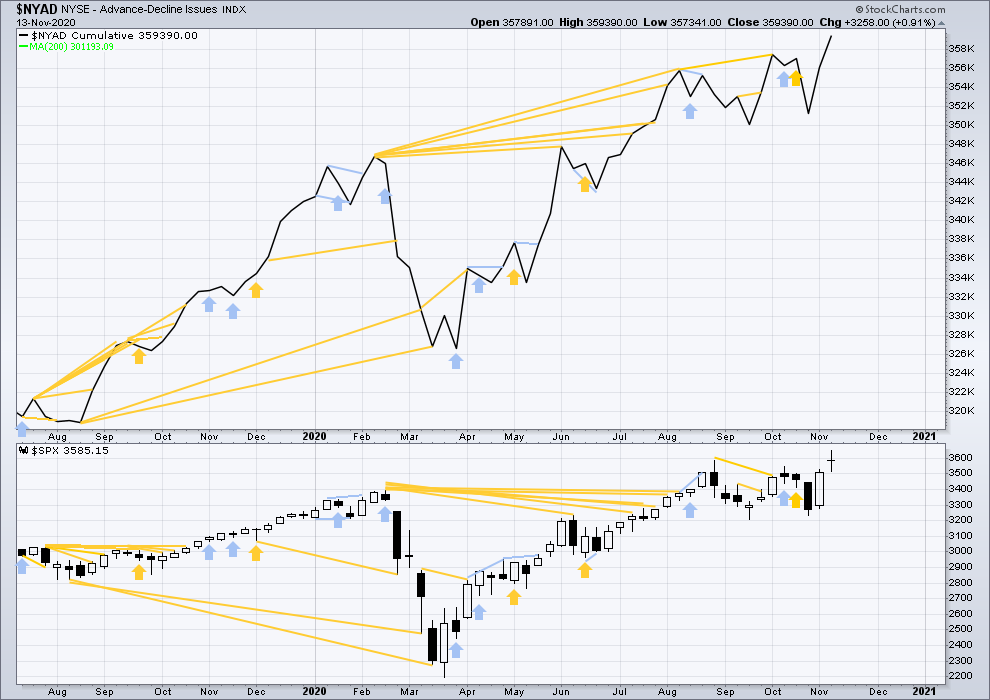
Click chart to enlarge. Chart courtesy of StockCharts.com. So that colour blind members are included, bearish signals will be noted with blue and bullish signals with yellow.
Breadth should be read as a leading indicator.
Lowry’s Operating Companies Only AD line has made a new all time high on the 12th of October. This erases prior bearish divergence with the last all time high in January 2020. With both the NYSE and OCO AD lines making new all time highs, breadth is leading price. This is a strong bullish signal and supports the main Elliott wave count.
Large caps all time high: 3,645.99 on November 9, 2020.
Mid caps all time high: 2,162.80 on November 9, 2020.
Small caps all time high: 1,100.58 on August 27, 2018.
Last week both price and the AD line have made new all time highs. Upwards movement has support from rising market breadth. This supports the Elliott wave count.
DAILY CHART
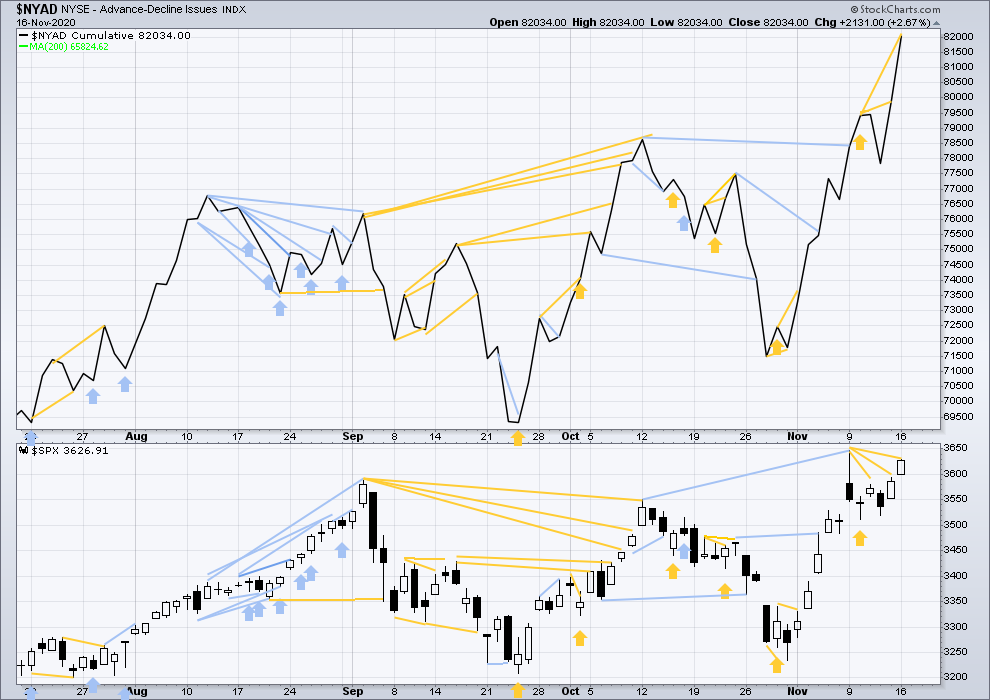
Click chart to enlarge. Chart courtesy of StockCharts.com. So that colour blind members are included, bearish signals will be noted with blue and bullish signals with yellow.
Today the AD line has made another new all time high, but price has not. This divergence is bullish and supports the main Elliott wave count.
VOLATILITY – INVERTED VIX CHART
WEEKLY CHART
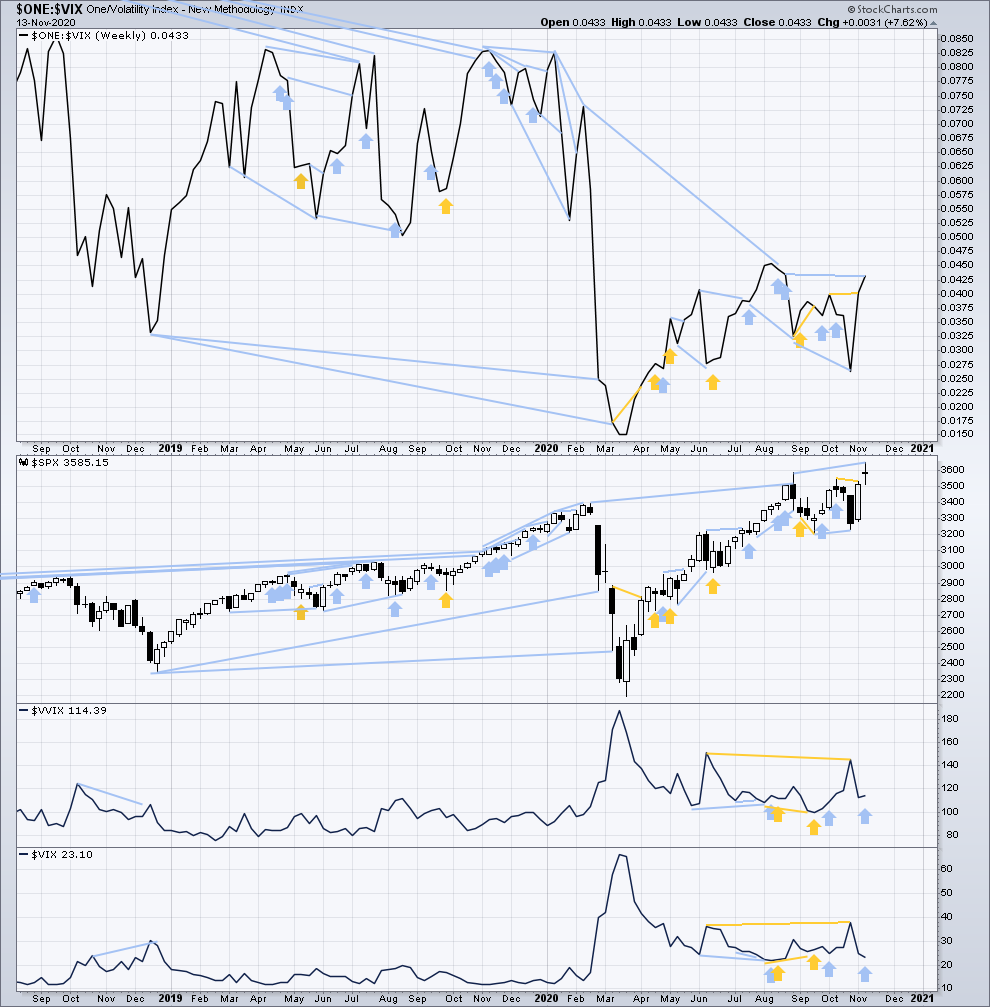
Click chart to enlarge. Chart courtesy of StockCharts.com. So that colour blind members are included, bearish signals will be noted with blue and bullish signals with yellow.
Inverted VIX remains well below all time highs. The all time high for inverted VIX was in the week beginning October 30, 2017. There is over 3 years of bearish divergence between price and inverted VIX. There is all of long, mid and short-term bearish divergence. This supports the alternate Elliott wave count.
Last week price has made a new all time high, but inverted VIX has not. There is new short-term bearish divergence between price and inverted VIX.
Comparing VIX and VVIX: VIX has declined last week as price has risen, but VVIX has increased. This divergence is bearish for price for the short term.
DAILY CHART
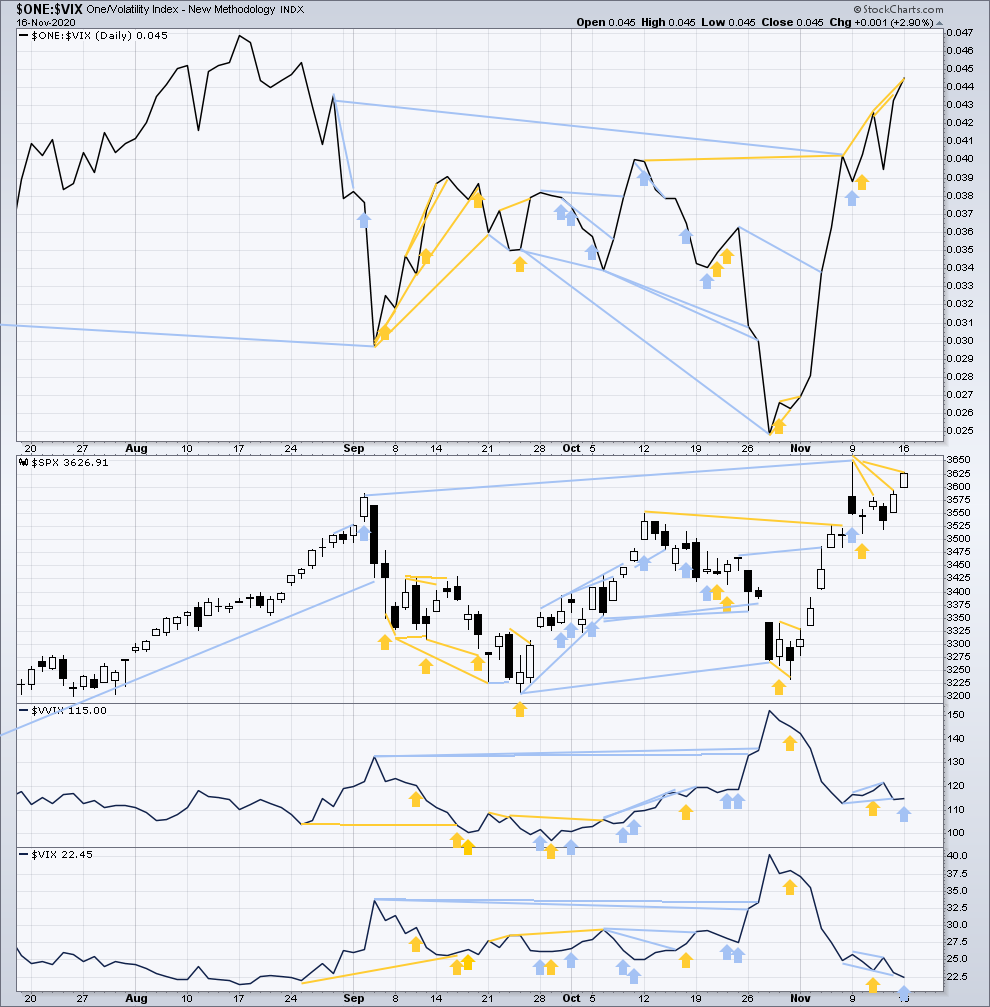
Click chart to enlarge. Chart courtesy of StockCharts.com. So that colour blind members are included, bearish signals will be noted with blue and bullish signals with yellow.
Today inverted VIX has made a new short-term high, but price has not. This divergence is bullish for the short term and supports the main Elliott wave count.
Comparing VIX and VVIX at the daily chart level: While price has moved higher today, VIX has moved lower, which is a normal relationship. However, VVIX has increased; this suggests short term bearishness for price.
DOW THEORY
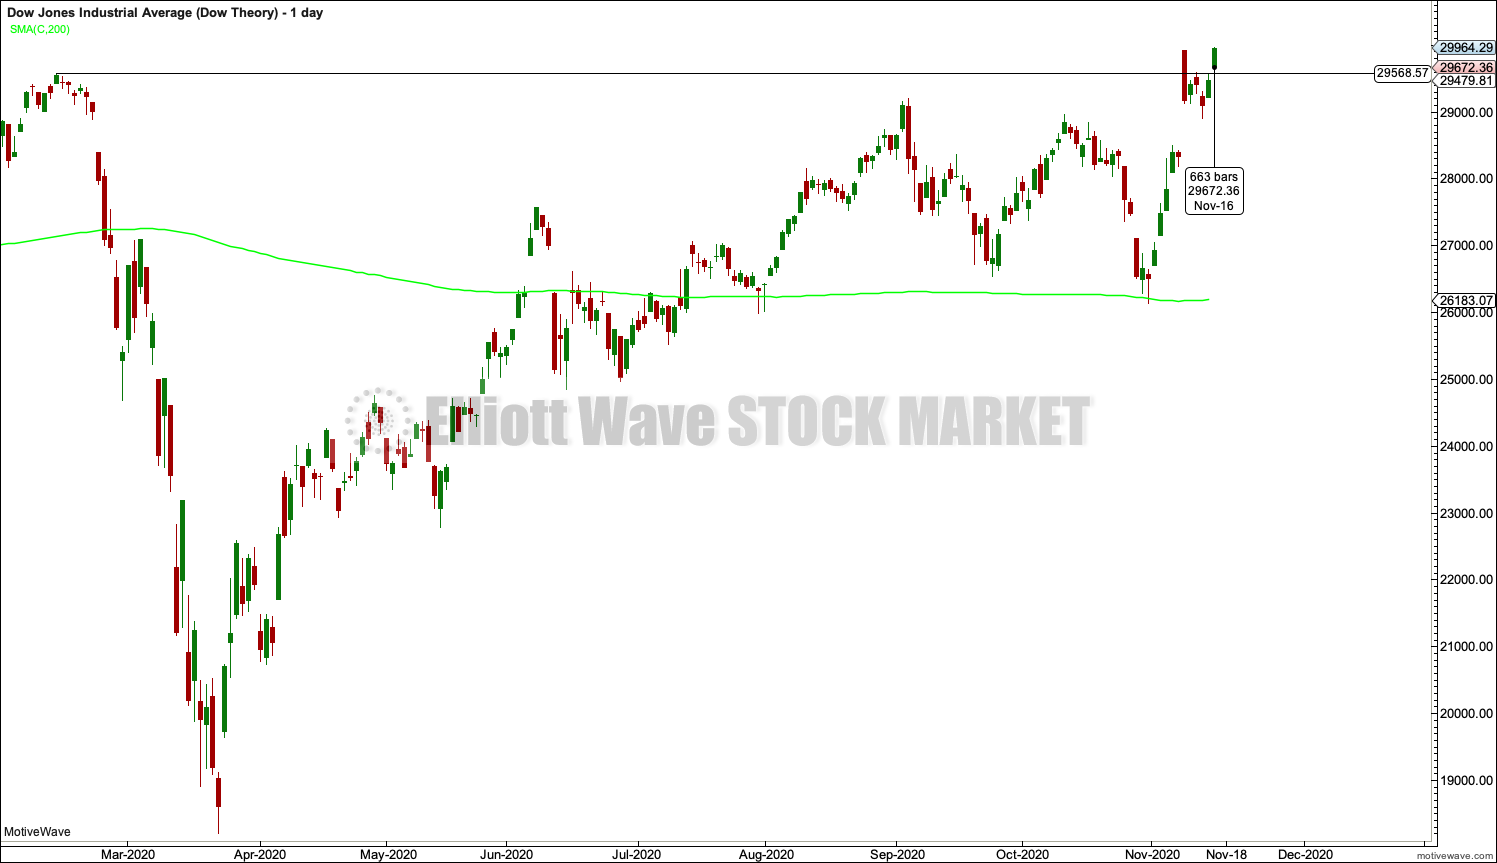
Today Dow Theory confirms a new bull market with new highs made on a closing basis:
DAILY CHART – DJIA
Click chart to enlarge.
DJIA: 29,568.57 – closed above on 16th November 2020.
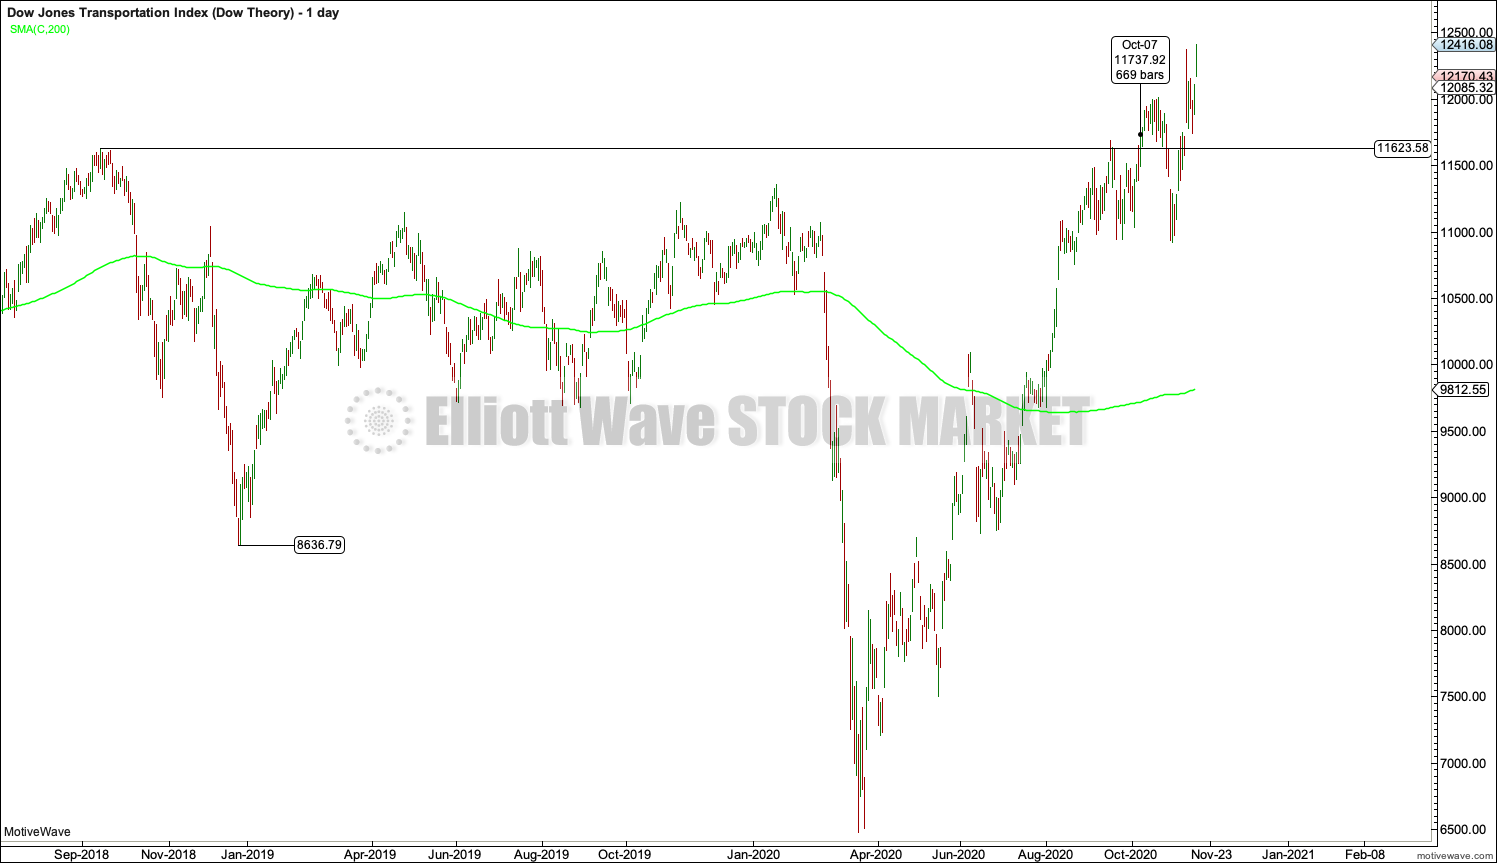
DAILY CHART – DJT
Click chart to enlarge.
DJT: 11,623.58 – closed above on 7th October 2020.
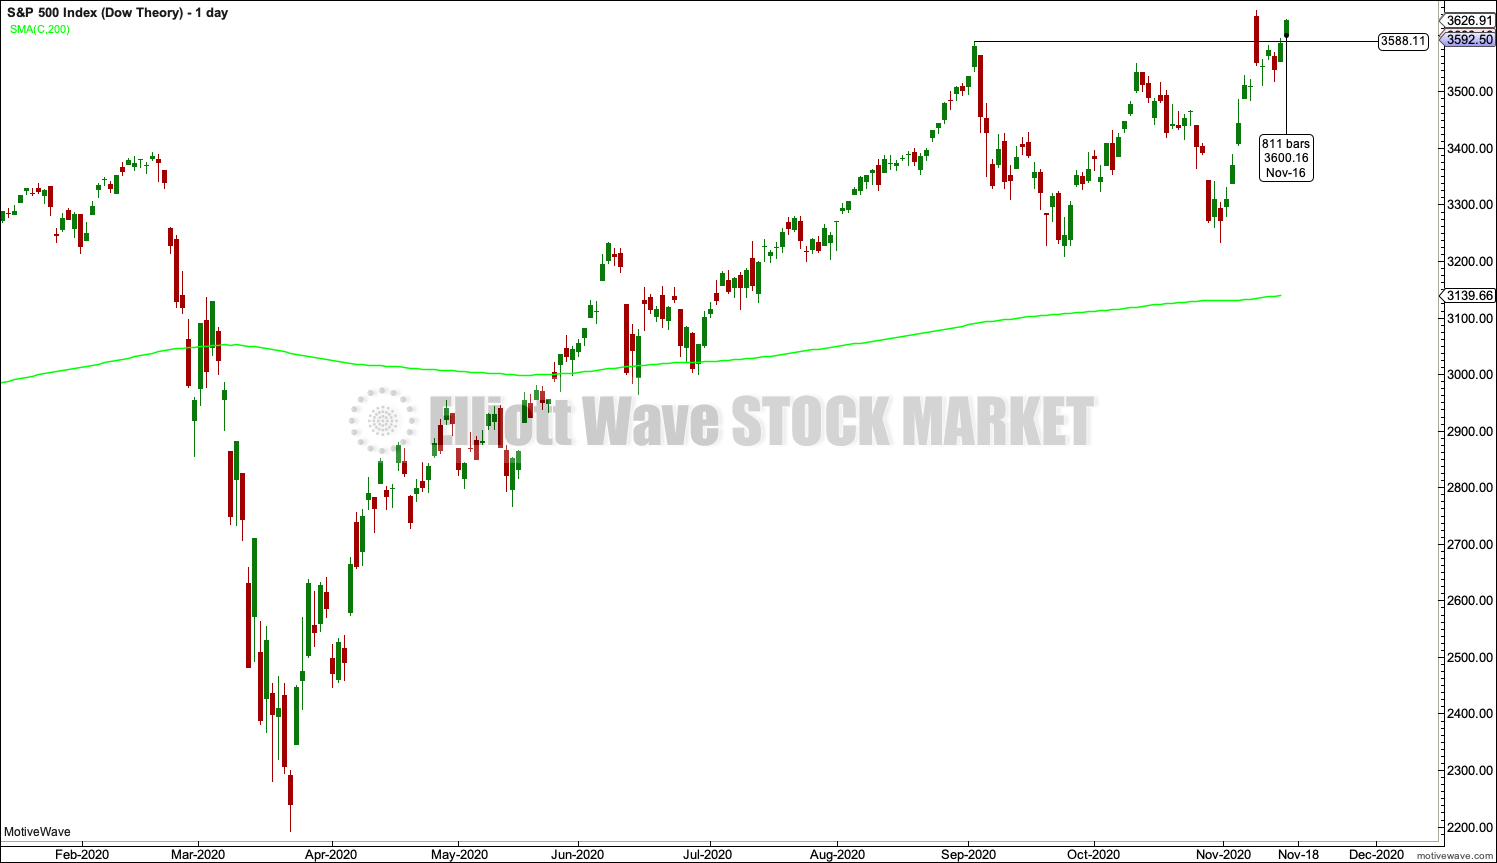
DAILY CHART – SPX
Click chart to enlarge.
Adding in the S&P and Nasdaq for an extended Dow Theory, confirmation of a bull market would require new highs made on a closing basis:
S&P500: 3,393.52 – closed above on 21st August 2020.
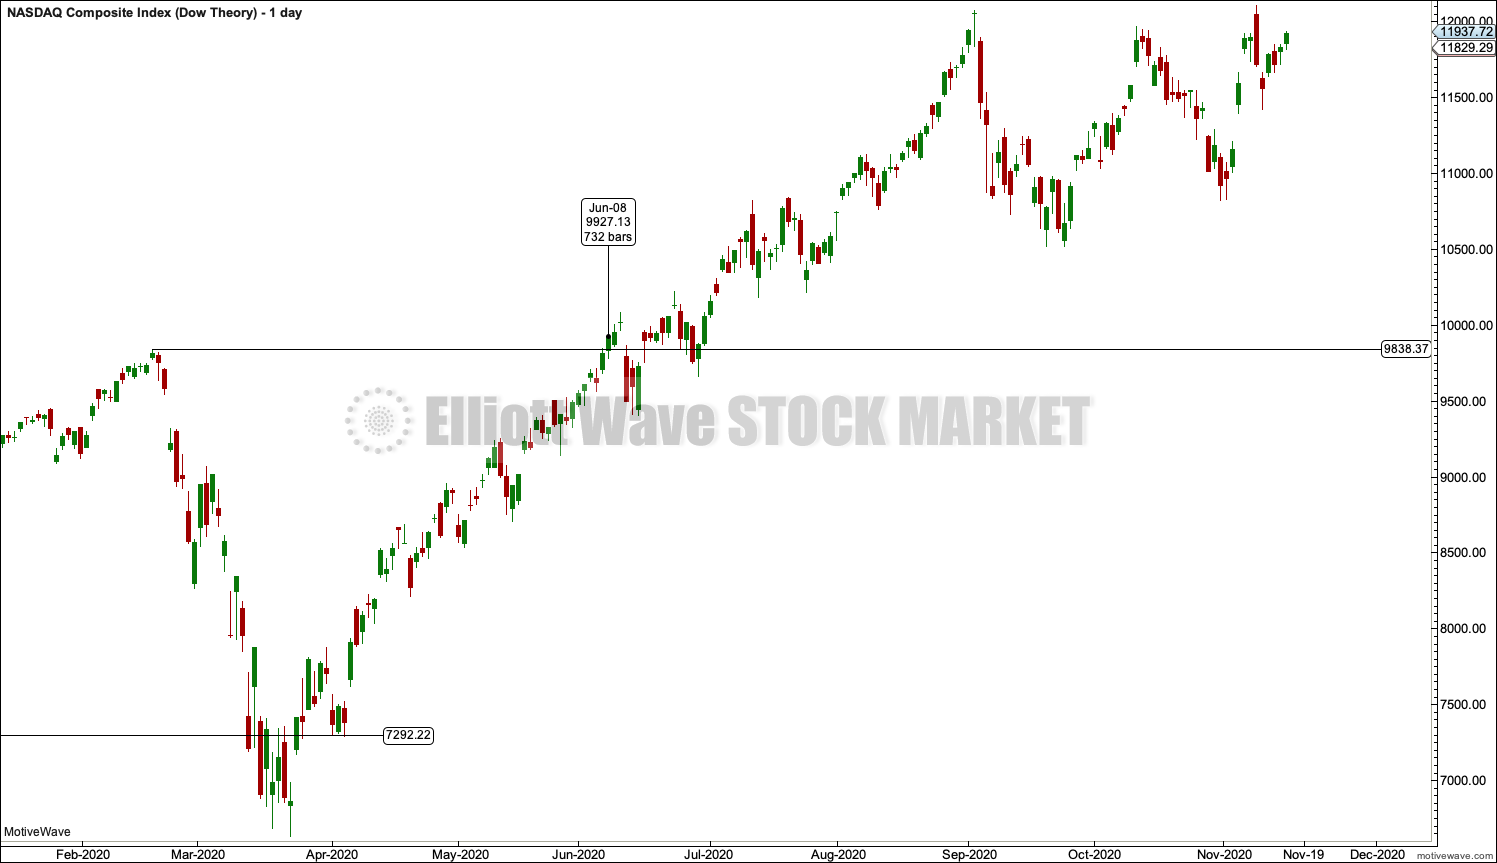
DAILY CHART – NASDAQ
Click chart to enlarge.
Nasdaq: 9,838.37 – closed above on June 8, 2020.
Published @ 05:55 p.m. ET.
—
Careful risk management protects your trading account(s).
Follow my two Golden Rules:
1. Always trade with stops.
2. Risk only 1-5% of equity on any one trade.
—
New updates to this analysis are in bold.