
S&P 500: Elliott Wave and Technical Analysis | Charts – September 3, 2020
Four Elliott wave counts are used that look at different degrees of correction. Invalidation of lower degrees indicates a higher degree correction.
Summary: The pullback would be expected to be over at today’s low for both the first and second wave counts. However, there is more support from classic technical analysis today for the alternate hourly counts. A new low below 3,354.68 would invalidate the main hourly charts and provide confidence in the alternate hourly charts.
It seems reasonable here to expect a pullback or consolidation to continue at least a little further to relieve extreme conditions. It is also possible that a large trend change has just occurred.
A new low below 2,191.86 would be extremely bearish.
The biggest picture, Grand Super Cycle analysis, is here.
Monthly charts are here, with video here.
ELLIOTT WAVE COUNTS
FIRST WAVE COUNT
WEEKLY CHART
Click chart to enlarge.
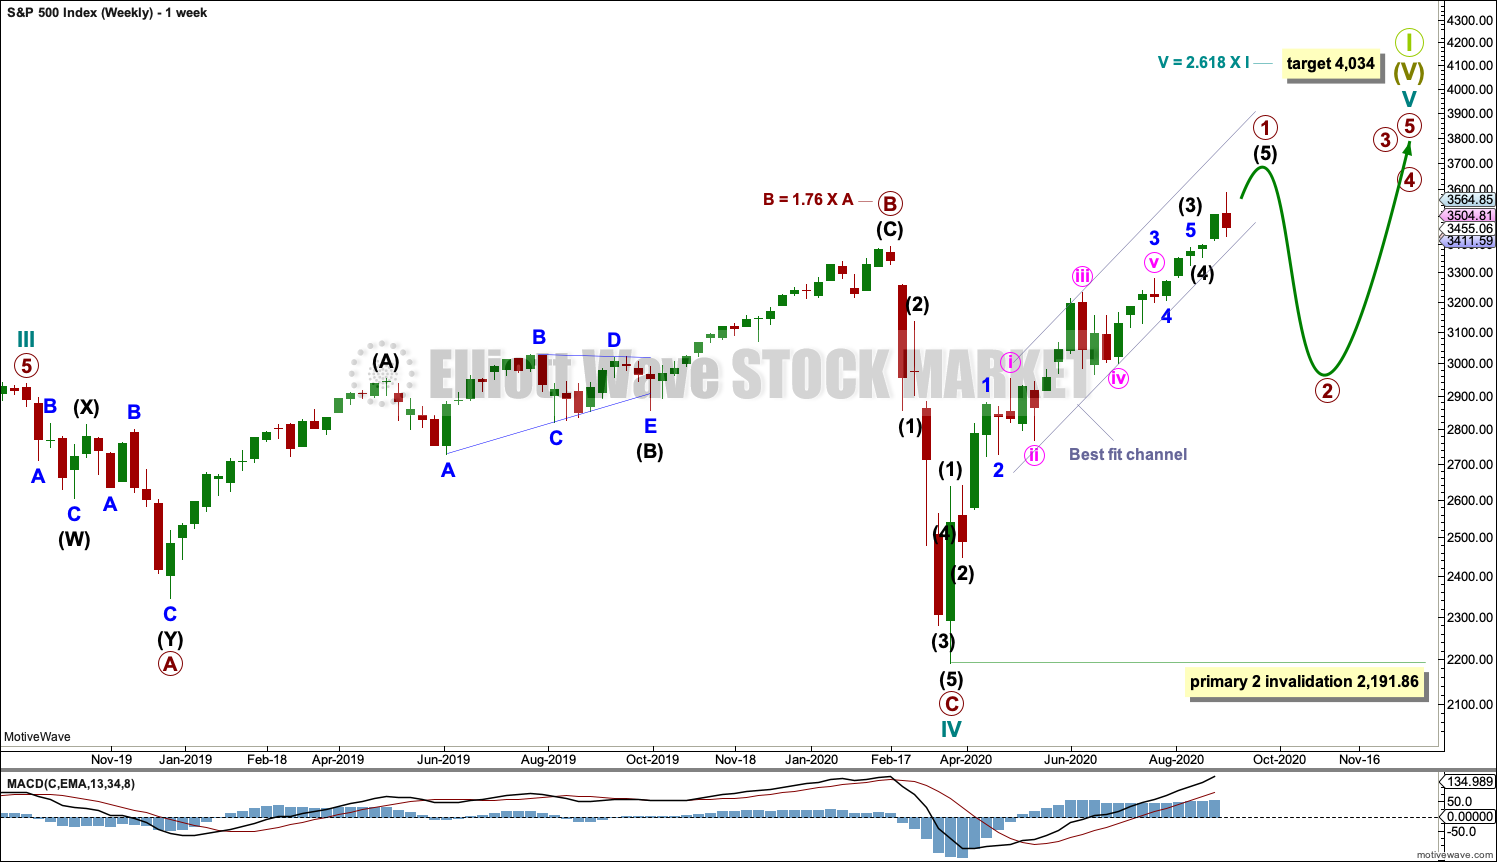
Cycle wave V may last from one to several years. So far it has lasted 5 months.
Cycle wave V would most likely subdivide as an impulse. But if overlapping develops, then an ending diagonal should be considered. This chart considers the more common impulse.
Primary wave 1 may be incomplete. Primary wave 2 may not move beyond the start of primary wave 1 below 2,191.86.
There is already a Fibonacci ratio between cycle waves I and III within Super Cycle wave (V). The S&P500 often exhibits a Fibonacci ratio between two of its actionary waves but rarely between all three; it is less likely that cycle wave V would exhibit a Fibonacci ratio. The target for Super Cycle wave (V) to end would best be calculated at primary degree, but that cannot be done until all of primary waves 1, 2, 3 and 4 are complete. The target at 4,034 is provisional, so it may change.
DAILY CHART
Click chart to enlarge.
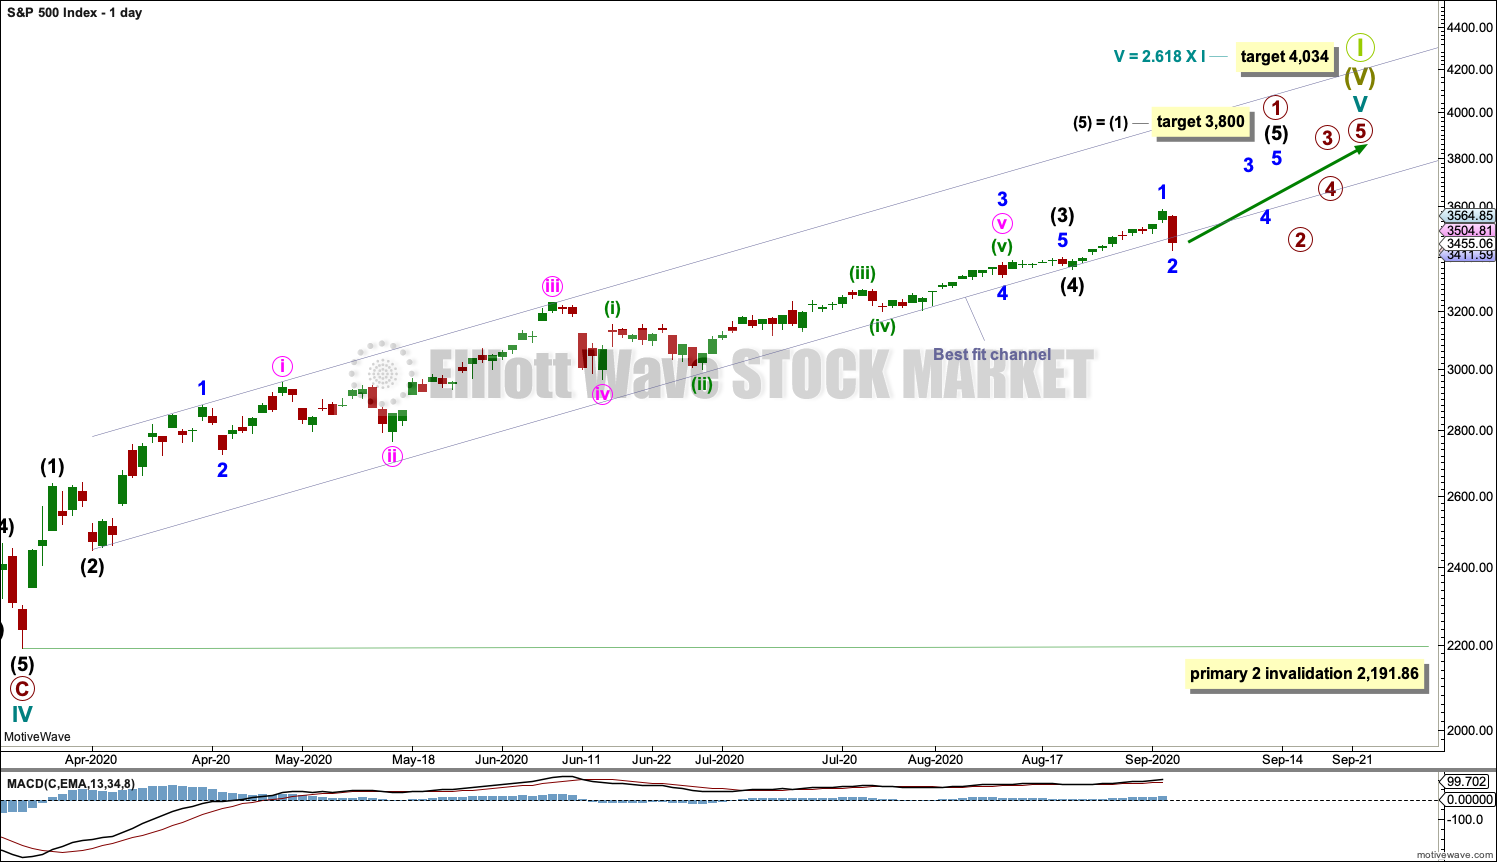
A target is calculated for intermediate wave (5) to complete primary wave 1, based upon the most common Fibonacci ratio to intermediate wave (1).
The best fit channel contains all of primary wave 1.
When this best fit channel is breached by a full daily candlestick below and not touching the lower edge, then that may be taken as an indication that primary wave 1 may be over and primary wave 2 may have begun. For the short term, a new low below 3,354.69 would indicate an end to primary wave 1. At that stage, primary wave 2 may be underway.
Primary wave 2 may be a multi-week pullback or consolidation. Primary wave 2 may not move beyond the start of primary wave 1 below 2,191.86.
Labels are added to intermediate wave (5) on the daily chart, which follows the first hourly chart below.
HOURLY CHART
Click chart to enlarge.
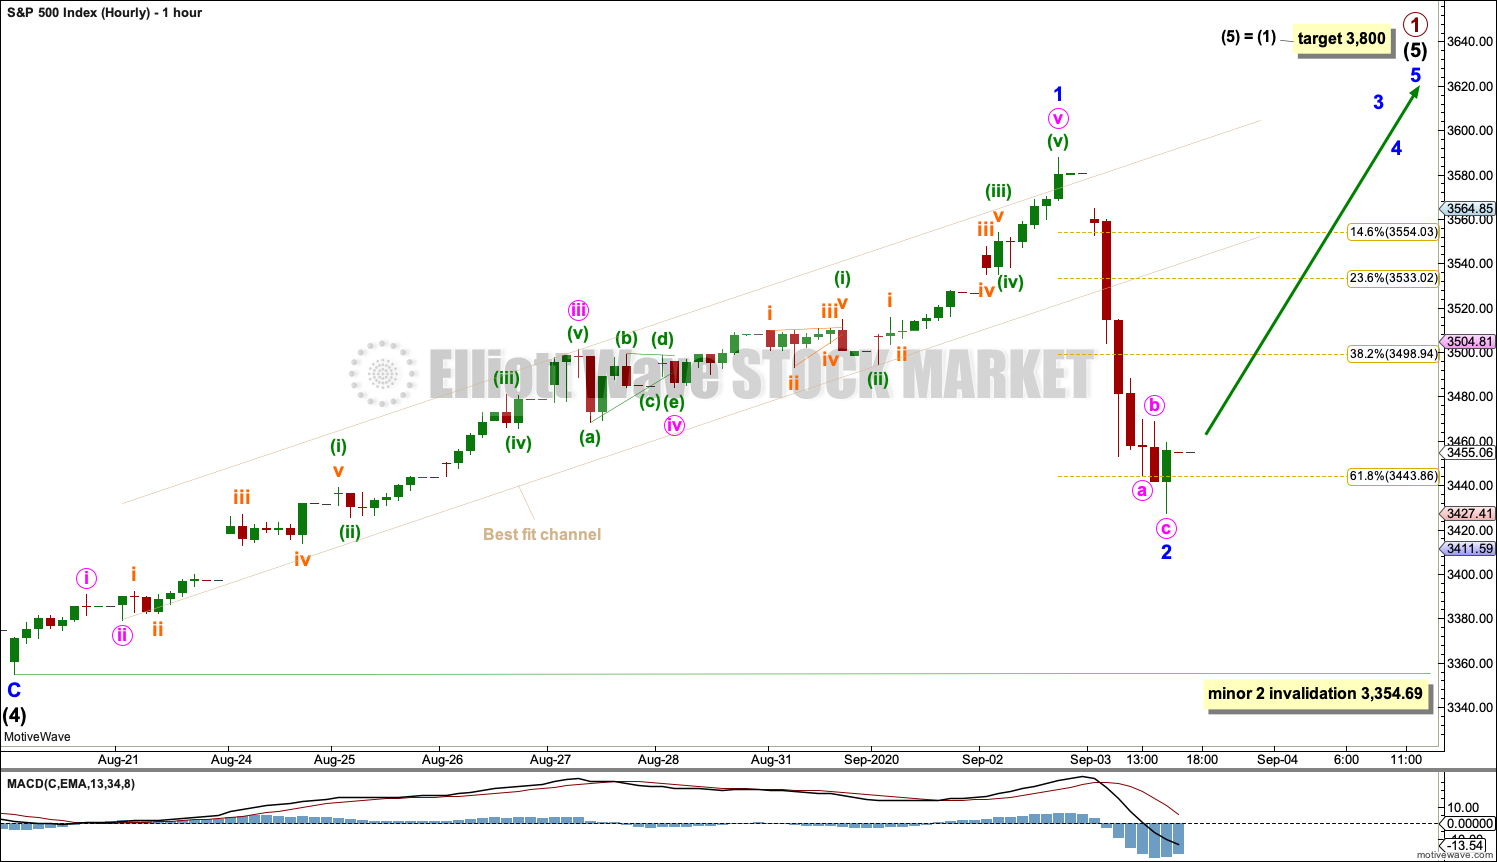
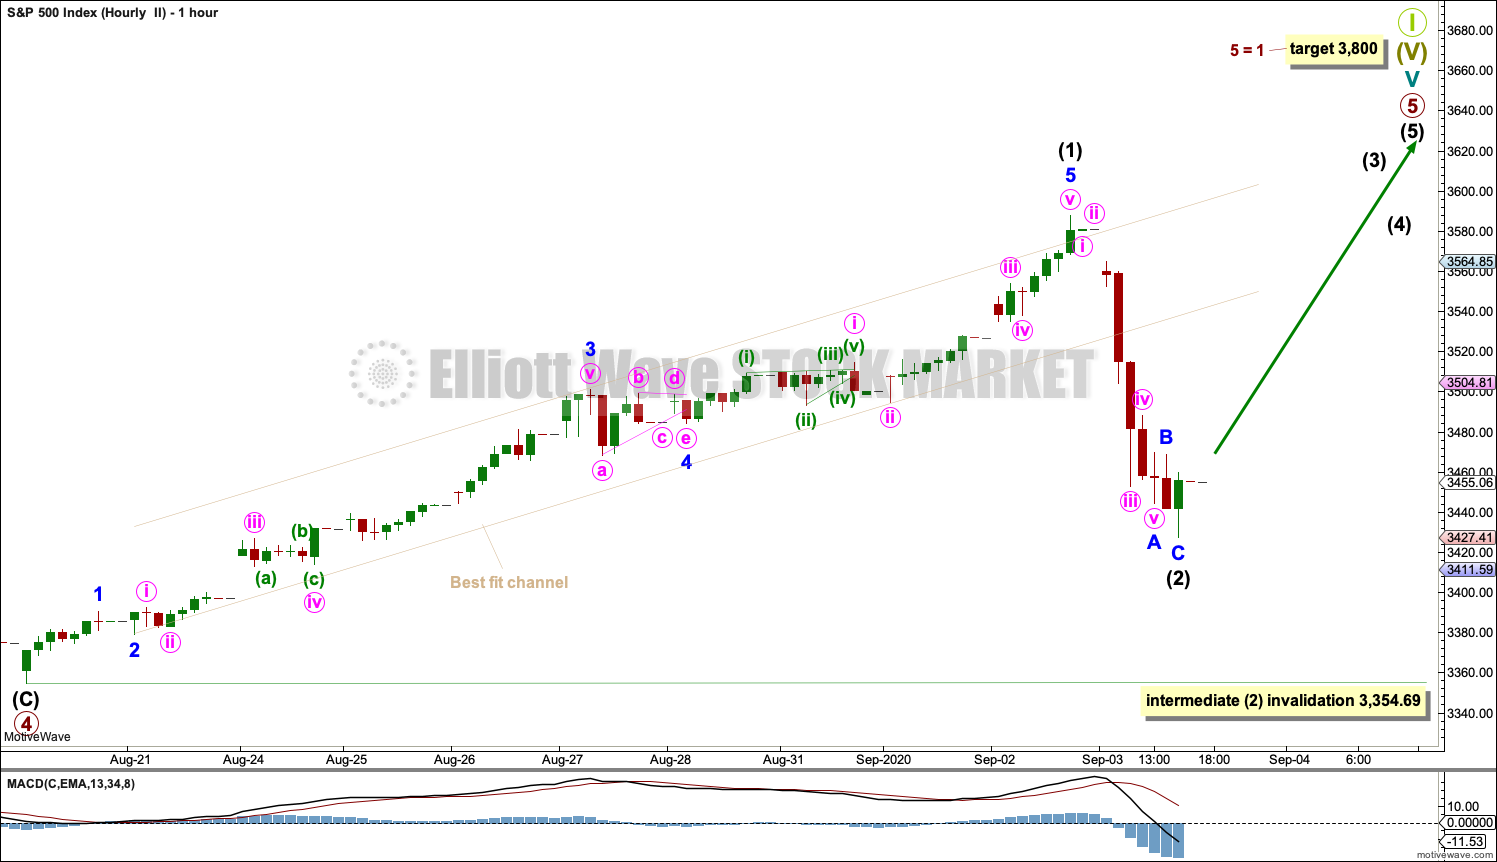
Intermediate wave (5) must subdivide as a five wave motive structure, most likely an impulse. Minor wave 1 within intermediate wave (5) may be complete. Within the impulse of minor wave 1: minute wave i was not extended, minute wave iii was extended, and minute wave v is also extended.
Minor wave 2 may be a brief pullback within the ongoing upwards trend. The first second wave correction within a new trend for the S&P500 is not always very deep. It would most likely be over at today’s low.
Minor wave 2 may not move beyond the start of minor wave 1 below 3,354.69.
ALTERNATE HOURLY CHART
Click chart to enlarge.
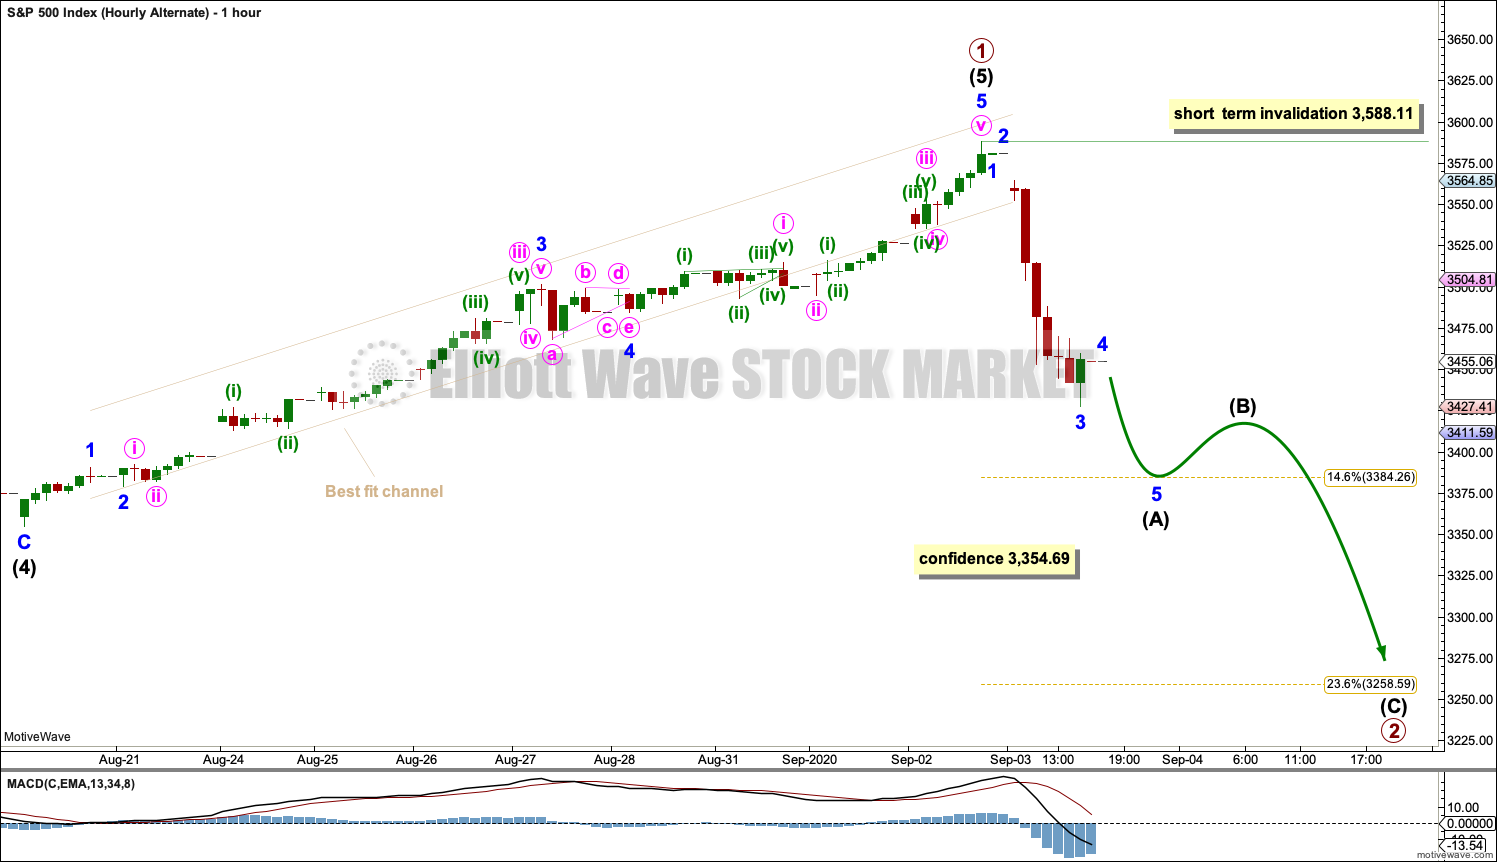
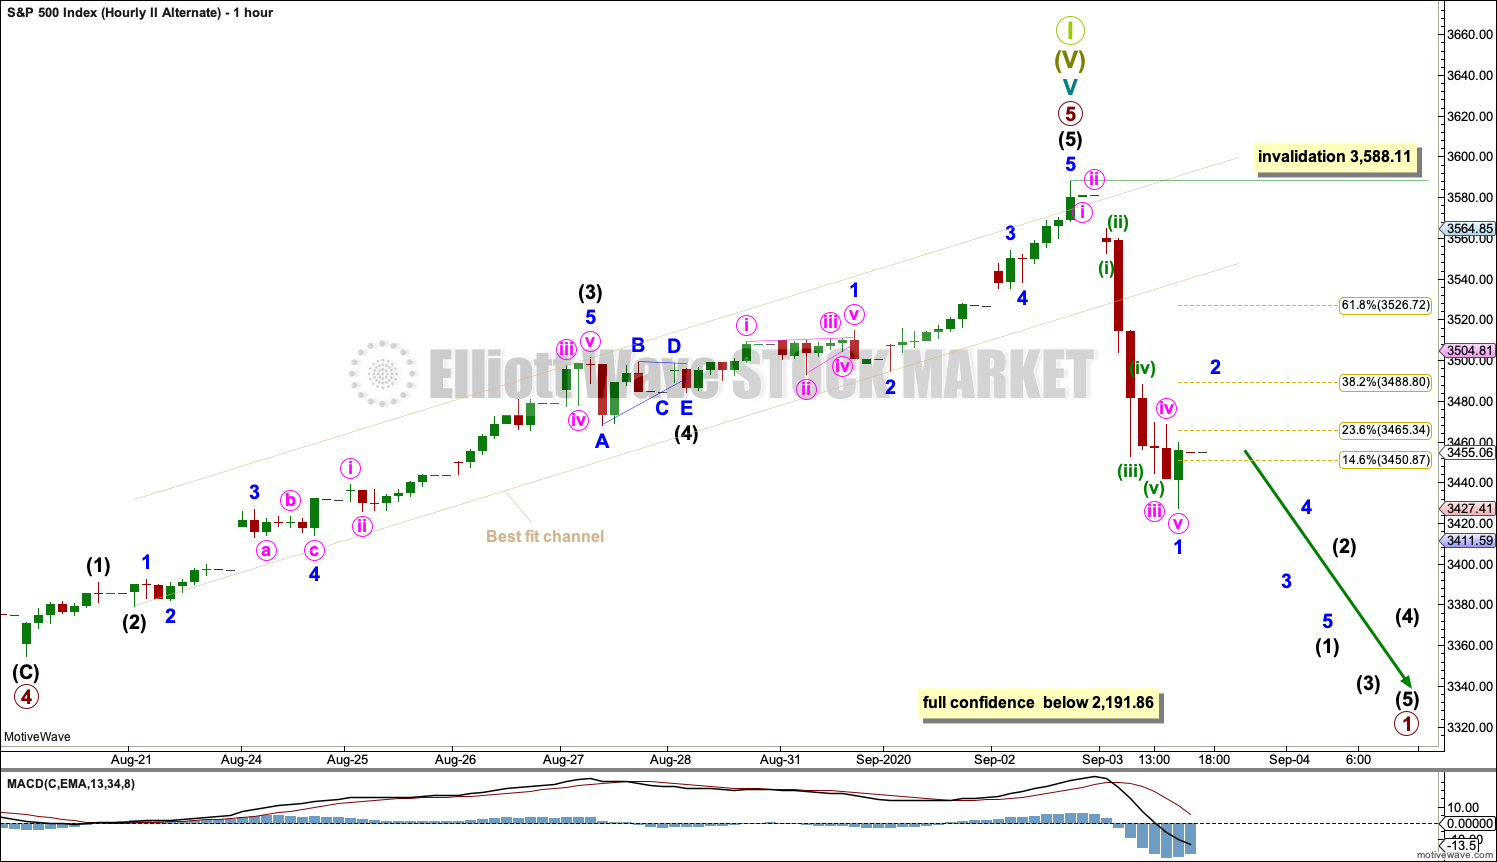
By simply moving the degree of labelling within intermediate wave (5) up one degree, it is possible that primary wave 1 may be complete.
Primary wave 2 should last at least a few days to a couple of weeks or so. It would most likely subdivide as a zigzag. If downwards movement for today is correctly analysed as a five, then the following bounce may not move beyond its start above 3,588.11.
Primary wave 2 may not move beyond the start of primary wave 1 below 2,181.86.
SECOND WAVE COUNT
DAILY CHART

Click chart to enlarge.
This wave count is the same as the first wave count with the exception of the degree of labelling within cycle wave V. If the degree of labelling is moved up one degree, then it is possible that cycle wave V to end Super cycle wave (V) to end Grand Super Cycle wave I is very close to completion, or possibly complete at yesterday’s high (alternate hourly wave count).
Primary waves 1 through to 4 within cycle wave V may be complete. Primary wave 5 may be almost complete.
A new low below 3,354.68 would indicate at least a short-term trend change.
A new low below 2,191.86 would add full confidence in this wave count. At that stage, the first wave count would be invalidated.
HOURLY CHART
Click chart to enlarge.
At the hourly chart level, this wave count is essentially the same as the first wave count with the first exception being the degree of labelling. Here, the degree of labelling is one degree higher.
Intermediate wave (2) may not move beyond the start of intermediate wave (1) below 3,354.69. Intermediate wave (2) may be complete at today’s low.
ALTERNATE HOURLY CHART
Click chart to enlarge.
If the degree of labelling within primary wave 5 is moved up one degree, then it is possible that a Grand Super Cycle degree trend change may have occurred yesterday.
TECHNICAL ANALYSIS
WEEKLY CHART
Click chart to enlarge. Chart courtesy of StockCharts.com.
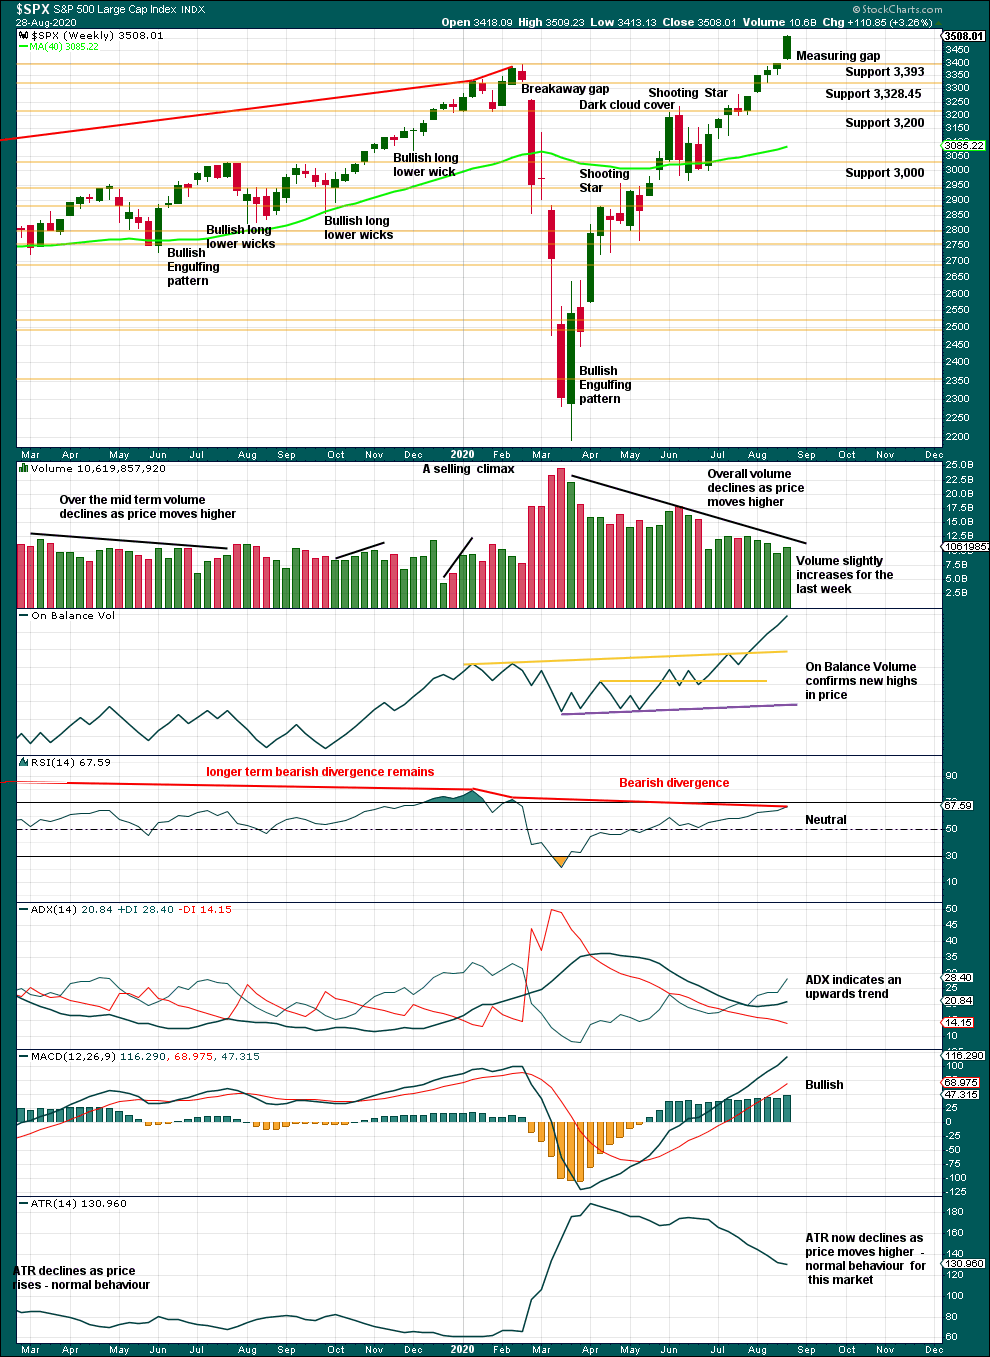
The measuring gap gives a target calculation at 3,813.35.
ADX is not extreme. RSI is not overbought. There is room for this upwards trend to continue.
However, there remains weakness in longer-term bearish divergence between price and RSI.
DAILY CHART
Click chart to enlarge. Chart courtesy of StockCharts.com.
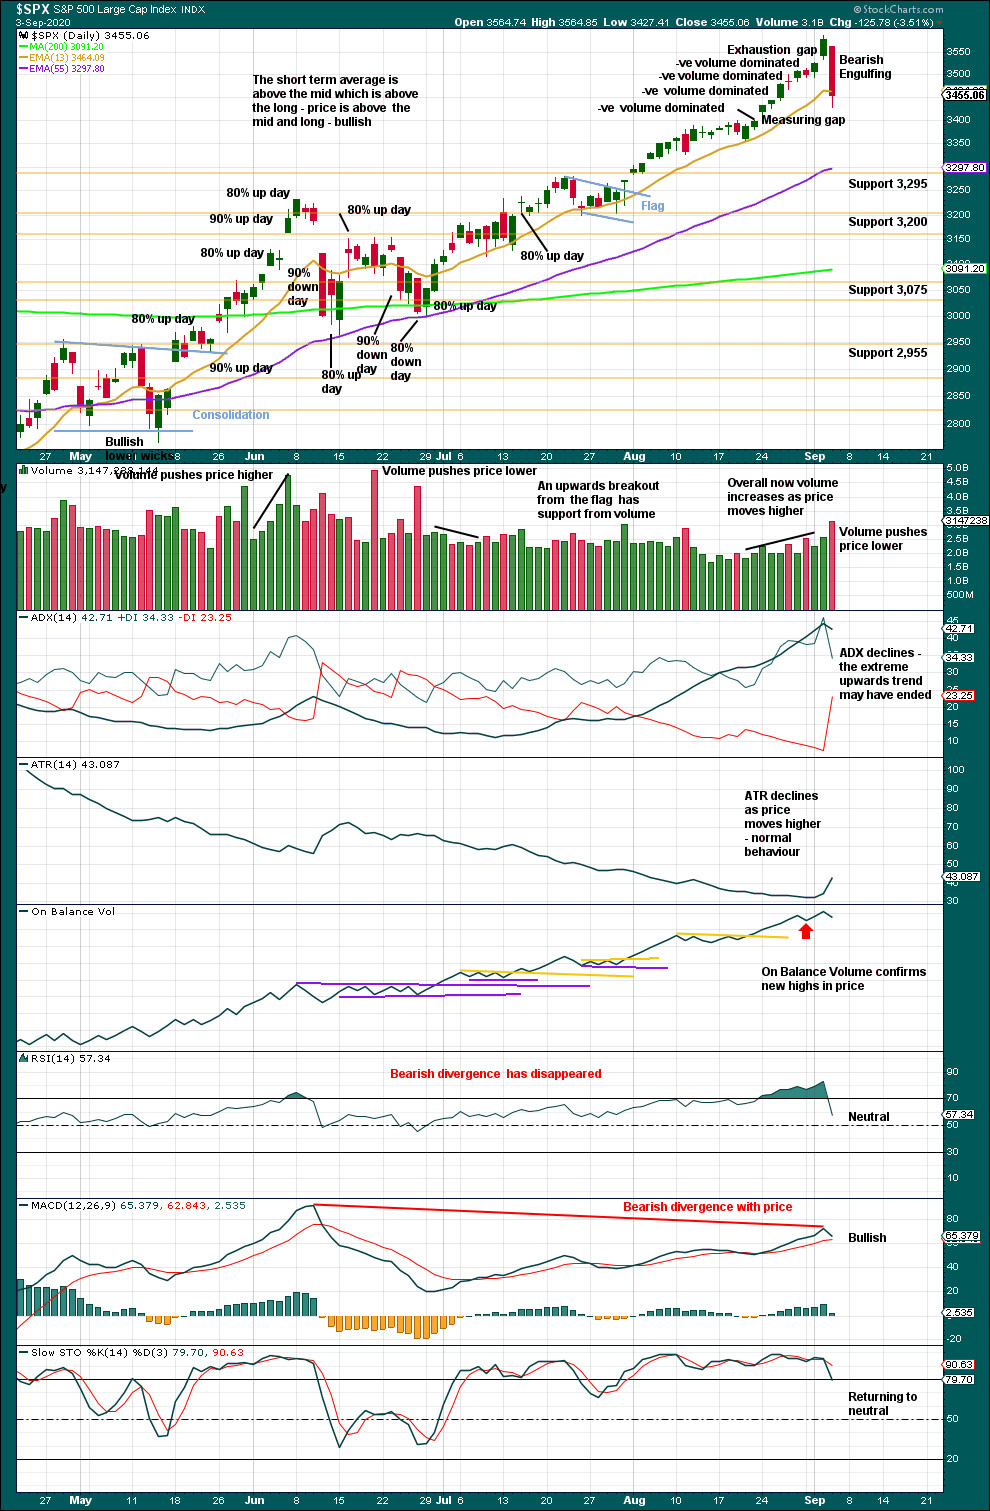
Down volume dominated for four sessions within the last nine sessions in a row of upwards movement.
RSI and ADX both reached extreme.
In extreme conditions a bearish candlestick pattern should be given weight; a trend change should be expected to be either downwards or sideways. Bearish candlestick patterns make no comment on the direction of the next trend (either a consolidation to relieve extreme conditions or a full 180° reversal) nor on how long the new trend may last. In current conditions the next trend may be reasonably expected to last long enough to bring price closer to the mean.
The bearish candlestick pattern today has support from volume. However, three prior Bearish Engulfing patterns can be seen on this chart on 12th of May, 11th June and 11th of August. None were followed by any substantial downwards movement; all were short-term corrections within an ongoing upwards trend.
A new low below 3,354.69 at least should be seen for confidence in a trend change.
BREADTH – AD LINE
WEEKLY CHART
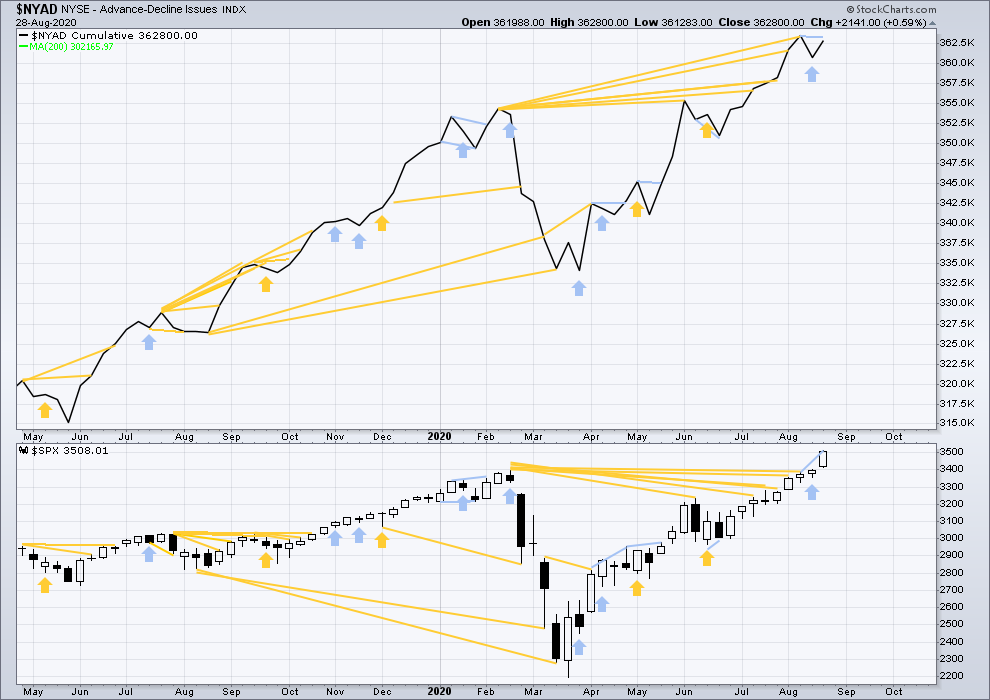
Click chart to enlarge. Chart courtesy of StockCharts.com. So that colour blind members are included, bearish signals will be noted with blue and bullish signals with yellow.
Breadth should be read as a leading indicator.
Lowry’s Operating Companies Only AD line has still not made new all time highs. The last high for the OCO AD line was in the week beginning January 13, 2020. There is now 7 and a half months of bearish divergence between price and the OCO AD line. This may now support the more bearish second wave count. It is possible now that a major trend change may occur.
The NYSE All Issues AD line made new highs in the week beginning 1st of June.
Last week both price and the AD line have moved higher, but while price has made a new high the AD line has not. This divergence is bearish for the short term.
Large caps all time high: 3,588.11 on September 2, 2020.
Mid caps all time high: 2,109.43 on February 20, 2020.
Small caps all time high: 1,100.58 on August 27, 2018.
Again, last week only large caps made new all time highs. This rise is led by large caps, which is a feature of an aged bull market. Only large caps have made new highs above the last swing high of the 11th of August.
DAILY CHART
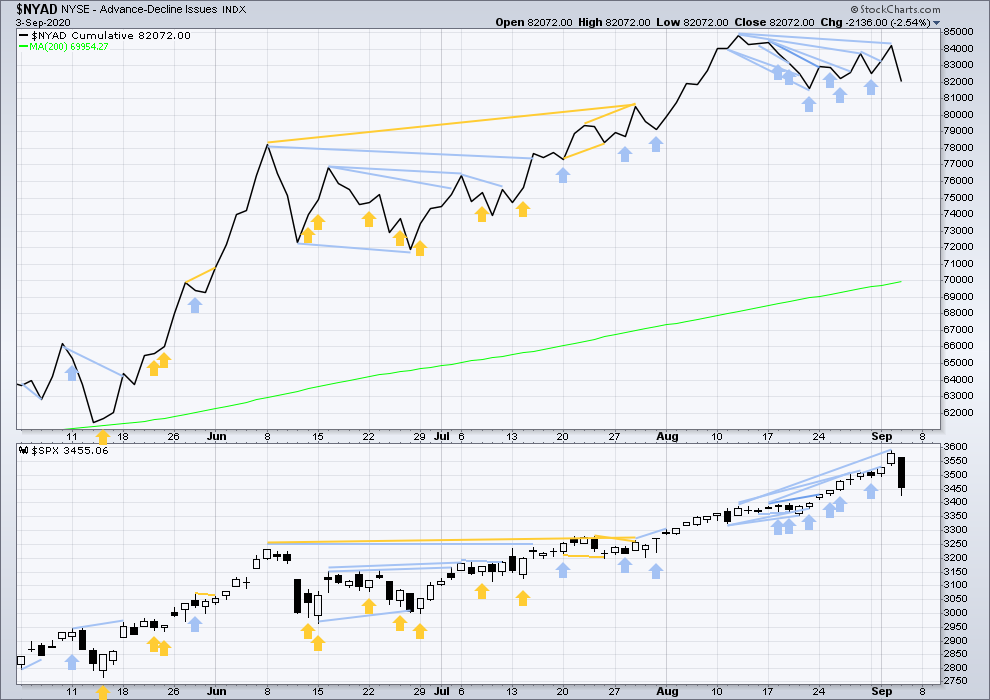
Click chart to enlarge. Chart courtesy of StockCharts.com. So that colour blind members are included, bearish signals will be noted with blue and bullish signals with yellow.
Both price and the AD line have moved lower today. There is no new divergence.
There is now a fairly strong cluster of bearish signals now from the AD line. This supports either of the alternate hourly charts.
VOLATILITY – INVERTED VIX CHART
WEEKLY CHART
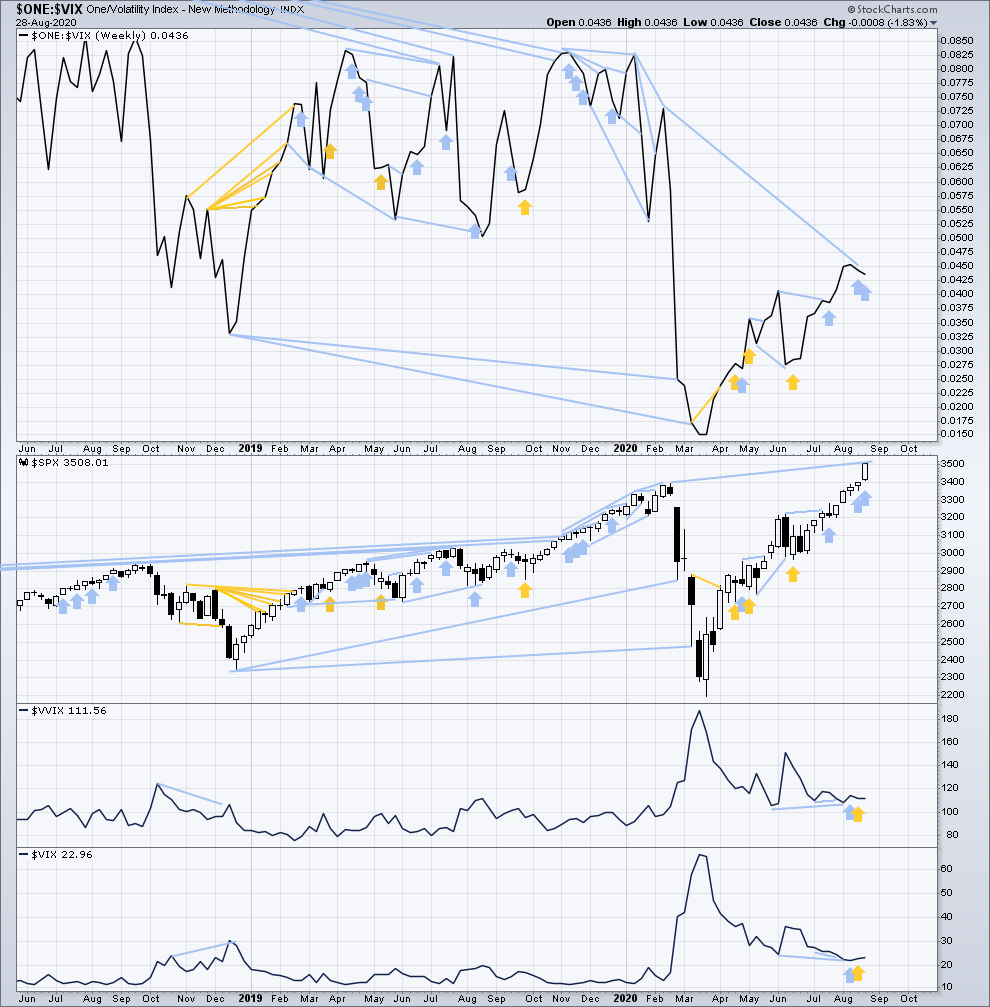
Click chart to enlarge. Chart courtesy of StockCharts.com. So that colour blind members are included, bearish signals will be noted with blue and bullish signals with yellow.
Inverted VIX remains well below all time highs. The all time high for inverted VIX was in the week beginning October 30, 2017. There is nearly 3 years of bearish divergence between price and inverted VIX. There is all of long, mid and short-term bearish divergence.
Price has moved higher for the last two weeks, but inverted VIX has moved lower. This divergence is bearish.
Comparing VIX and VVIX: From weeks beginning 1st June to two weeks ago, VIX has made new lows as price has made new highs, but VVIX has failed to make corresponding new lows with VIX. VVIX remains slightly elevated. This divergence is not strong, but it is bearish for price.
DAILY CHART
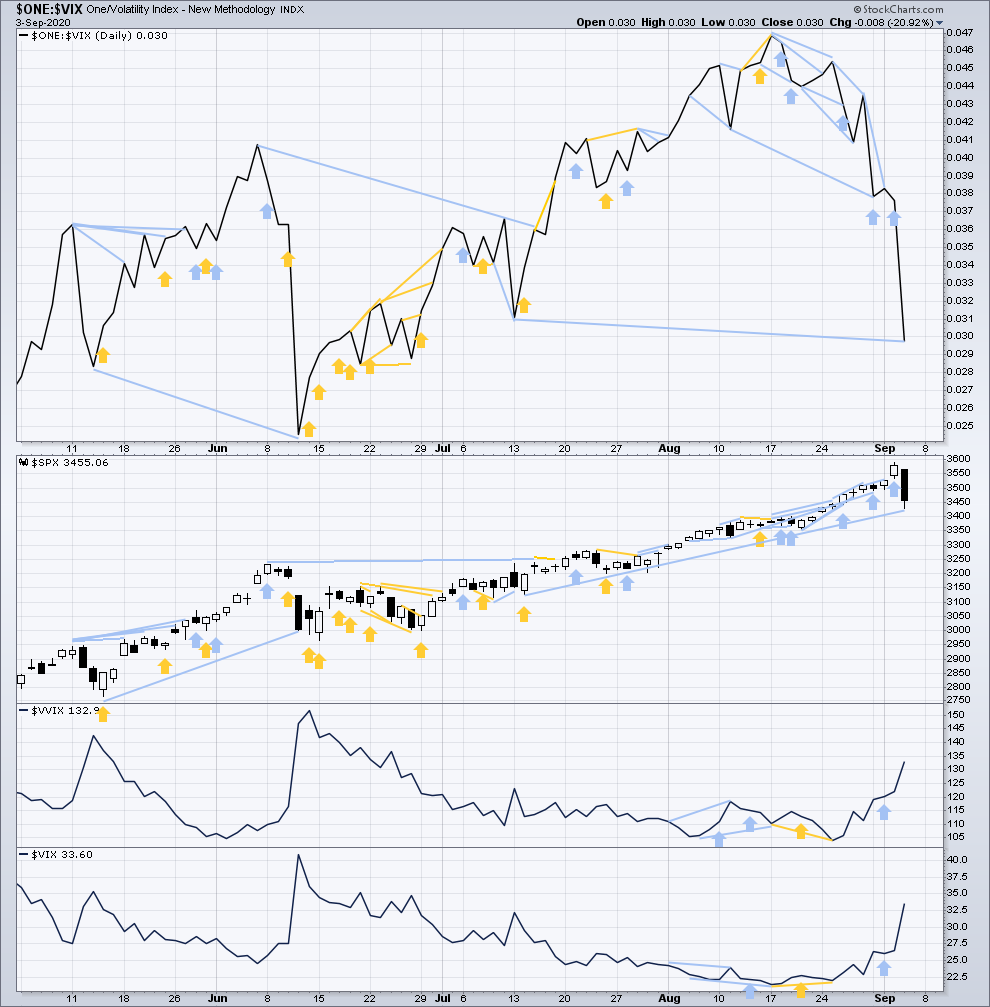
Click chart to enlarge. Chart courtesy of StockCharts.com. So that colour blind members are included, bearish signals will be noted with blue and bullish signals with yellow.
Both price and inverted VIX have moved lower today. Inverted VIX has made a new low below the low of the 13th / 14th of July, but price has not. This divergence is bearish for the mid term and supports either alternate hourly wave counts.
Comparing VIX and VVIX at the daily chart level: Both have moved higher today. There is no new divergence.
DOW THEORY
Dow Theory still concludes a bear market is in place.
Dow Theory confirmed a bear market with the following lows made on a closing basis:
DJIA: 21,712.53 – a close below this point was been made on the March 12, 2020.
DJT: 8,636.79 – a close below this point was been made on March 9, 2020.
Adding in the S&P and Nasdaq for an extended Dow Theory, a bear market was confirmed:
S&P500: 2,346.58 – a close below this point was made on March 20, 2020.
Nasdaq: 7,292.22 – a close below this point was made on the March 12, 2020.
At this time, to shift Dow Theory from viewing a bear market to confirmation of a new bull market would require new highs made on a closing basis:
DJIA: 29,568.57
DJT: 11,623.58
Adding in the S&P and Nasdaq for an extended Dow Theory, confirmation of a bull market would require new highs made on a closing basis:
S&P500: 3,393.52 – closed above on 21st August 2020.
Nasdaq: 9,838.37 – closed above on June 8, 2020.
Published @ 07:10 p.m. ET.
—
Careful risk management protects your trading account(s).
Follow my two Golden Rules:
1. Always trade with stops.
2. Risk only 1-5% of equity on any one trade.
—
New updates to this analysis are in bold.