by Lara | Aug 3, 2021 | S&P 500, S&P 500 + DJIA
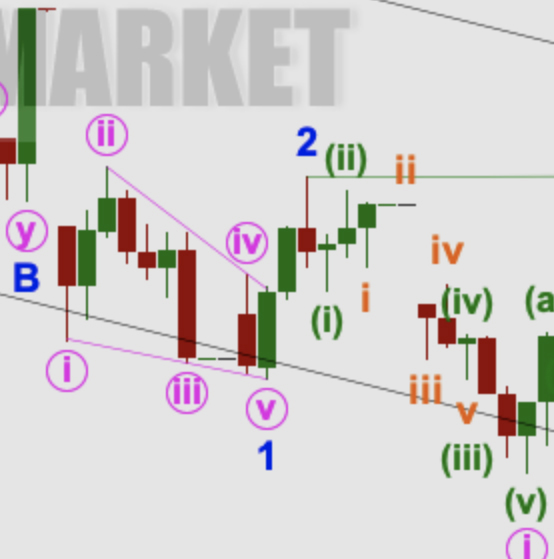
S&P 500: Elliott Wave and Technical Analysis | Charts – August 3, 2021 Upwards movement remains below the prior all time high. A new short-term outlook is provided for the main Elliott wave count today. Summary: There is a reasonably strong cluster of bearish...
by Lara | Jul 9, 2021 | S&P 500, S&P 500 + DJIA
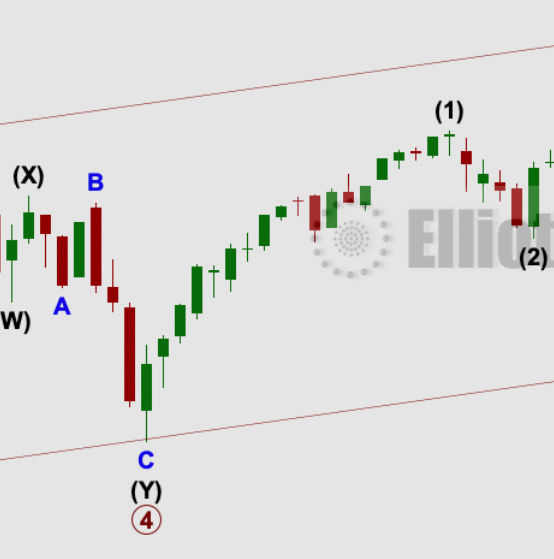
S&P 500: Elliott Wave and Technical Analysis | Charts – July 9, 2021 The week closes with a new all time high. Signals today from the AD line and inverted VIX are in agreement on which direction price may take next week. Summary: The primary trend remains up....
by Lara | Jun 15, 2021 | S&P 500, S&P 500 + DJIA
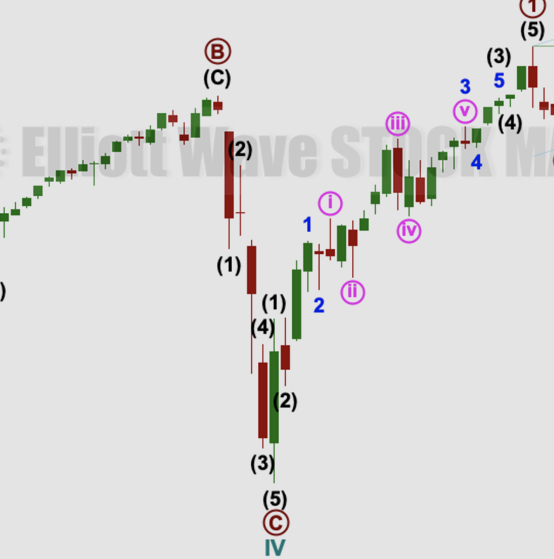
S&P 500: Elliott Wave and Technical Analysis | Charts – June 15, 2021 Another new all time high continues the bullish trend, which is what this Elliott wave count has long been expecting, with support from classic technical analysis. Summary: The trend is up. The...
by Lara | May 24, 2021 | S&P 500, S&P 500 + DJIA
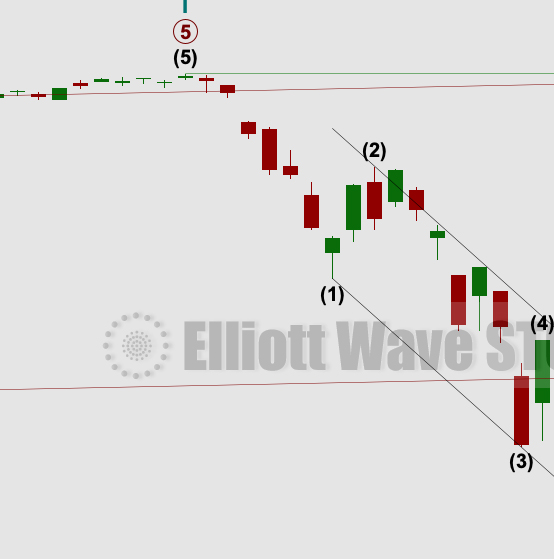
S&P 500: Elliott Wave and Technical Analysis | Charts – May 24, 2021 The main Elliott wave count expected upwards movement, which is how the week has begun. Summary: The trend is up. The next target for the next wave up is at 4,900. An alternate Elliott wave...
by Lara | Apr 27, 2021 | S&P 500, S&P 500 + DJIA
S&P 500: Elliott Wave and Technical Analysis | Charts – April 27, 2021 Another very small range day closes as a small red doji. Both short-term Elliott wave counts remain essentially the same. Summary: The wave count expects a third wave at three large degrees...
by Lara | Mar 18, 2021 | S&P 500, S&P 500 + DJIA
S&P 500: Elliott Wave and Technical Analysis | Charts – March 18, 2021 A strong downwards movement at the end of the session necessitates the degree of this pullback being labelled higher. The short and mid-term invalidation points remain intact. Summary: Both...
by Lara | Feb 23, 2021 | S&P 500, S&P 500 + DJIA
S&P 500: Elliott Wave and Technical Analysis | Charts – February 23, 2021 Another downwards day ends with a strong bounce to close green. The opening gap is closed and the daily candlestick has a long lower wick. This supports the main hourly wave count. Summary:...
by Lara | Jan 29, 2021 | S&P 500, S&P 500 + DJIA
S&P 500: Elliott Wave and Technical Analysis | Charts – January 29, 2021 Downwards movement on Friday may be a continuation of a fourth wave correction. Summary: Both main and alternate wave counts expect the low of the 30th of October to not be breached for many...
by Lara | Jan 5, 2021 | S&P 500, S&P 500 + DJIA
S&P 500: Elliott Wave and Technical Analysis | Charts – January 5, 2021 Four daily charts are presented today to consider various possibilities. They are ranked in order of probability. Summary: The wave count expects the low of the 30th of October to not be...
