by Lara | Jul 25, 2020 | Public Analysis, Russell 2000, Russell 2000 Historical
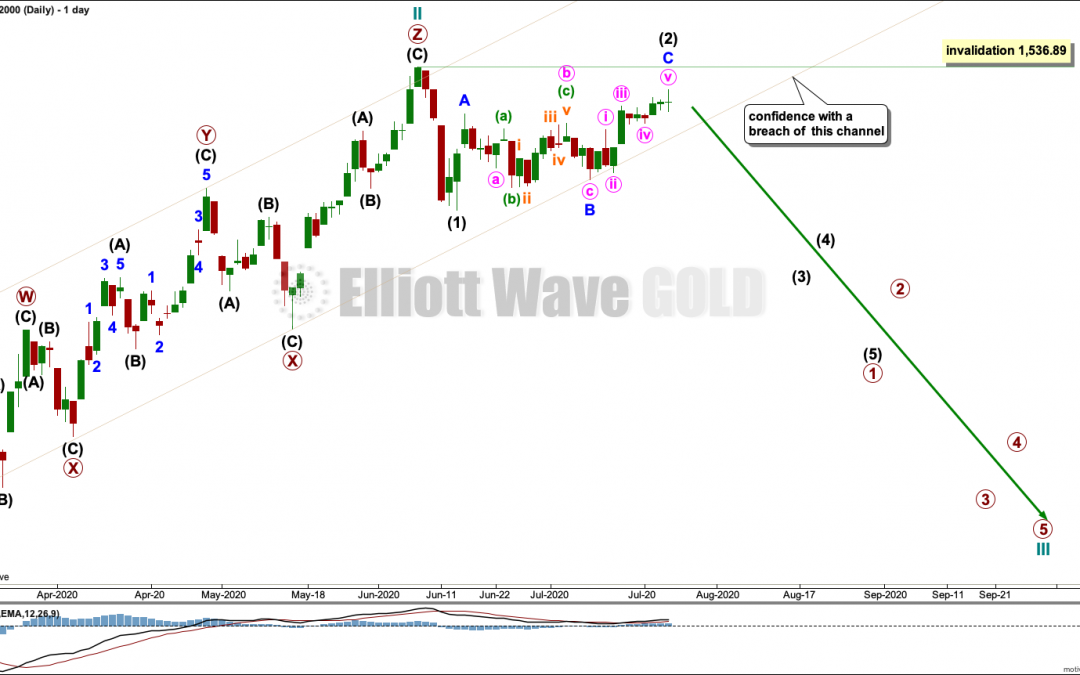
Russell 2000: Elliott Wave Analysis | Charts – July 24, 2020 The bounce may be over. Summary: A target for a third wave down is at 326. The channel on the daily chart must be breached for any confidence in this view. A new high above 1,715.08 would indicate a more...

by Lara | Apr 9, 2020 | Public Analysis, Russell 2000, Russell 2000 Historical
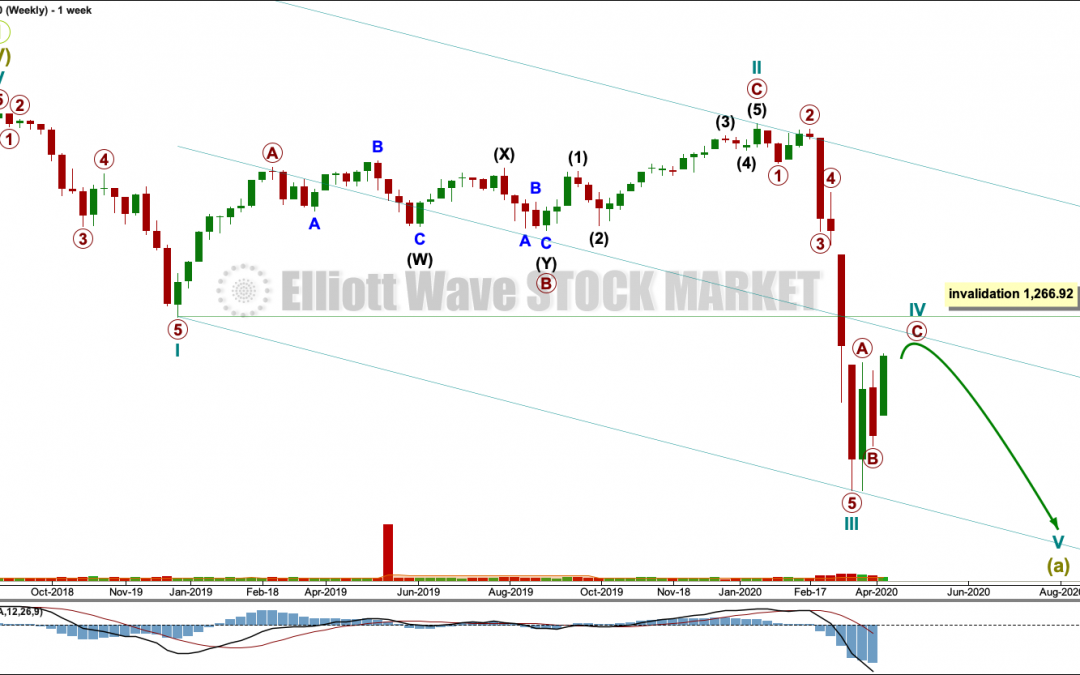
Russell 2000: Elliott Wave Analysis | Charts – April 9, 2020 Elliott wave analysis of Russell 2000. Summary: This bounce may end shortly. If price remains below 1,266.92, then this analysis would remain bearish. A new high above 1,266.92 by any amount at any time...
by Lara | Oct 1, 2014 | Russell 2000, Russell 2000 Historical
Click on charts to enlarge. Data available extends back only to the end of 1987. Data begins with the 1987 “crash” which I am labeling a cycle degree second wave correction. A five wave impulse for a super cycle wave (I) ended in March, 2000. Ratios of...
by Lara | Aug 14, 2014 | Public Analysis, Russell 2000, Russell 2000 Historical
By request from a member here is an Elliott wave analysis of Russell 2000 using data from Yahoo Finance. Click on charts to enlarge. Data available extends back only to the end of 1987. Data begins with the 1987 “crash” which I am labeling a cycle degree...


