
By request from a member here is an Elliott wave analysis of Russell 2000 using data from Yahoo Finance.
Click on charts to enlarge.
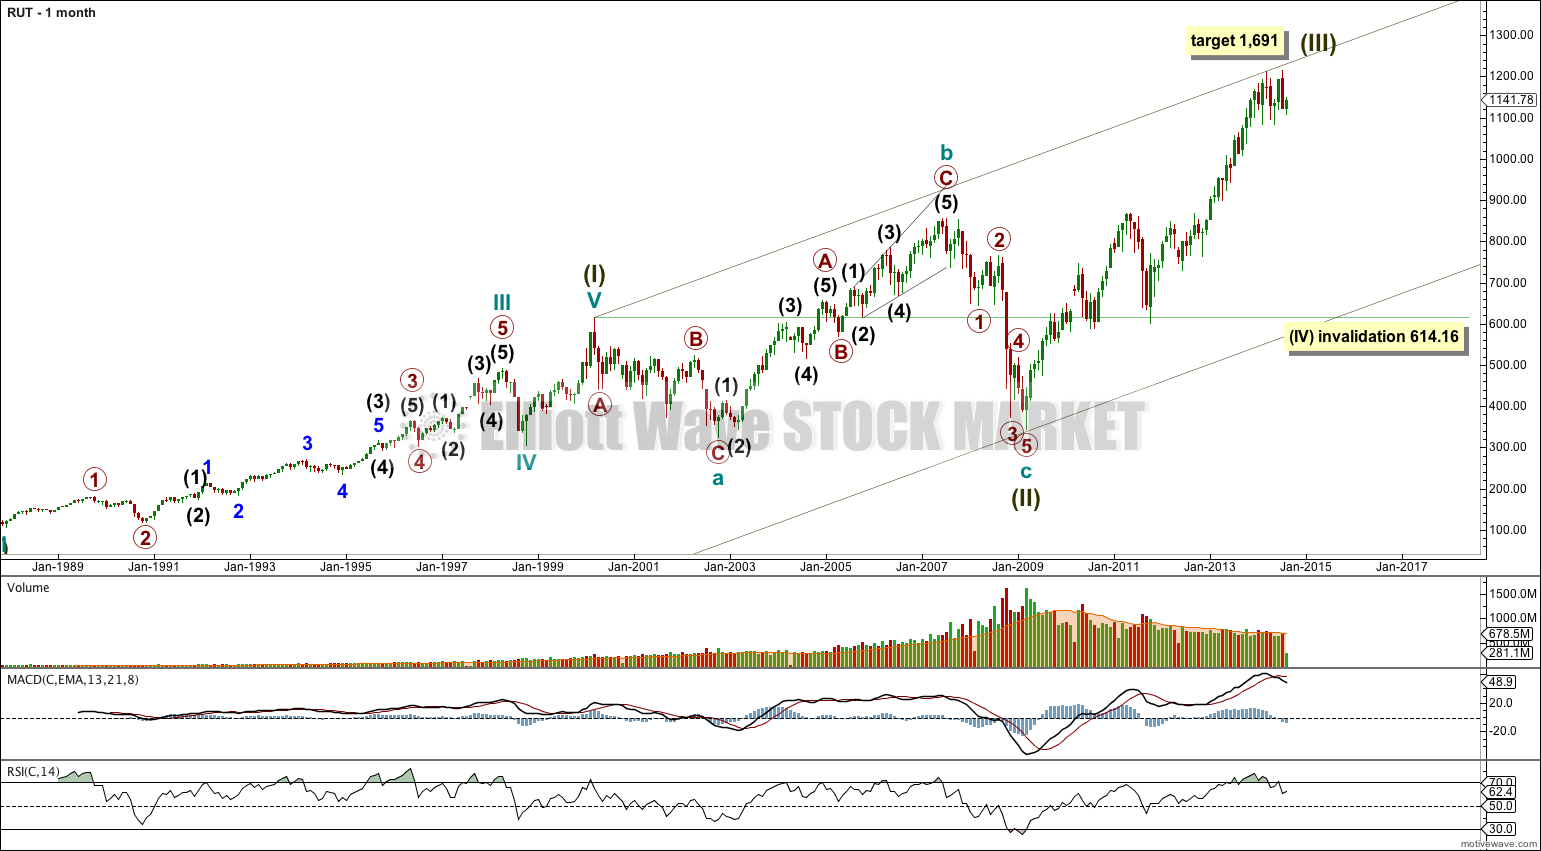
Data available extends back only to the end of 1987. Data begins with the 1987 “crash” which I am labeling a cycle degree second wave correction.
A five wave impulse for a super cycle wave (I) ended in March, 2000.
Ratios of cycle degree waves within super cycle wave (I) cannot be accurately calculated without all data from the start of Russell 2000 in 1984.
Ratios within cycle wave III of super cycle wave (I) are: primary wave 3 has no Fibonacci ratio to primary wave 1, and primary wave 5 is 8.39 points short of 1.618 the length of primary wave 1.
Ratios within primary wave 3 of cycle wave III are: intermediate wave (3) has no Fibonacci ratio to intermediate wave (1), and intermediate wave (5) is just 3.81 points longer than equality with intermediate wave (1).
Ratios within intermediate wave (3) of primary wave 3 are: minor wave 3 has no Fibonacci ratio to minor wave 1, and minor wave 5 is 7.15 short of equality with minor wave 3.
Ratios within primary wave 5 are: there is no Fibonacci ratio between intermediate waves (3) and (1), and intermediate wave (5) is 6.44 longer than 0.618 the length of intermediate wave (3).
Super cycle wave (II) is seen as a complete expanded flat correction, with a shorter than usual C wave (which is not truncated because it does move very slightly below the end of cycle wave a). Cycle wave c is 45.87 points longer than 1.618 the length of cycle wave a, a variation just less than 10% and so acceptable.
Within cycle wave a primary wave C is 8.82 longer than 2.618 the length of primary wave A, and I am seeing primary wave B as a double combination: zigzag – X – flat.
Within cycle wave b there is no adequate Fibonacci ratio between primary waves A and C. Primary wave A is an impulse, and primary wave C fits perfectly as an ending expanding diagonal. I am confident this upwards wave for cycle wave b is a clear three wave structure, and so it is part of a larger correction.
Within cycle wave c there are no Fibonacci ratios between primary waves 1, 3 and 5.
Overall super cycle wave (II) is a 50% correction of super cycle wave (I). Super cycle wave (I) lasted longer than 12 years (it begins when Russell 2000 began) and super cycle wave (II) lasted 9 years.
At 1,691 super cycle wave (III) would reach 1.618 the length of super cycle wave (I).
When super cycle wave (III) is finished then a subsequent correction for super cycle wave (IV) may not move into super cycle wave (I) price territory below 614.16.
The weekly chart focusses on more detail within super cycle wave (III).
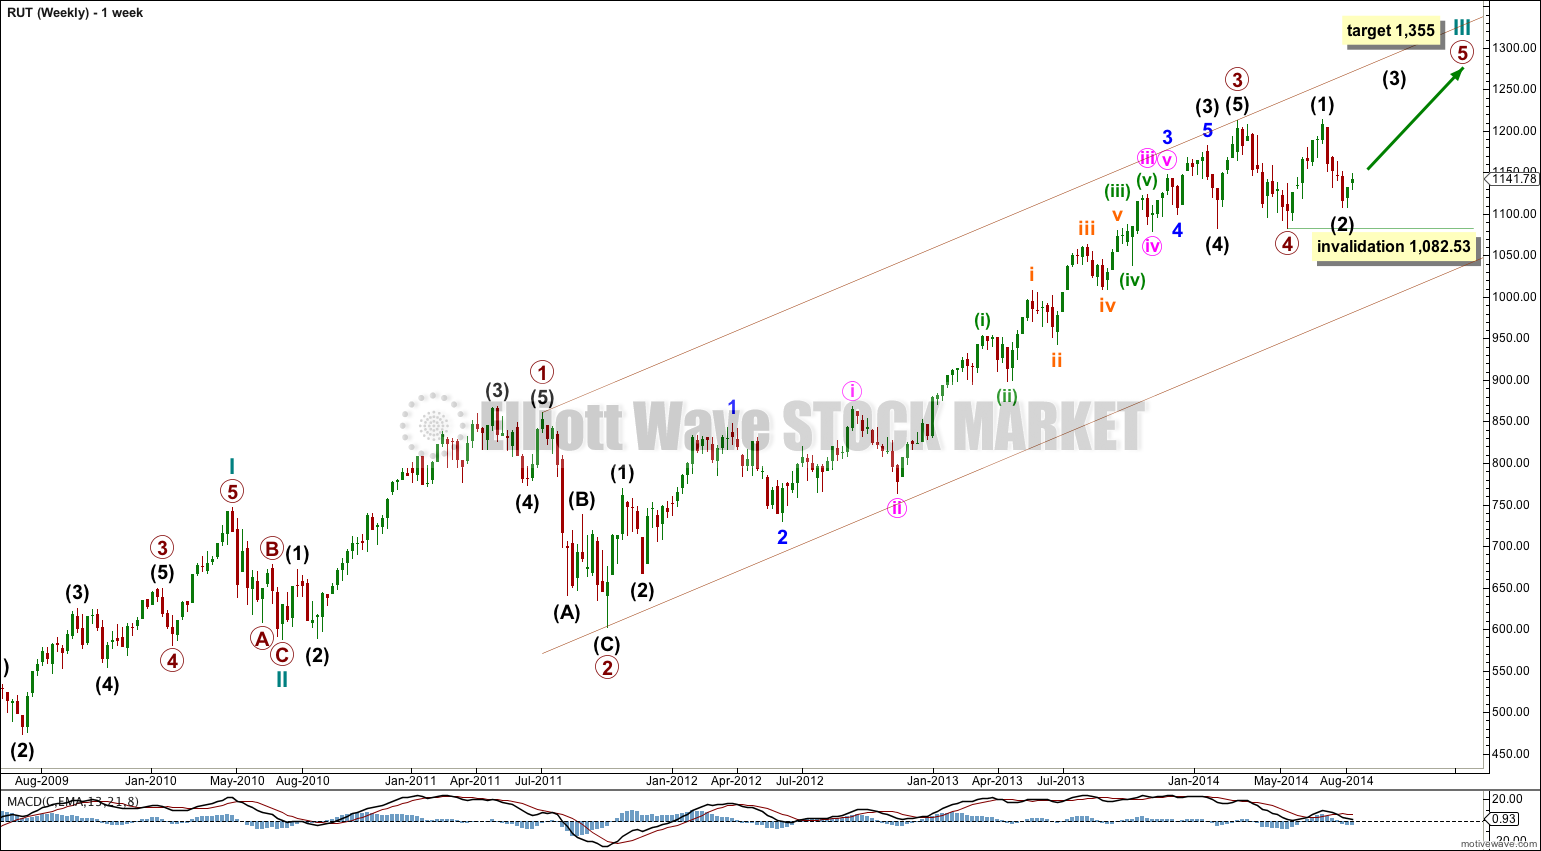
Super cycle wave (III) is incomplete. Within it cycle wave III is also incomplete. Cycle wave III may only subdivide as an impulse.
Ratios within cycle wave I are: primary wave 3 is 9.55 points longer than equality with primary wave 1, and primary wave 5 is just 3.77 points short of equality with primary wave 1.
Ratios within primary wave 3 are: there is no Fibonacci ratio between intermediate waves (3) and (1), and intermediate wave (5) is just 2.05 points longer than 0.618 the length of intermediate wave (3).
Within cycle wave III primary wave 3 has no adequate Fibonacci ratio to primary wave 1. It is likely that primary wave 5 will exhibit a Fibonacci ratio to either of primary waves 1 or 3. At 1,355 primary wave 5 would reach equality in length with primary wave 1.
Primary wave 1 lasted 52 weeks, primary wave 2 lasted 13 weeks, primary wave 3 lasted 126 weeks, and primary wave 4 lasted 10 weeks. None of these waves exhibit a Fibonacci duration nor do their durations exhibit Fibonacci ratios to each other. I would expect primary wave 5 to last about 52 weeks, and so the target at 1,355 may be met in about another 40 weeks.
Ratios within primary wave 3 are: intermediate wave (3) has no Fibonacci ratio to intermediate wave (1), and intermediate wave (5) is 8.35 points longer than 0.236 the length of intermediate wave (3).
Ratios within intermediate wave (3) are: minor wave 3 has no Fibonacci ratio to minor wave 1, and minor wave 5 has no Fibonacci ratio to either of minor waves 3 or 1.
Ratios within minor wave 3 are: minute wave iii is 3.54 points short of 2.618 the length of minute wave i, and minute wave v has no Fibonacci ratio to either of minute waves iii or i.
Ratios within minute wave iii are: minuette wave (iii) is 8.36 points short of equality in length with minuette wave (i), and minuette wave (v) has no Fibonacci ratio to either of minuette waves (i) or (iii).
Ratios within minuette wave (iii) are: subminuette wave iii is 10.9 points longer than equality with subminuette wave i, and subminuette wave v is just 3.12 points short of 0.618 the length of subminuette wave iii.
If intermediate wave (2) moves any lower it may not move below the start of intermediate wave (1) at 1,082.53.
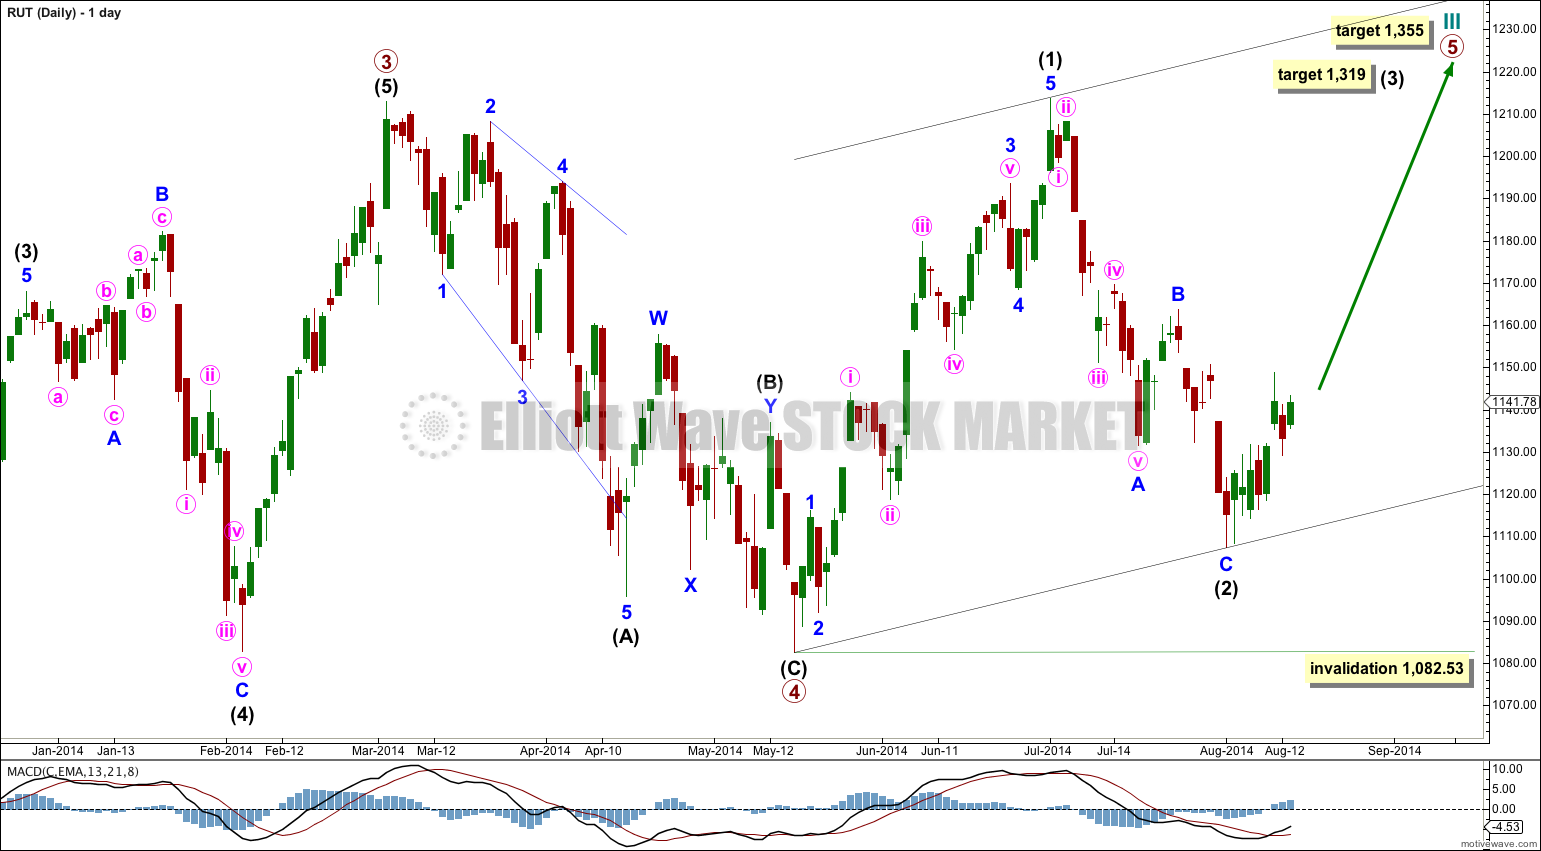
The daily chart focusses on the start of primary wave 5 within cycle wave III.
What is most clear about this chart is the structure of intermediate wave (1): a clear five wave impulse with an extended third wave. This indicates the trend is upwards at this stage despite a deep second wave correction which followed it.
Ratios within intermediate wave (1) are: there is no Fibonacci ratio between minor waves 3 and 1, and minor wave 5 has no Fibonacci ratio to either of minor waves 3 or 1.
Ratios within minor wave 3 are: minute wave iii has no Fibonacci ratio to minute wave i, and minute wave v is just 1.46 points longer than 0.618 the length of minute wave iii.
Within intermediate wave (2) minor wave C is 5.59 points short of 0.618 the length of minor wave A. Intermediate wave (2) is a typically very deep 81% zigzag structure. It is extremely likely it is over here. At 1,319 intermediate wave (3) would reach 1.618 the length of intermediate wave (1).
I have drawn a base channel about intermediate waves (1) and (2). On the way upwards to the target for intermediate wave (3) downwards corrections should find support at the lower edge of this channel. This channel should not be breached to the downside. Upwards movement should breach the upper edge of the channel.
From this first analysis of Russell 2000 I can say that it does not exhibit Fibonacci ratios between all three actionary waves of its impulses, but it often exhibits Fibonacci ratio between two of the three actionary waves within an impulse. Much like the S&P 500, but better than the Nasdaq. This means that target calculation would increase in accuracy only towards the end of a movement; it is only at the end of a movement that targets can be calculated at multiple wave degrees, and because of the tendency for not all actionary waves to exhibit Fibonacci ratios targets should be calculated at least at two or three wave degrees. The target at 1,319 would and should change once minor waves 3 and 4 within intermediate wave (3) are complete.
Russell 2000 does not seem to exhibit Fibonacci relationships in the number of days, weeks or months a wave takes. This makes estimation of when targets may be met rather difficult.
Russell 2000 does seem to exhibit reasonably normal looking Elliott wave structures, and some of these structures are exceedingly typical looking (like the impulse of intermediate wave (1) here on the daily chart). This means that predicted directions should be quite accurate, if the wave count is correct.