
Click on charts to enlarge.
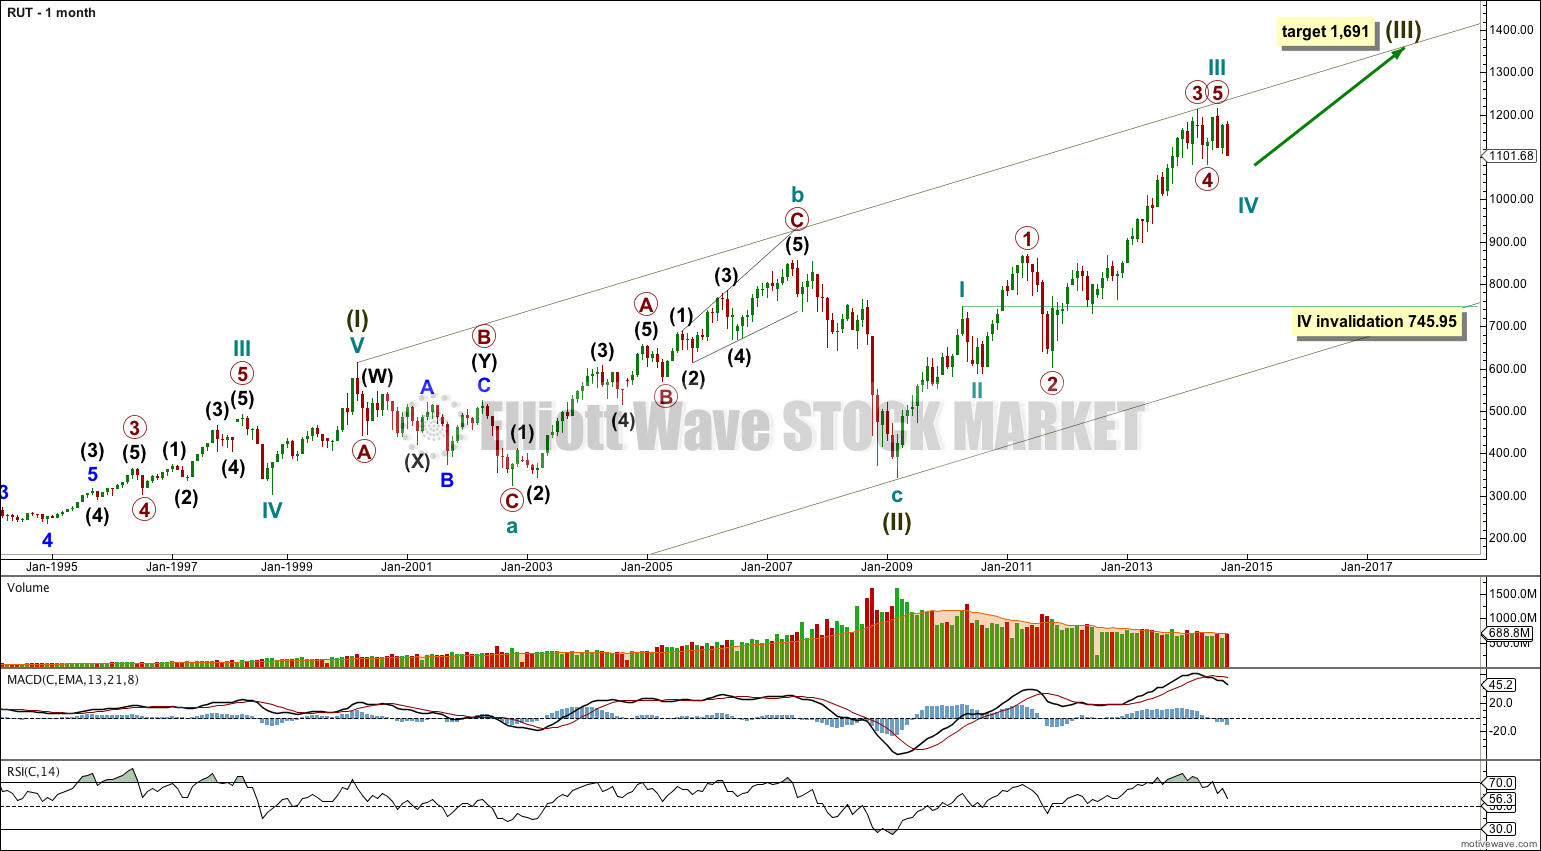
Data available extends back only to the end of 1987. Data begins with the 1987 “crash” which I am labeling a cycle degree second wave correction.
A five wave impulse for a super cycle wave (I) ended in March, 2000.
Ratios of cycle degree waves within super cycle wave (I) cannot be accurately calculated without all data from the start of Russell 2000 in 1984.
Super cycle wave (II) is seen as a complete expanded flat correction, with a shorter than usual C wave (which is not truncated because it does move very slightly below the end of cycle wave a). Cycle wave c is 45.87 points longer than 1.618 the length of cycle wave a, a variation just less than 10% and so acceptable. Super cycle wave (II) is a 50% correction of super cycle wave (I). Super cycle wave (I) lasted longer than 12 years (it begins when Russell 2000 began) and super cycle wave (II) lasted 9 years.
At 1,691 super cycle wave (III) would reach 1.618 the length of super cycle wave (I).
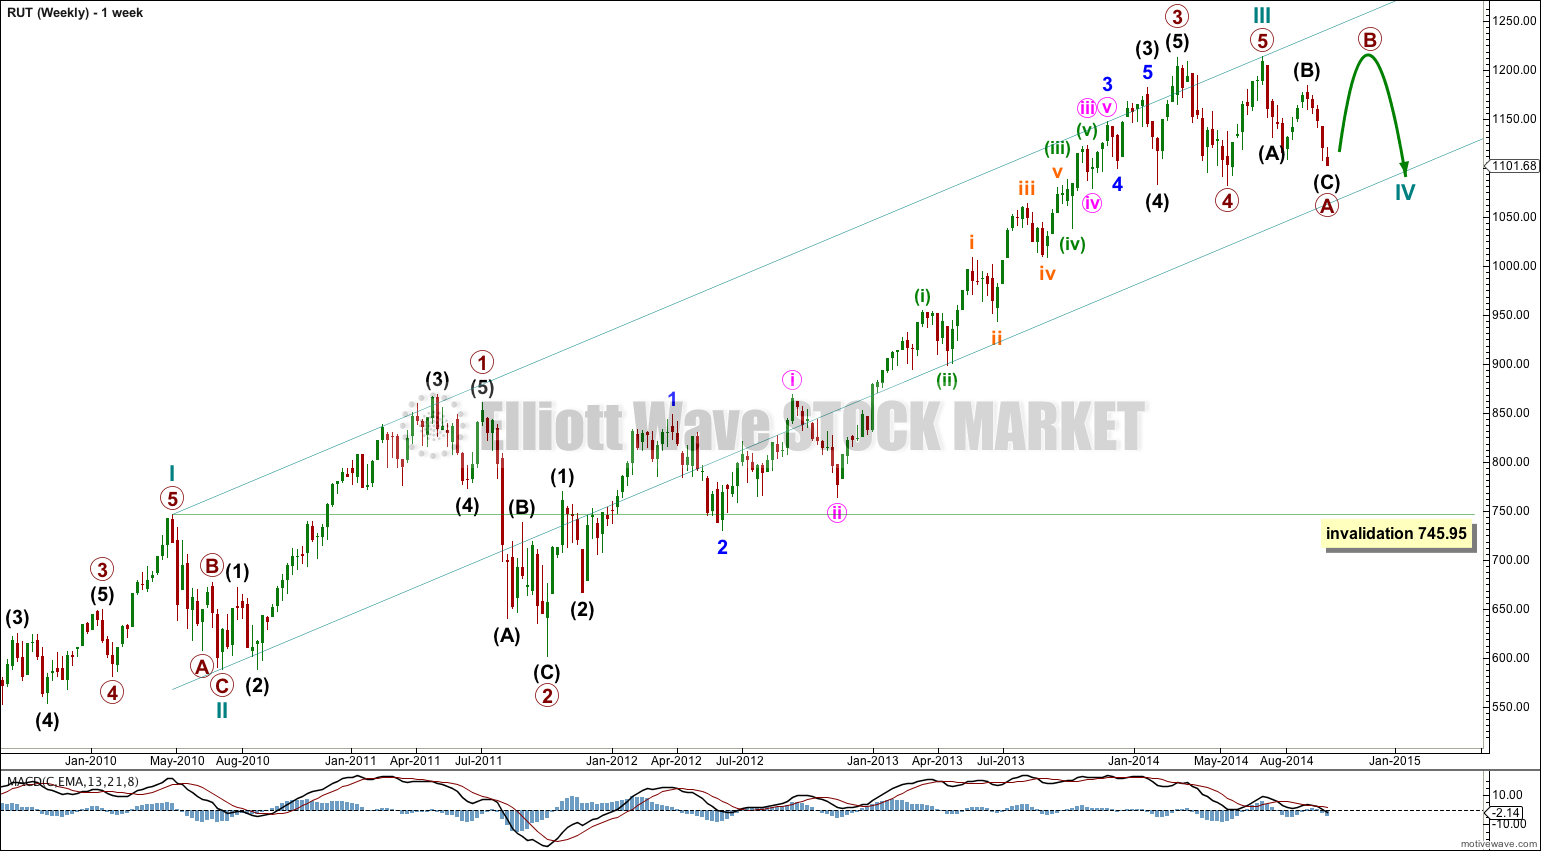
I am changing my wave count for RUT within super cycle wave (III) to see cycle wave III as over and cycle wave IV underway. Cycle wave III is 26.76 short of 1.618 the length of cycle wave I.
Cycle wave IV may not move into cycle wave I price territory below 745.95.
Super cycle wave (III) is incomplete. Within it cycle wave III is probably complete.
Cycle wave IV looks like it is subdividing as a flat or combination. Within it primary wave B should move higher and may make a new high above 1,213.55. Cycle wave IV may find support at the lower edge of the channel.
Draw the channel using Elliott’s first technique: draw the first trend line from the highs of cycle waves I to III, then place a parallel copy on the low of cycle wave II.
Cycle wave II was a shallow 39% zigzag lasting 10 weeks. Cycle wave IV is showing alternation in depth and structure. So far it has lasted 13 weeks and it is not quite halfway through.
Cycle wave IV may not move into cycle wave I price territory below 745.95.
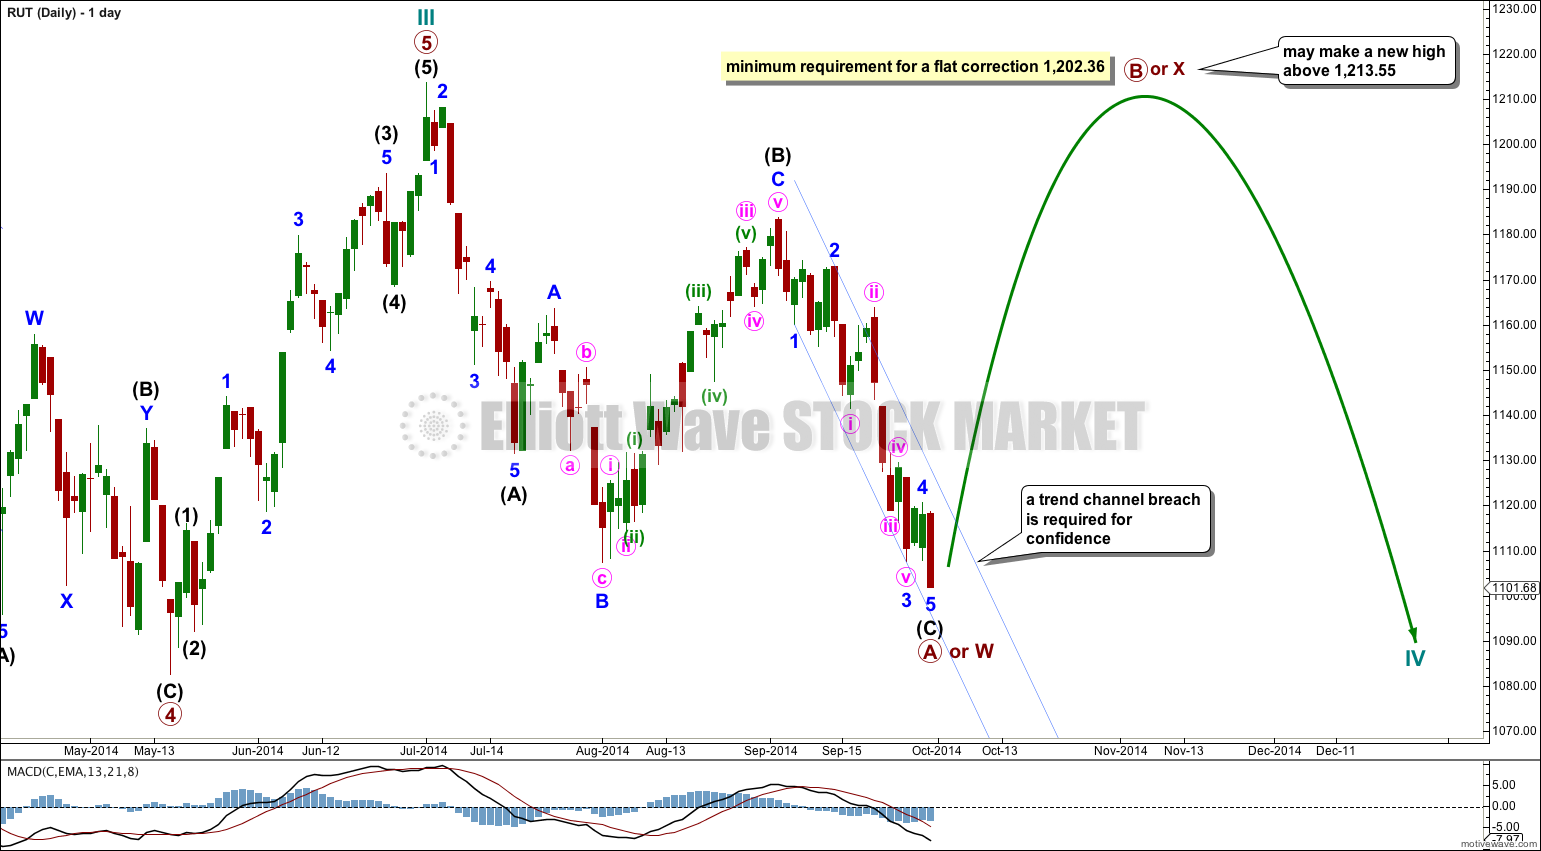
The final fifth wave of primary wave 5 to complete cycle wave III subdivides perfectly as a five wave impulse.
The downwards movement for primary wave A fits best as a zigzag, with an expanded flat for intermediate wave (B) in the middle. This sees the downwards movement labeled minor wave B within intermediate wave (B) as a zigzag which has a better fit than my last analysis. However, it is very difficult to see the upwards wave of minor wave C within intermediate wave (B) as a five because the middle of the third wave does not fit. I suspect something is wrong in my wave count at the beginning of this movement, within minute wave i and minuette wave (i), but I cannot move the time frame for this data down to see the subdivisions on the hourly chart.
Intermediate wave (C) subdivides perfectly as a completed impulse. The final fifth wave may yet move lower. Draw a channel about intermediate wave (C): draw the first trend line from the ends of minor waves 1 to 3, then place a parallel copy on the end of minor wave 2. Only when this small channel is clearly breached by at least one daily candlestick above it and not touching the upper trend line will I have any confidence that primary wave A is over.
If cycle wave IV is subdividing as a flat correction then within it primary wave B must reach up to a minimum 90% length of primary wave A at 1,202.36. If primary wave A moves lower this point must be recalculated.
If cycle wave IV is unfolding as a combination then primary wave X has no minimum upwards point.
For both a flat or combination the upwards wave of B or X may make a new high above the start of primary wave A at 1,213.55. There is no upper invalidation point.
B and X waves can be time consuming. I would expect it to last about 13 weeks or longer.