
Volume and ATR are used in this end of week analysis to analyse downwards movement for strength or weakness.
Both Elliott wave counts remain valid, and there is a clear price point which differentiates them.
Summary: The probability of the bearish wave count must now be considered to have increased: there are now bearish signals from On Balance Volume, VIX and the AD line. However, the trend remains upwards while price remains above 2,802.49; a series of higher highs and higher lows remains in place.
A new all time high above 2,916.50 would confirm the bullish wave count. At that stage, the target would then be in a small zone from 3,041 (Elliott wave) to 3,045 (classic analysis).
A new low below 2,802.49 would strongly indicate the bearish wave count is most likely. The target for a multi month consolidation of primary wave 4 would then be at either 2,698 (0.236 Fibonacci ratio) or 2,563 (0.382 Fibonacci ratio).
The final target for this bull market to end remains at 3,616, which may be met in October 2019.
New updates to this analysis are in bold.
The biggest picture, Grand Super Cycle analysis, is here.
Last historic analysis with monthly charts is here, video is here.
MAIN ELLIOTT WAVE COUNT – BULL
WEEKLY CHART
Click chart to enlarge.
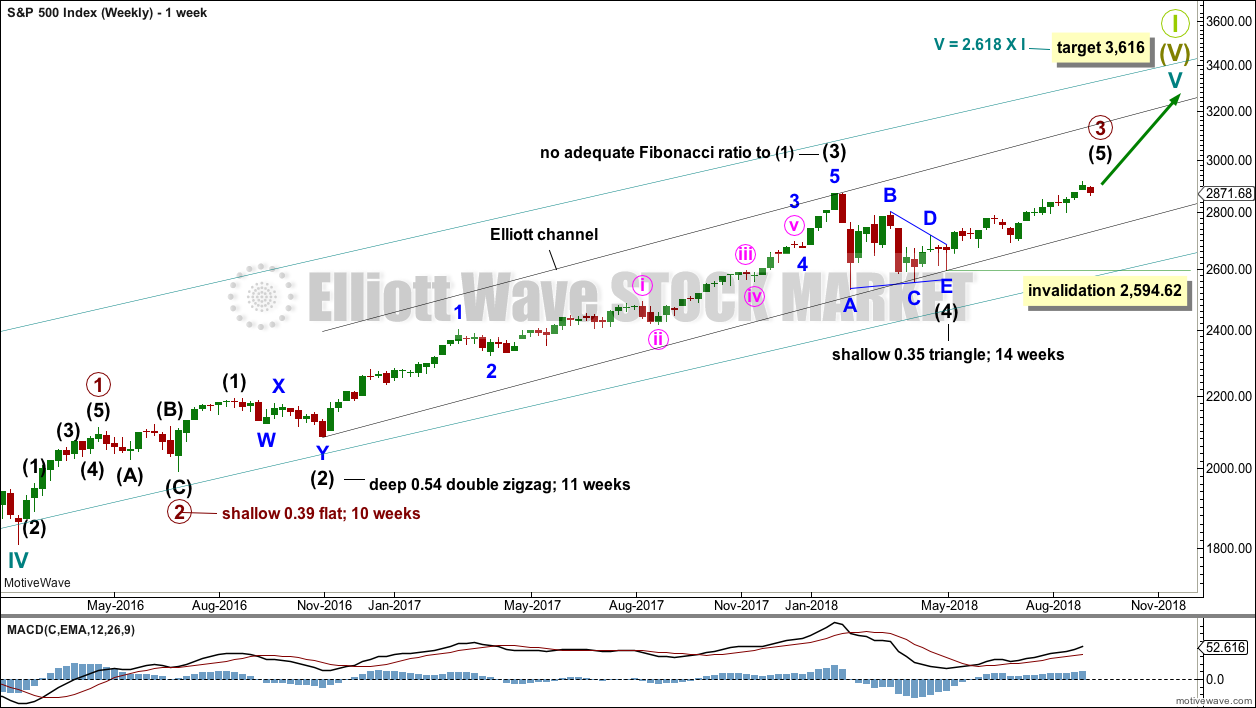
Cycle wave V must complete as a five structure, which should look clear at the weekly chart level and also now at the monthly chart level. It may only be an impulse or ending diagonal. At this stage, it is clear it is an impulse.
Within cycle wave V, the third waves at all degrees may only subdivide as impulses.
Intermediate wave (4) has breached an Elliott channel drawn using Elliott’s first technique. The channel is redrawn using Elliott’s second technique: the first trend line from the ends of intermediate waves (2) to (4), then a parallel copy on the end of intermediate wave (3). Intermediate wave (5) may end either midway within the channel, or about the upper edge.
There is perfect alternation and excellent proportion between intermediate waves (2) and (4).
The channel is redrawn about cycle wave V from the ends of primary degree waves.
At this stage, the expectation is for the final target to me met in October 2019. If price gets up to this target and either the structure is incomplete or price keeps rising through it, then a new higher target would be calculated.
DAILY CHART
Click chart to enlarge.
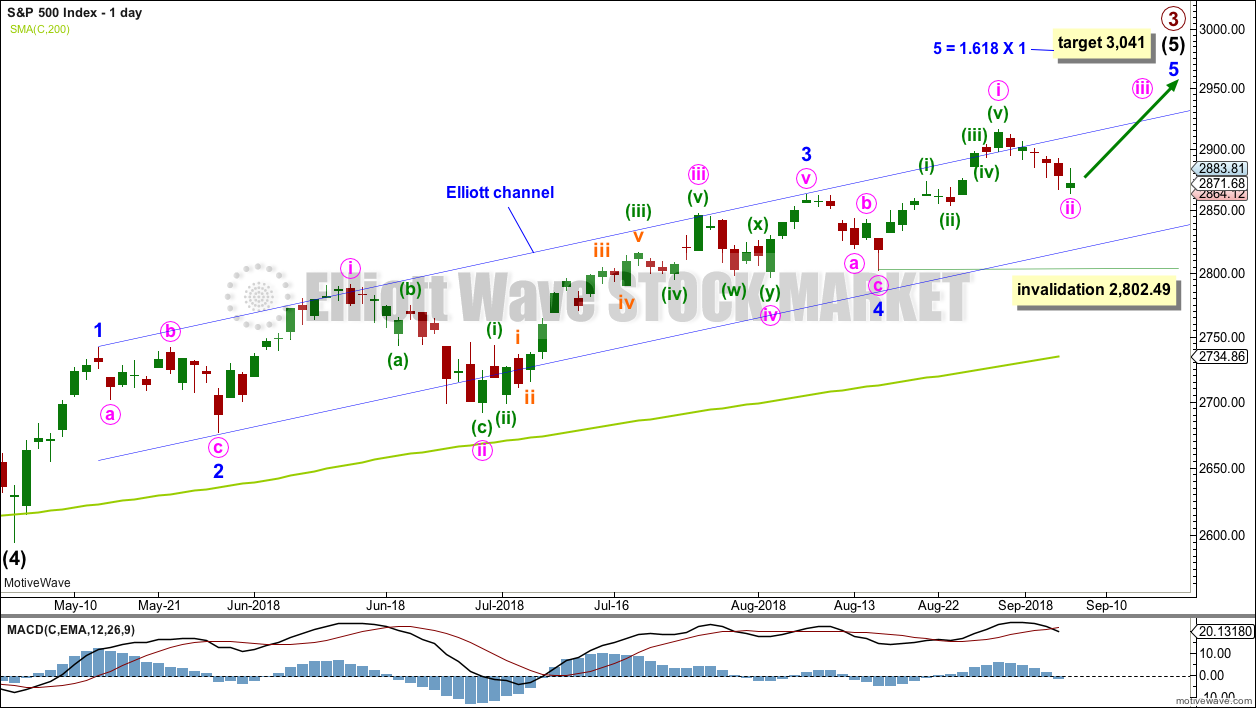
Intermediate wave (5) avoided a truncation now that it has a new high above the end of intermediate wave (3) at 2,872.87.
Intermediate wave (3) exhibits no Fibonacci ratio to intermediate wave (1). It is more likely then that intermediate wave (5) may exhibit a Fibonacci ratio to either of intermediate waves (1) or (3). Intermediate wave (5) has passed equality in length with intermediate wave (1). The next target was at 2,922, 1.618 the length of intermediate wave (1), which may have been almost met.
A target for intermediate wave (5) to end is recalculated at minor degree. Because this target is so close to the classic analysis target at 3,045, it does have a reasonable probability.
Intermediate wave (5) is unfolding as an impulse, and within it minor waves 1 through to 4 may now all be complete.
Assume the upwards trend remains intact while price remains above 2,802.49. The trend remains the same until proven otherwise.
HOURLY CHART
Click chart to enlarge.
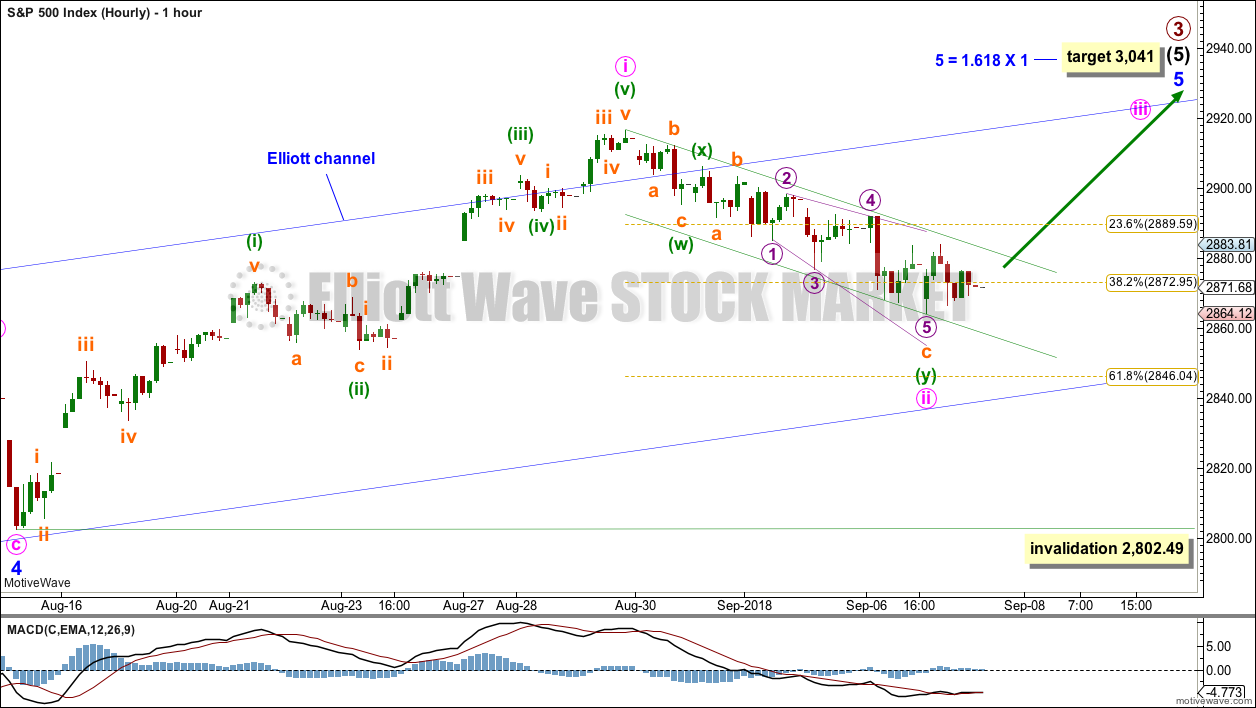
Because we should assume the trend remains the same, until proven otherwise, this will still remain the main wave count while price remains above 2,802.49.
Within intermediate wave (5) so far, minor wave 1 was relatively short and minor wave 3 extended (but does not exhibit a Fibonacci ratio to minor wave 1). Two actionary waves within an impulse may extend, so minor wave 5 may be extending.
Within minor wave 5, minute wave i may have been over at the last high. Minute wave ii may now be a completed double zigzag, ending just below the 0.382 Fibonacci ratio of minute wave i.
If minute wave ii continues any lower, it may not move beyond the start of minute wave i below 2,802.49.
ALTERNATE ELLIOTT WAVE COUNT – BEAR
WEEKLY CHART
Click chart to enlarge.
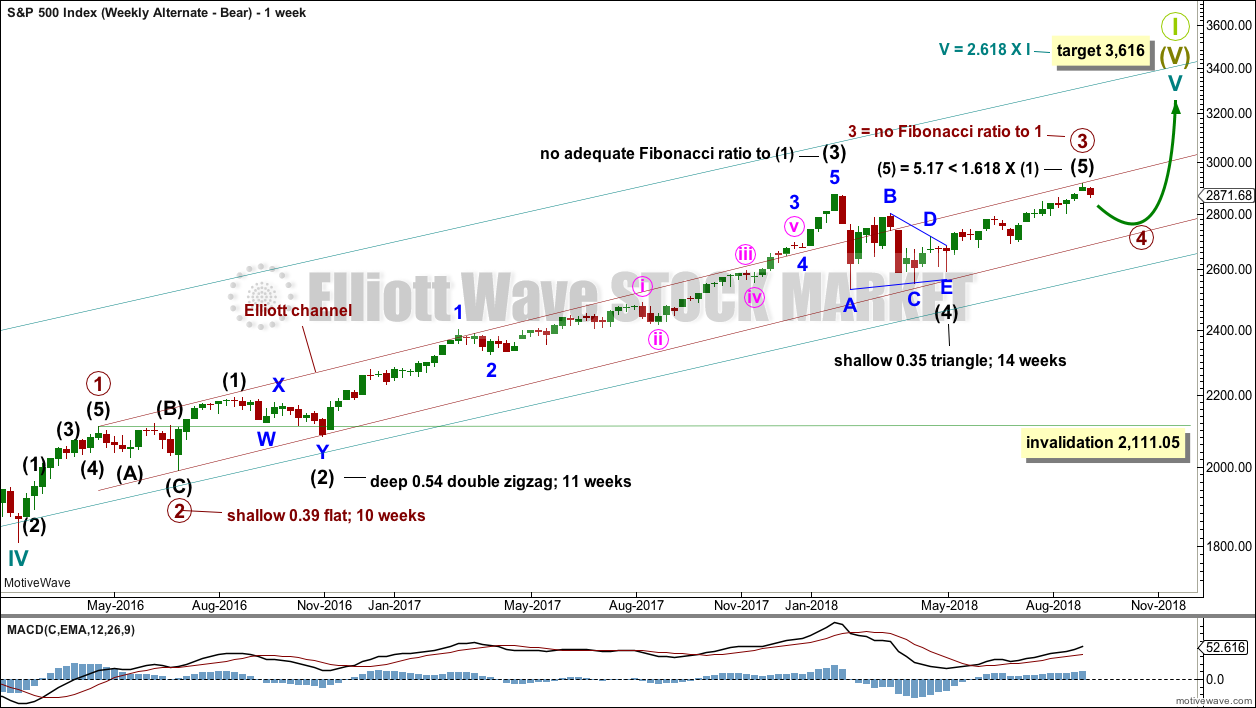
It is possible that primary wave 3 was over at the last high. Fibonacci ratios are noted on the chart.
Primary wave 2 was a shallow flat lasting 10 weeks. Primary wave 4 may be expected to exhibit alternation in one or both of depth and structure. Primary wave 4 may last about a Fibonacci 8, 13 or possibly even 21 weeks to exhibit reasonable proportion to primary wave 2.
Primary wave 2 shows up on the monthly chart. Primary wave 4 may be expected to last at least one month, and likely longer, for the wave count to have the right look at the monthly chart level.
Primary wave 4 may end about the lower edge of the maroon Elliott channel. Primary wave 4 may end within the price territory of the fourth wave of one lesser degree: intermediate wave (4) has its price territory from 2,872.87 to 2,532.69.
If primary wave 4 is deeper than expected, then it should find very strong support at the lower edge of the teal channel. This channel, copied over from the monthly chart, has provided support for all deeper pullbacks within this bear market since March 2009.
Primary wave 4 may not move into primary wave 1 price territory below 2,111.05.
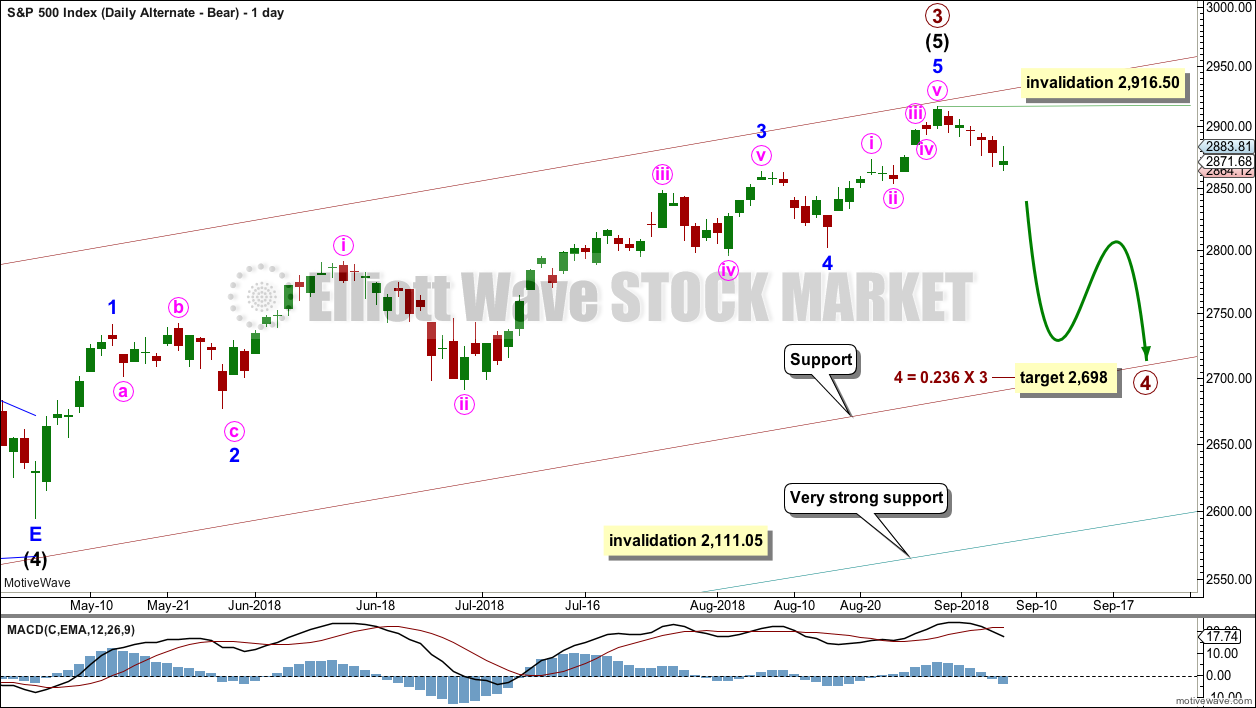
DAILY CHART
Click chart to enlarge.
The first movement down within primary wave 4 should be a five wave structure, which should be visible at the daily chart level. While that is incomplete, no second wave correction may move beyond the start of the first wave above 2,916.50.
Within the target range of 2,872.87 to 2,532.69 sit the 0.236 and 0.382 Fibonacci ratios of primary wave 3. The 0.236 Fibonacci ratio at 2,698 would be the first target. If price keeps falling through this first target, then the next target would be the 0.382 Fibonacci ratio at 2,563.
Primary wave 4 would most likely be a zigzag, combination or triangle. Within a combination or triangle, minor wave A (or X) should subdivide as a three wave structure, most likely a zigzag. Within a zigzag minor wave A must subdivide as a five wave structure.
Within primary wave 4, downwards waves may be swift and very strong.
HOURLY CHART
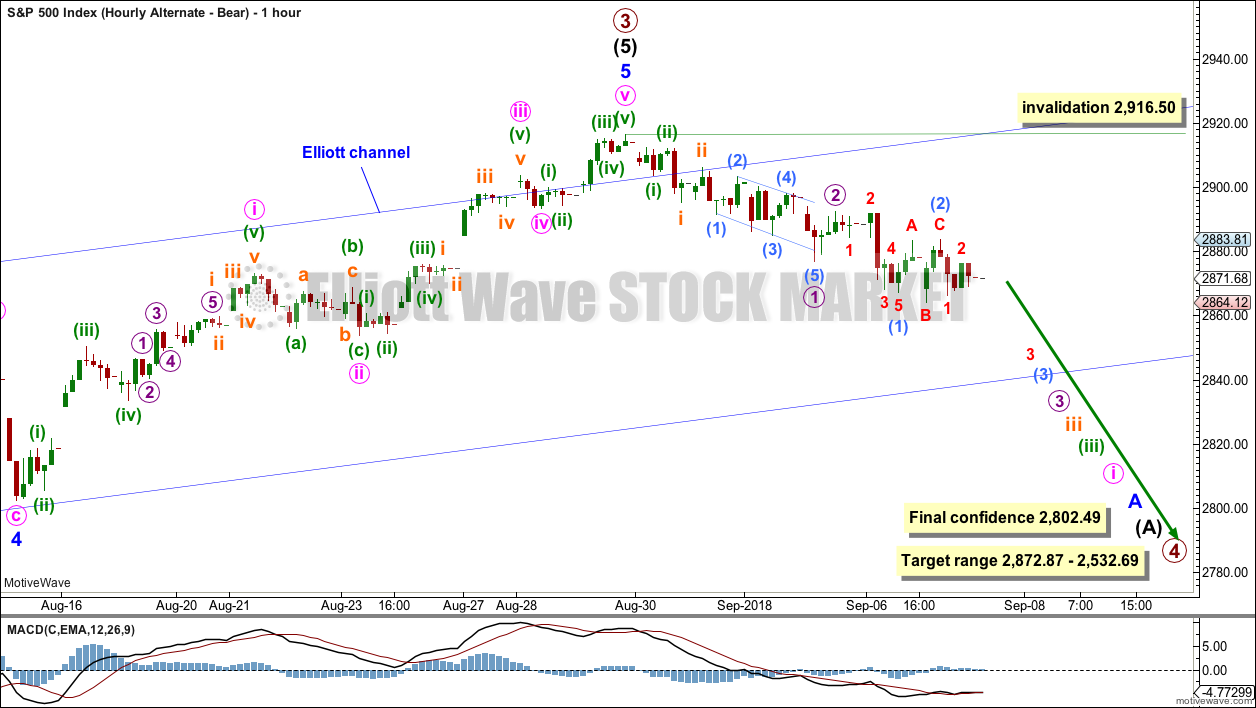
Click chart to enlarge.
At this stage, there may now be a series of five first and second waves complete. This wave count would now expect to see an increase in downwards momentum next week.
Classic analysis is giving weak bearish signals. It is time to more seriously consider this wave count.
TECHNICAL ANALYSIS
WEEKLY CHART
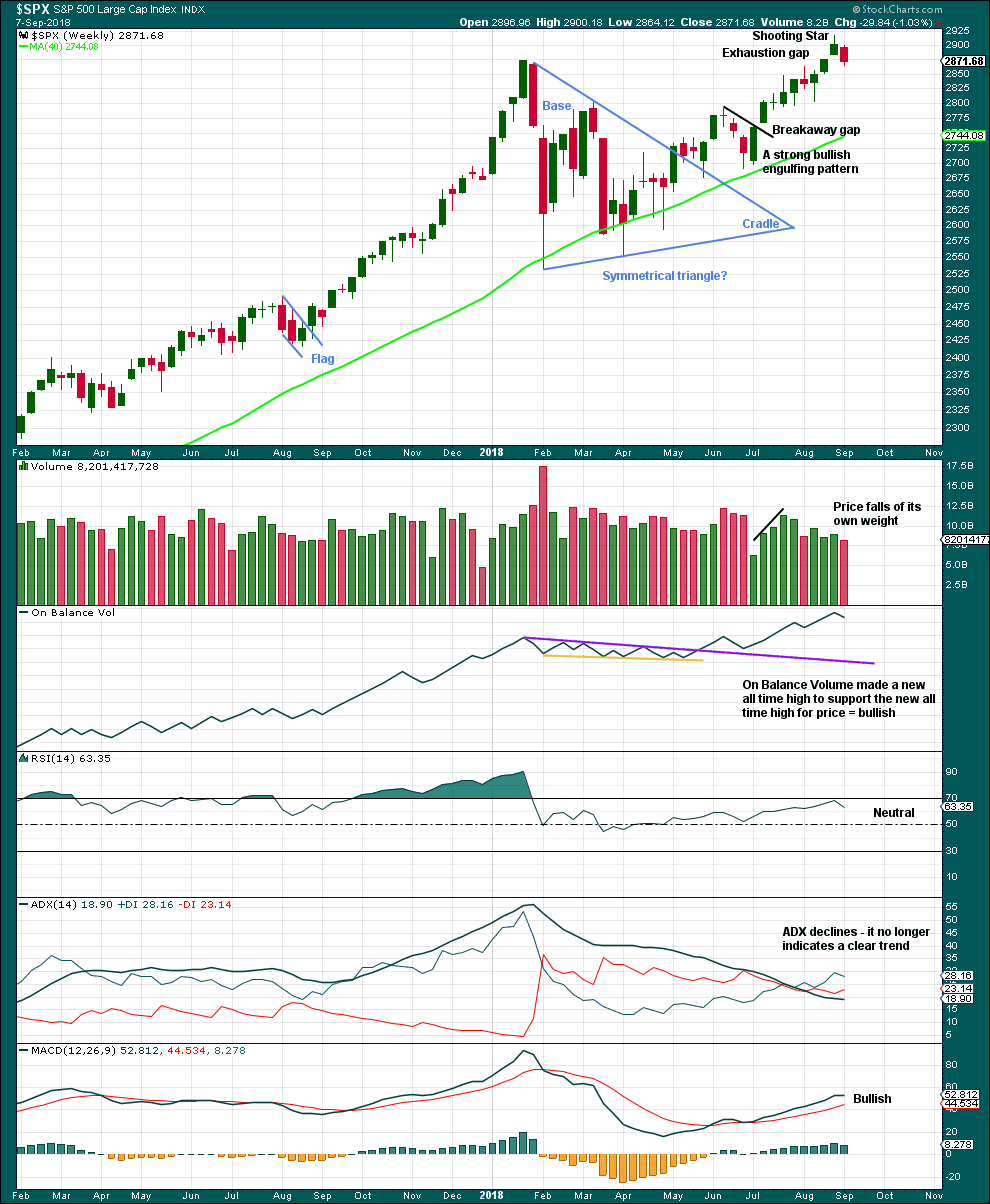
Click chart to enlarge. Chart courtesy of StockCharts.com.
The symmetrical triangle may now be complete. The base distance is 340.18. Added to the breakout point of 2,704.54 this gives a target at 3,044.72. This is very close to the new Elliott wave target at 3,041.
The shooting star candlestick pattern now has some bearish confirmation with a downwards week which closes the last gap. The gap is now correctly named an exhaustion gap. The target at 3,044 may not be met.
However, it is also possible that the downwards week this week is a typical backtest of support after the new all time high.
DAILY CHART

Click chart to enlarge. Chart courtesy of StockCharts.com.
Since the low on the 2nd of April, 2018, price has made a series of higher highs and higher lows. While the last swing low at 2,802.49 has not been breached, there will still be a series of higher highs and higher lows in place; the upwards trend should be assumed to remain intact until proven otherwise.
At this stage, downwards movement looks corrective; this does not look like a convincing start to primary wave 4. ATR is weak and volume is now declining.
The signal this week from On Balance Volume breaking below support is very weak only. The trend line had only three tests then was weakened with a breach of resistance.
An exhaustion gap is the most bearish signal on this chart, and it is for this reason that a bearish alternate is now charted at all time frames.
VOLATILITY – INVERTED VIX CHART
WEEKLY CHART
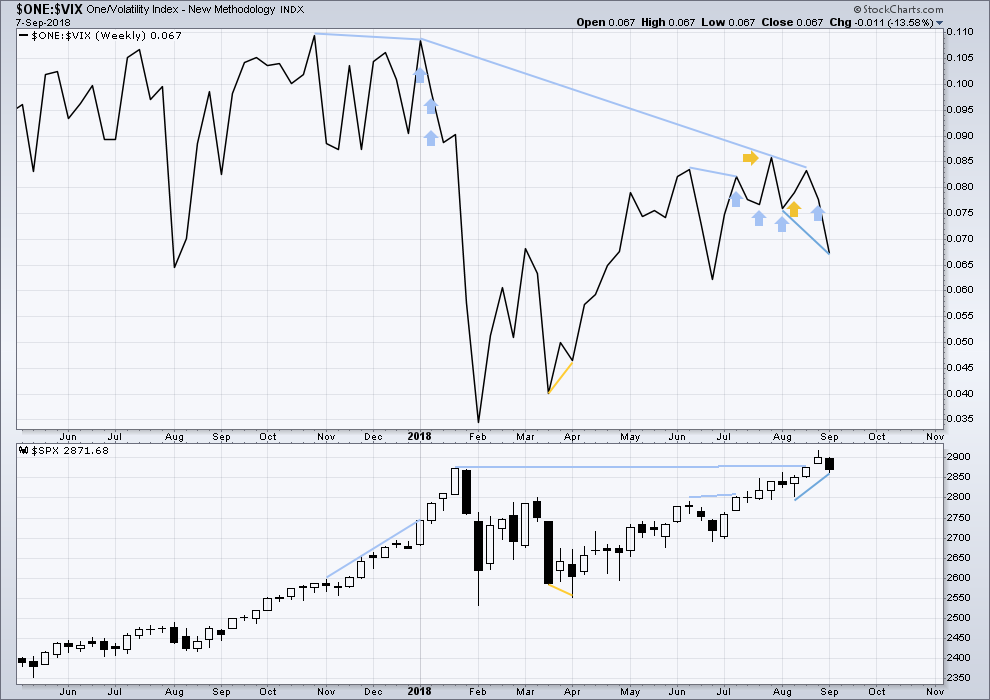
Click chart to enlarge. Chart courtesy of StockCharts.com. So that colour blind members are included, bearish signals
will be noted with blue and bullish signals with yellow.
To keep an eye on the all time high for inverted VIX a weekly chart is required at this time.
Notice how inverted VIX has very strong bearish signals four weeks in a row just before the start of the last large fall in price. At the weekly chart level, this indicator may be useful again in warning of the end of primary wave 3.
At this time, there is mid term bearish divergence between price and inverted VIX: price has made a new all time high, but inverted VIX has not. This divergence may persist for some time. It may remain at the end of primary wave 3, and may develop further to the end of primary wave 5.
There is now strong bearish divergence between price and inverted VIX this week. This week inverted VIX has made a strong new swing low below the low 4/5 weeks ago, but price has not. Downwards movement from price this week comes with a strong increase in market volatility.
There is now some reasonable warning that primary wave 3 could be over.
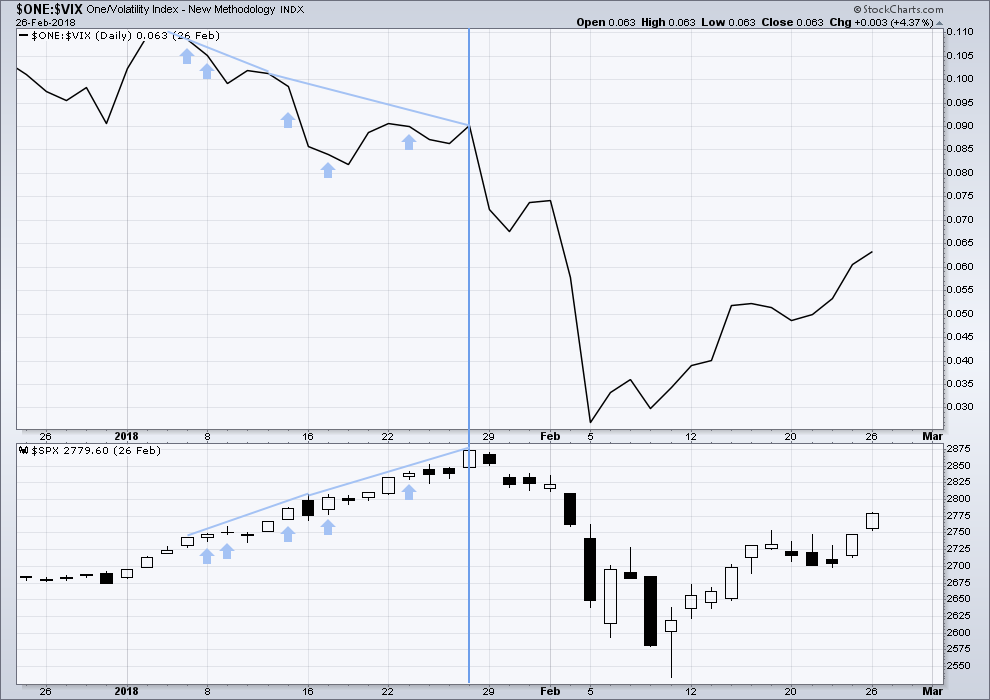
DAILY CHART
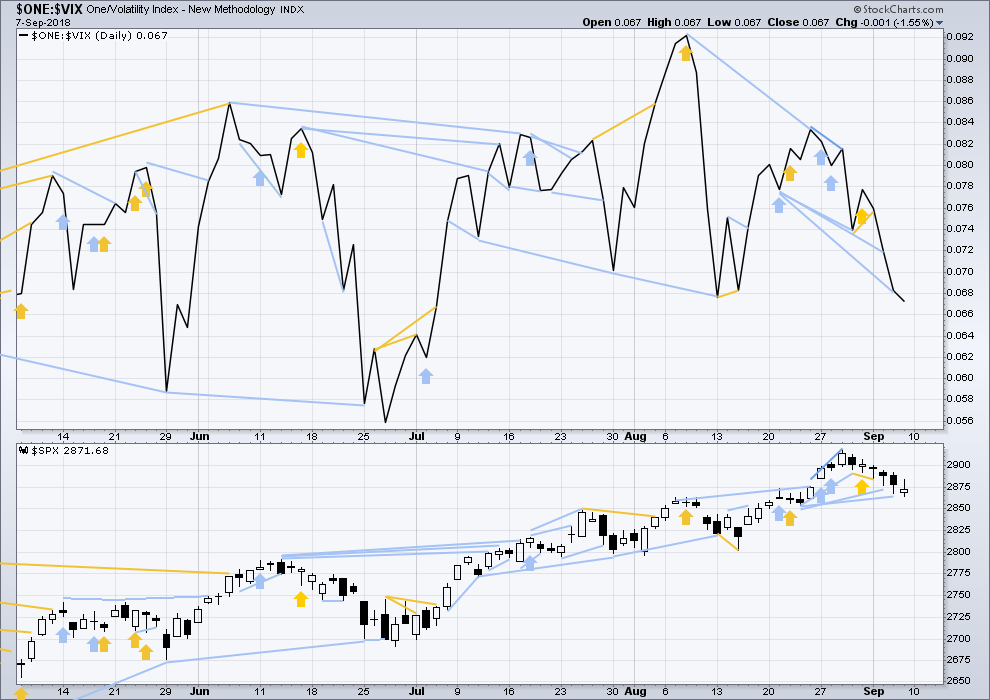
Click chart to enlarge. Chart courtesy of StockCharts.com. So that colour blind members are included, bearish signals
will be noted with blue and bullish signals with yellow.
Normally, volatility should decline as price moves higher and increase as price moves lower. This means that normally inverted VIX should move in the same direction as price.
There is mid term divergence with a new all time high from price not supported by a corresponding new all time high from inverted VIX. This divergence is bearish.
The cluster of bearish signals from inverted VIX continues. Volatility is increasing faster than price is falling. This increase in volatility is bearish. This was seen just prior to intermediate wave (4).
BREADTH – AD LINE
WEEKLY CHART
Click chart to enlarge. Chart courtesy of StockCharts.com.
When primary wave 3 comes to an end, it may be valuable to watch the AD line at the weekly time frame as well as the daily.
There is now short term weak divergence between price and the AD line: the AD line has made a new low below the low two weeks ago, but price has not. Downwards movement this week has strong support from declining market breadth. This divergence is bearish and may be all that is seen from the AD line to indicate a start to primary wave 4.
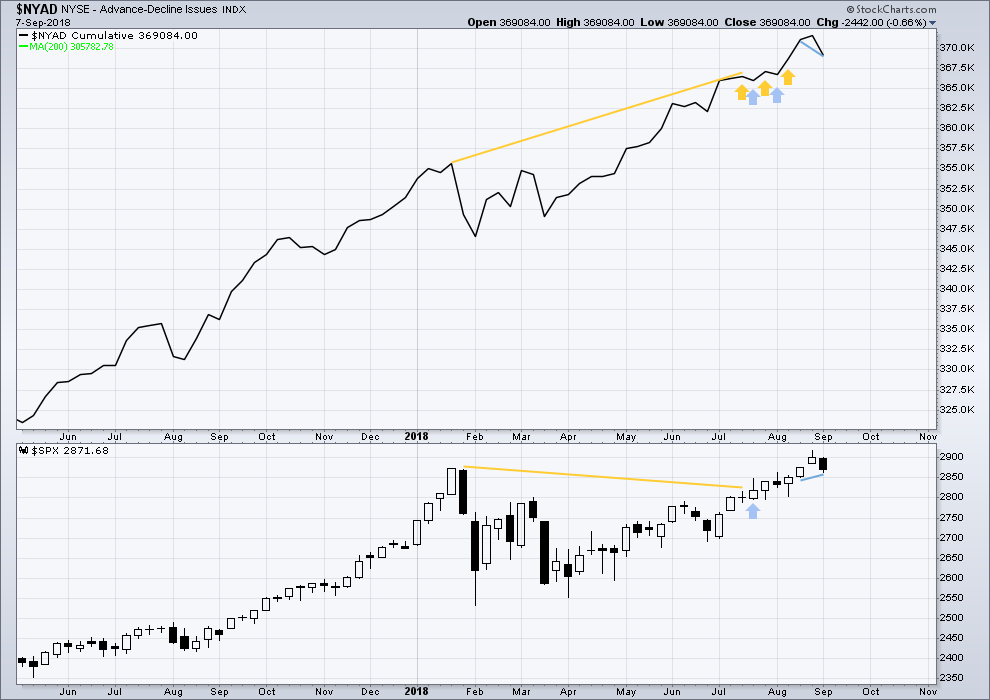
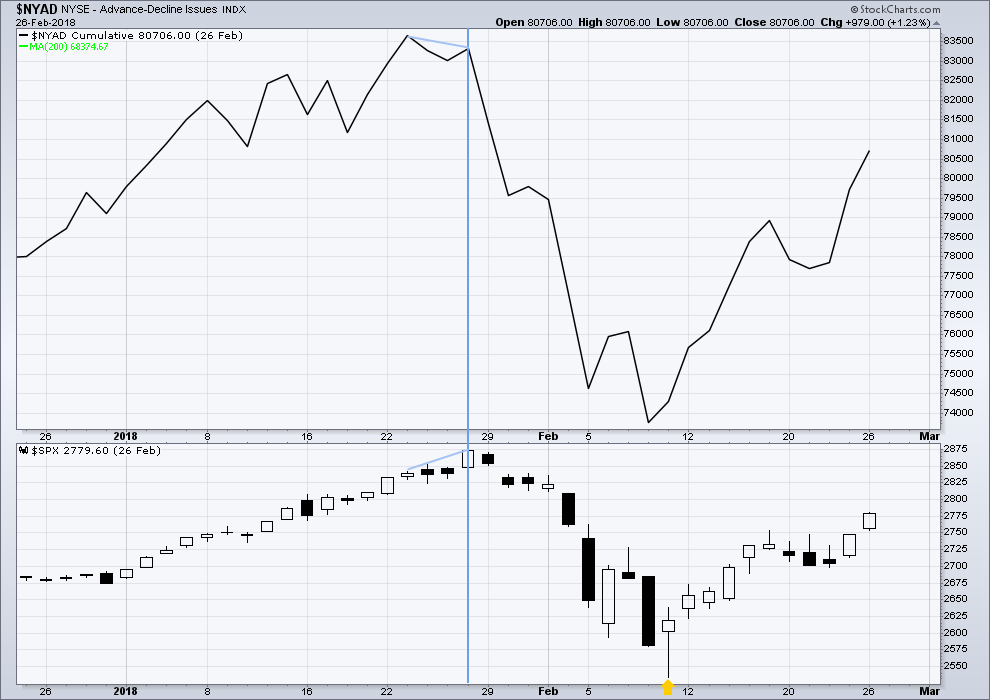
DAILY CHART
Click chart to enlarge. Chart courtesy of StockCharts.com.
There is normally 4-6 months divergence between price and market breadth prior to a full fledged bear market. This has been so for all major bear markets within the last 90 odd years. With no longer term divergence yet at this point, any decline in price should be expected to be a pullback within an ongoing bull market and not necessarily the start of a bear market. New all time highs from the AD line means that any bear market may now be an absolute minimum of 4 months away. It may of course be a lot longer than that. My next expectation for the end of this bull market may now be October 2019.
Breadth should be read as a leading indicator.
The AD line is falling faster than price. Although the divergence at this time frame is not very strong, it is still bearish
All of small, mid and large caps made new all time highs on the 27th of August. There is a little divergence here in breadth with large caps continuing to make new all time highs on the 29th of August and small and mid caps lagging.
All of small, mid and large caps saw a fall in price this week. The fall in price has support from market breadth.
DOW THEORY
The following lows need to be exceeded for Dow Theory to confirm the end of the bull market and a change to a bear market:
DJIA: 23,360.29.
DJT: 9,806.79.
S&P500: 2,532.69.
Nasdaq: 6,630.67.
Nasdaq and DJT and now the S&P500 have all made recent new all time highs. For Dow Theory confirmation of the ongoing bull market, DJIA needs to make a new all time high.
Charts showing each prior major swing low used for Dow Theory may be seen at the end of this analysis here.
ANALYSIS OF THE END OF INTERMEDIATE WAVE (3)
TECHNICAL ANALYSIS
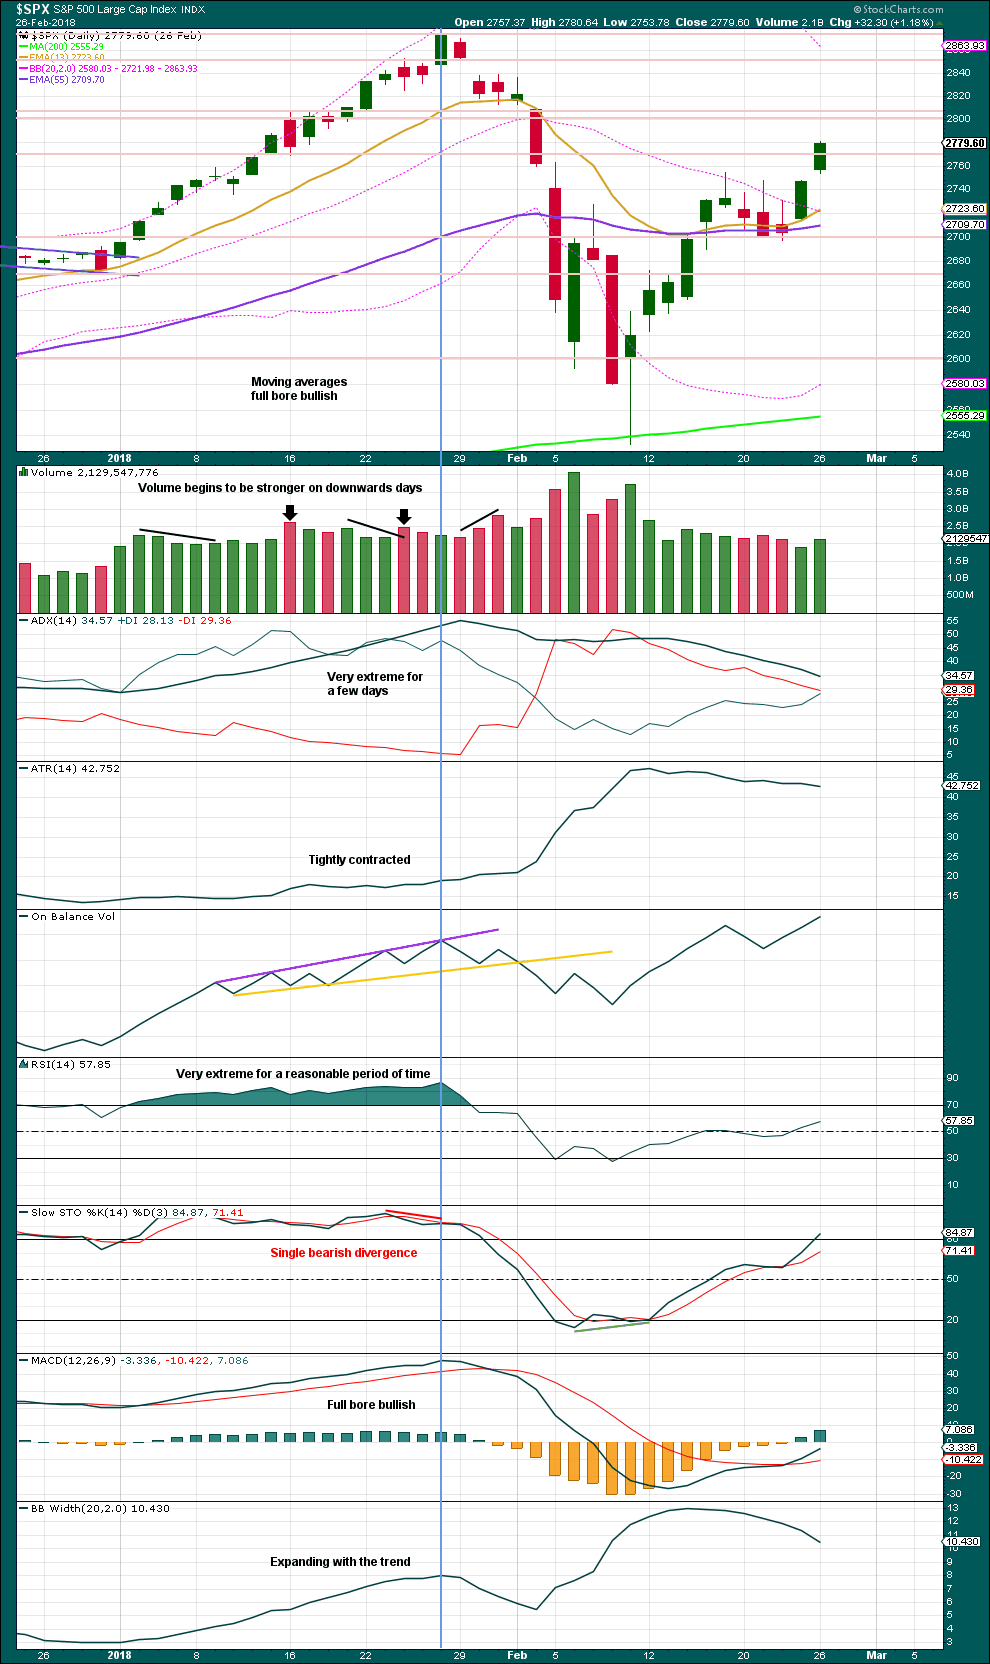
Click chart to enlarge. Chart courtesy of StockCharts.com.
This chart looked overly bullish at the end of intermediate wave (3). The only warning in hindsight may have been from volume spiking slightly on downwards days. There was no bearish divergence between price and either of RSI or On Balance Volume.
Single bearish divergence between price and Stochastics was weak, which is often an unreliable signal.
VIX
Click chart to enlarge. Chart courtesy of StockCharts.com.
The strongest warning of an approaching intermediate degree correction at the daily chart level came from inverted VIX.
There was strong double bearish divergence at the high of intermediate wave (3), which is noted by the vertical line. There was also a sequence of five days of bearish divergence, days in which price moved higher but inverted VIX moved lower.
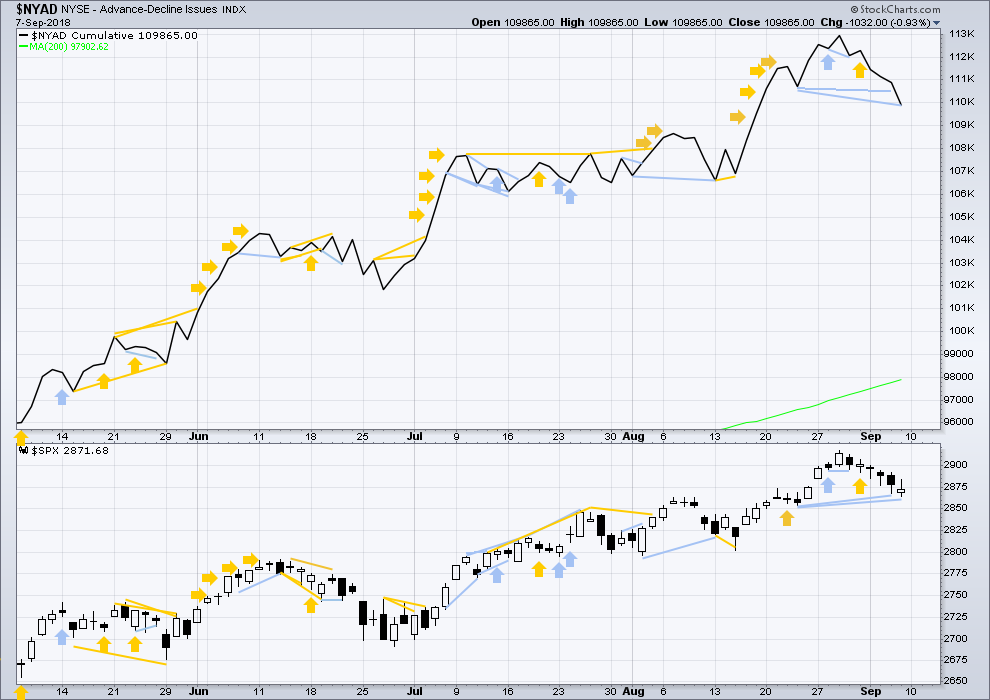
AD LINE
Click chart to enlarge. Chart courtesy of StockCharts.com.
There was only single bearish divergence between price and the AD line at the end of intermediate wave (3). Approaching the high, there were no instances of price moving higher and the AD line moving lower.
Conclusion: When studying the behaviour of price and these indicators just before the start of intermediate wave (4), we may see some clues for warning us of primary wave 4. A cluster of bearish signals from VIX along with a bearish divergence from price and the AD line or On Balance Volume may warn of primary wave 4. The next instance will probably not behave the same as the last, but there may be similarities.
At this time, it does not look like primary wave 4 may begin right now, but we need to be aware of its approach.
Published @ 03:55 a.m. EST on 8th September, 2018.
—
Careful risk management protects your trading account(s).
Follow my two Golden Rules:
1. Always trade with stops.
2. Risk only 1-5% of equity on any one trade.
Main hourly chart updated:
The channel is breached, we have a gap up today. It is looking like another pullback is over.
SPX trying to break long? Not perfectly convincing yet, but maybe soon?
I see “bull signs”, Curtis. It’s broken the down trend line. It’s structuring up some higher lows on the hourly. It’s in hour 4 of a squeeze and the MACD has swung to “up”. Hourly trend indicator still “down” however. It “should” go but every ii and iv we’ve had for months has extended longer and deeper than expected just about every time. I guess it reflects the “choppy” external world.
NFLX is getting reasonably set up on the long side.
note the multi-hour squeeze in play now…
Hi Lara
We will see if your right SPX 3600 price target is by far one of the most bullish targets on Wall street!
There’s been 4 recessions since 1929 without a so called inverted yield curve that took place.
Considering that are interest rates are way below the level of what they should be at the moment according to GDP and growth.
People are counting on the yield curve i believe this time they might be wrong.
Just my little humble opinion.
Also Consider the Q Ratio!
as Well as the Wilshire 5000 to GDP was equal to the 2000 peak.
Other scary issue is there’s only been a handful of stocks this year that made up all of the gains in the stock market were talking like 10 stocks here.
That’s very unhealthy thing for this so called bull market.
Pray that your Apple and Amazon hold up this market because if they drop hard its game over.
All comments welcome
Here is an interesting tidbit,
After the SPX is up 5 months in a row (like just occurred), the SPX is up 9 months later 25 of 25 (100%) times with an average gain of 9.8%. That puts the SPX 9 month price target at 3182. In addition, the past 25 times it did that, 24 times it was higher 12 months later.
I like ‘dem odds Rodney!
BTW, what did you think of the “new” NFL product yesterday? I found the virtual elimination of the “hit with intention to create injury” via the new “no leading with the head” and “no pile driving the QB” etc. to vastly improve the game. Enough with that nonsense: play football! I enjoy the game more now. I know some just want “those kinds of hits”, but I always thought it was a pretty repulsive distraction to the game, unnecessary, and very difficult to watch at times. I liked what I saw yesterday, and it gives some hope the game might be able to survive it’s health issues.
I played the game many years ago when it was much rougher and dangerous. Fortunately I came away with little brain injury (Except if you ask my family, sometimes they say I am nuts!) However, I have shoulder injuries now needing full replacement. I have had 5 knee surgeries thankfully with full recovery and no after effects. I have two fractured vertebrae and lower back disc degeneration. My Teeter inversion table helps greatly. I also suffered a broken leg, many broken fingers and had shoulder surgery at 18 years of age. I was playing football 5 weeks after that surgery. Crazy times. Despite all this, I am very lucky and blessed to be able to have a fully active and adventurous life.
On balance, I appreciate the rule changes made to protect the players especially from brain trauma. I did not notice much, if any difference with the new rules that effected the outcome of the games. So, all in all, the rule changes have been a very good thing. However, I would never encourage a young person to take up the sport even though it made it possible for me to attend and graduate from college magnum cum laude. Young folk should take up sports that they can play for the rest of their lives like baseball, basketball, golf, backpacking and not to forget, surfing.
What I did notice is that too many players continue to get leg and knee injuries. The NFL needs to find ways to protect this part of the player’s bodies as well.
Brutal game, glad you got out without yet even more serious issues. I don’t think legs and knees will ever be safe given the nature of the game. My son played a bit and suffered multiple concussions and had to stop (but still has a burning desire for it at 19 nonetheless).
Those injuries are part of the game… best way to reduce the odds for that is to work out, work out and work out more and never stop driving until the pay is blown dead by the ref. … and also pray.
Only NFL game I will be watching this season is the NY Jet game… same as he last 3 years. I expect TV ratings to be down big again this year! That won’t change until owners take back control of the workplace!
Lara have you looked much at the Nasdaq index charts. I was thinking it might be useful to figure out which wave count is correct.
The Nasdaq a very related market appears to me to be sitting on a major trend line (me as a non technical expert) and had a bearish candlestick Friday. If the Nasdaq futures are way down Monday morning, would that be enough confirmation that we are in primary 4 and a signal go short? Conversely, If it reverses, could we assume the primary wave count is correct? I know they are different markets but could you look at that index and give insite as to what that market is suggesting? Also, have you considered starting a Nasdaq analysis service? I for one would definitely join if you start one. Thank you for your excellent analysis, my trading account has definitely benefitted!
Great analysis, commentary and presentation, as always.
Have a great weekend. This weekend is the start of professional football in the USA (not that one called soccer). I will be busy Sunday afternoon and evening watching the games. I hope everyone else has a great weekend.
Remember – Protect your shorts. You never want to get caught with them down!
Unless, of course, you were the local Electrical Contractor with the catchy logo on his truck:
” Let Us Remove Your Shorts!”