
There were conflicting signals in last analysis from the AD line and On Balance Volume. The direction for Monday was unclear.
A new low below 2,585.89 indicated more downwards movement, with the first target at 2,561. The low for Monday was 7.2 points below the target.
Summary: Bullish signals today from Stochastics, RSI, inverted VIX, the AD line, and a long lower candlestick wick very strongly suggest a low is in place here. Expect upwards movement this week. The target is now a range within 2,752 – 2,766. When there is more upwards structure to analyse, then a smaller target may be calculated.
Always practice good risk management. Always trade with stops and invest only 1-5% of equity on any one trade.
New updates to this analysis are in bold.
The biggest picture, Grand Super Cycle analysis, is here.
Last historic analysis with monthly charts is here. Video is here.
An alternate idea at the monthly chart level is given here at the end of this analysis.
An historic example of a cycle degree fifth wave is given at the end of the analysis here.
MAIN ELLIOTT WAVE COUNT
WEEKLY CHART
Click chart to enlarge.
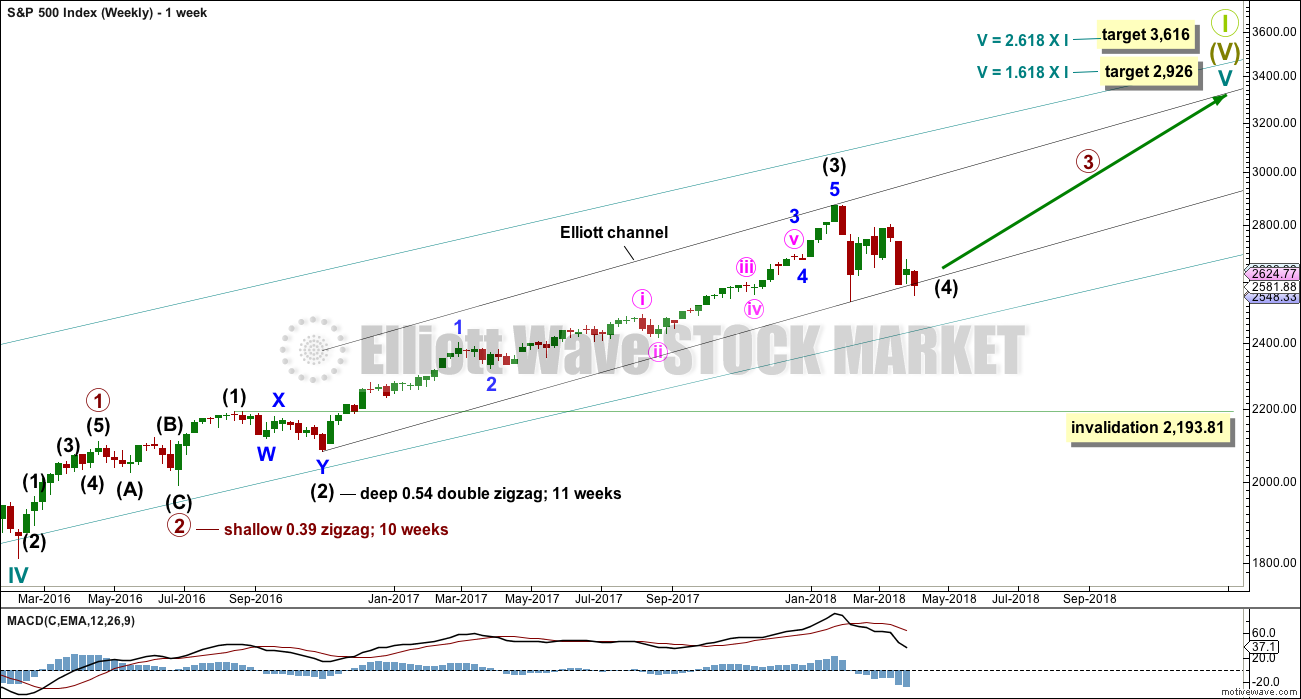
Cycle wave V must complete as a five structure, which should look clear at the weekly chart level. It may only be an impulse or ending diagonal. At this stage, it is clear it is an impulse.
Within cycle wave V, the third waves at all degrees may only subdivide as impulses.
Intermediate wave (4) has breached an Elliott channel drawn using Elliott’s first technique. The channel is redrawn using Elliott’s second technique as if intermediate wave (4) was over at the first swing low within it. If intermediate wave (4) continues sideways, then the channel may be redrawn when it is over. The upper edge may provide resistance for intermediate wave (5).
Intermediate wave (4) may not move into intermediate wave (1) price territory below 2,193.81. However, it would be extremely likely to remain within the wider teal channel (copied over from the monthly chart) if it were to be reasonably deep. This channel contains the entire bull market since the low in March 2009, with only two small overshoots at the end of cycle wave IV. If this channel is breached, then the idea of cycle wave V continuing higher would be discarded well before the invalidation point is breached.
At this stage, it now looks like intermediate wave (4) may be continuing further sideways as a combination, triangle or flat. These three ideas are separated into separate daily charts. All three ideas would see intermediate wave (4) exhibit alternation in structure with the double zigzag of intermediate wave (2).
A double zigzag would also be possible for intermediate wave (4), but because intermediate wave (2) was a double zigzag this is the least likely structure for intermediate wave (4) to be. Alternation should be expected until price proves otherwise.
DAILY CHART – TRIANGLE
Click chart to enlarge.
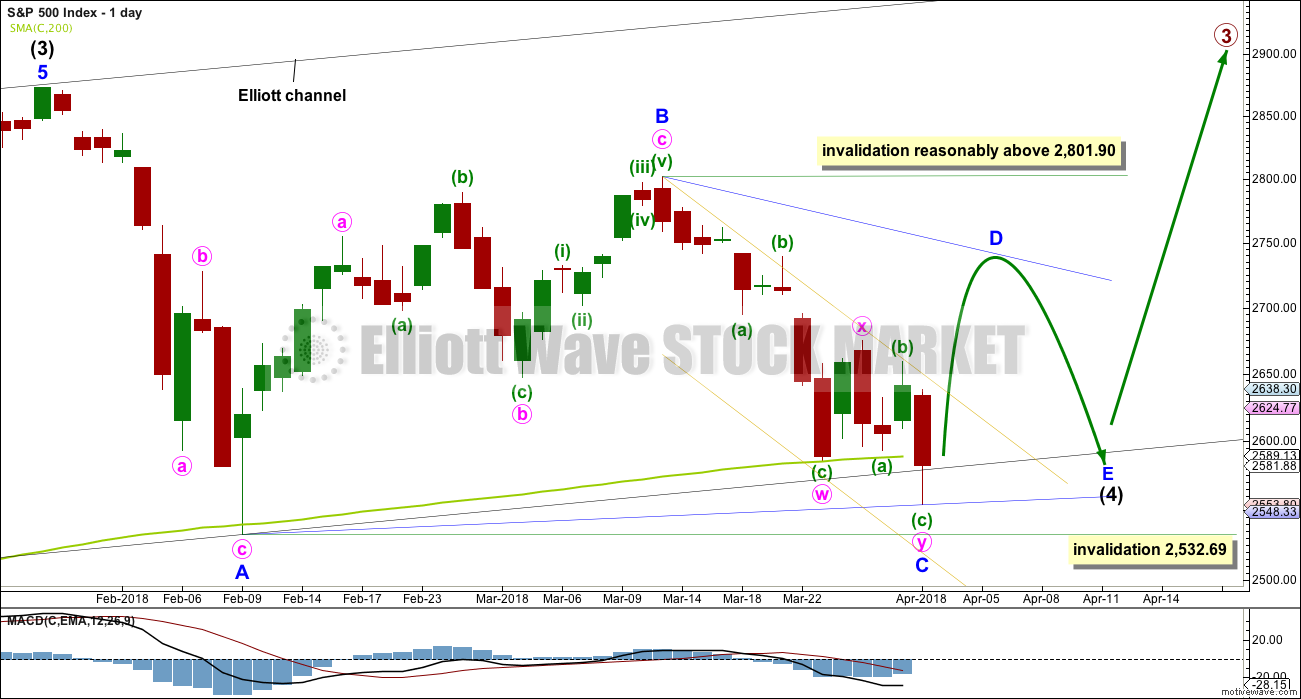
This first daily chart looks at a triangle structure for intermediate wave (4). The triangle may be either a regular contracting or regular barrier triangle. Within the triangle, minor waves A, B and again C may be complete.
If intermediate wave (4) is a regular contracting triangle, the most common type, then minor wave D may not move beyond the end of minor wave B above 2,801.90. Minor wave D would be very likely to end about 0.80 to 0.85 the length of minor wave C.
If intermediate wave (4) is a regular barrier triangle, then minor wave D may end about the same level as minor wave B at 2,801.90. As long as the B-D trend line remains essentially flat a triangle will remain valid. In practice, this means the minor wave D can end slightly above 2,801.90 as this rule is subjective.
When a zigzag upwards for minor wave D is complete, then this wave count would expect a final smaller zigzag downwards for minor wave E, which would most likely fall reasonably short of the A-C trend line.
If this all takes a further four weeks to complete, then intermediate wave (4) may total a Fibonacci 13 weeks and would be just two weeks longer in duration than intermediate wave (2). There would be very good proportion between intermediate waves (2) and (4), which would give the wave count the right look.
The lower wick of today’s candlestick overshoots the black channel and the 200 day moving average. This is entirely acceptable for this wave count; the overshoot does not mean price must now continue lower. The A-C trend line for this wave count should have a slope, so minor wave C should now be over.
HOURLY CHART
Click chart to enlarge.
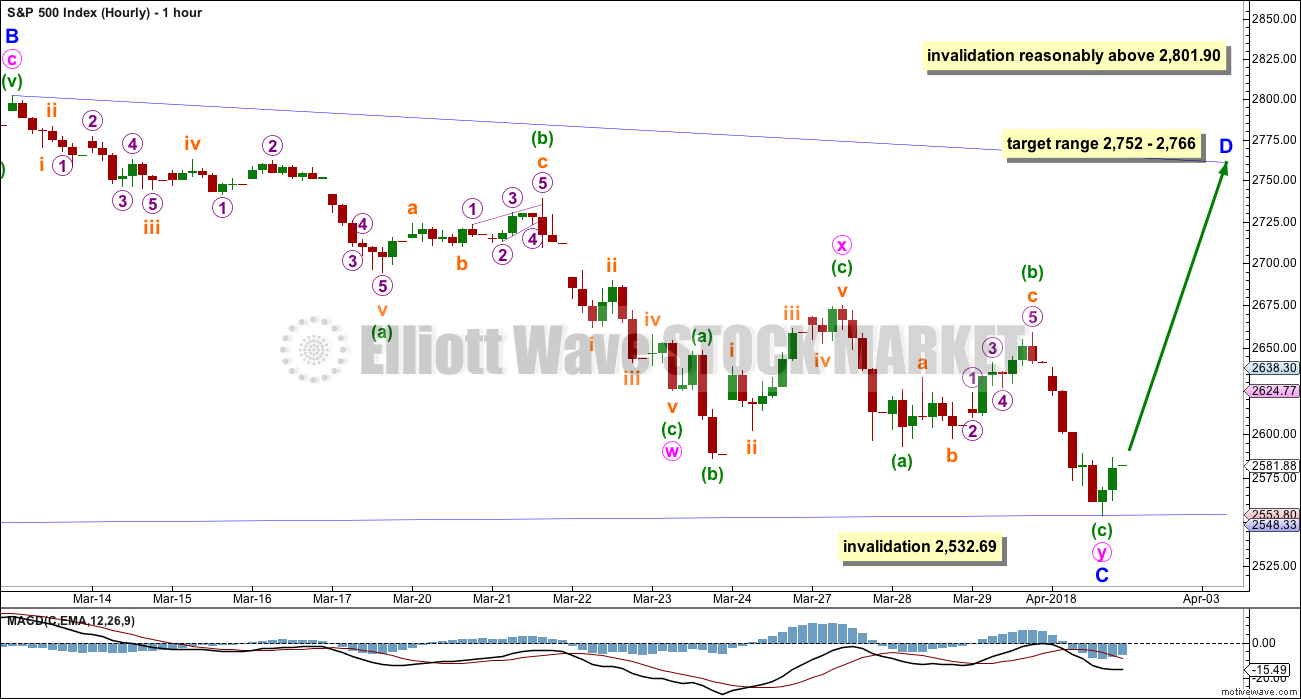
Minor wave C now subdivides well as a double zigzag ending at today’s low.
Triangle sub-waves are commonly from 0.80 to 0.85 the length of the prior sub-wave. This gives an expected range for minor wave D. Minor wave D would be extremely likely to subdivide as a zigzag. When minute waves a and b within it are complete, then a Fibonacci ratio between minute waves a and c may be used to calculate a smaller target for minor wave D to end. That cannot be done yet.
DAILY CHART – COMBINATION
Click chart to enlarge.
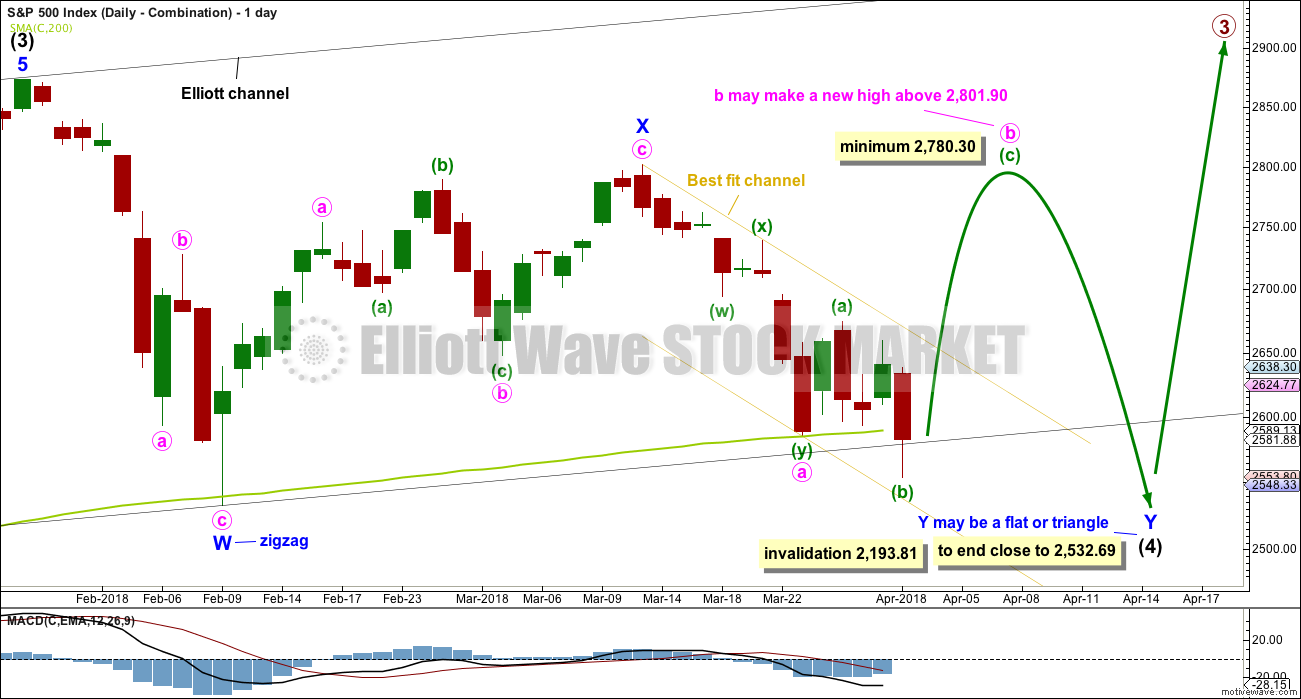
Double combinations are very common structures. The first structure in a possible double combination for intermediate wave (4) would be a complete zigzag labelled minor wave W. The double should be joined by a three in the opposite direction labelled minor wave X, which may be a complete zigzag. X waves within combinations are typically very deep; if minor wave X is over at the last high, then it would be a 0.79 length of minor wave W, which is fairly deep giving it a normal look. There is no minimum nor maximum requirement for X waves within combinations.
The second structure in the double would most likely be a flat correction labelled minor wave Y. It may also be a triangle, but in my experience this is very rare, so it will not be expected. The much more common flat for minor wave Y will be charted and expected.
A flat correction would subdivide 3-3-5. Minute wave a must be a three wave structure, most likely a zigzag. It may also be a double zigzag. On the hourly chart, this is now how this downwards movement fits best, and this will now be how it is labelled.
Minute wave b must now reach a minimum 0.90 length of minute wave a. Minute wave b must be a corrective structure. It may be any corrective structure. It may be unfolding as an expanded flat correction.
The purpose of combinations is to take up time and move price sideways. To achieve this purpose the second structure in the double usually ends close to the same level as the first. Minor wave Y would be expected to end about the same level as minor wave W at 2,532.69. This would require a strong overshoot or breach of the 200 day moving average, which looks unlikely.
DAILY CHART – COMBINATION II
Click chart to enlarge.
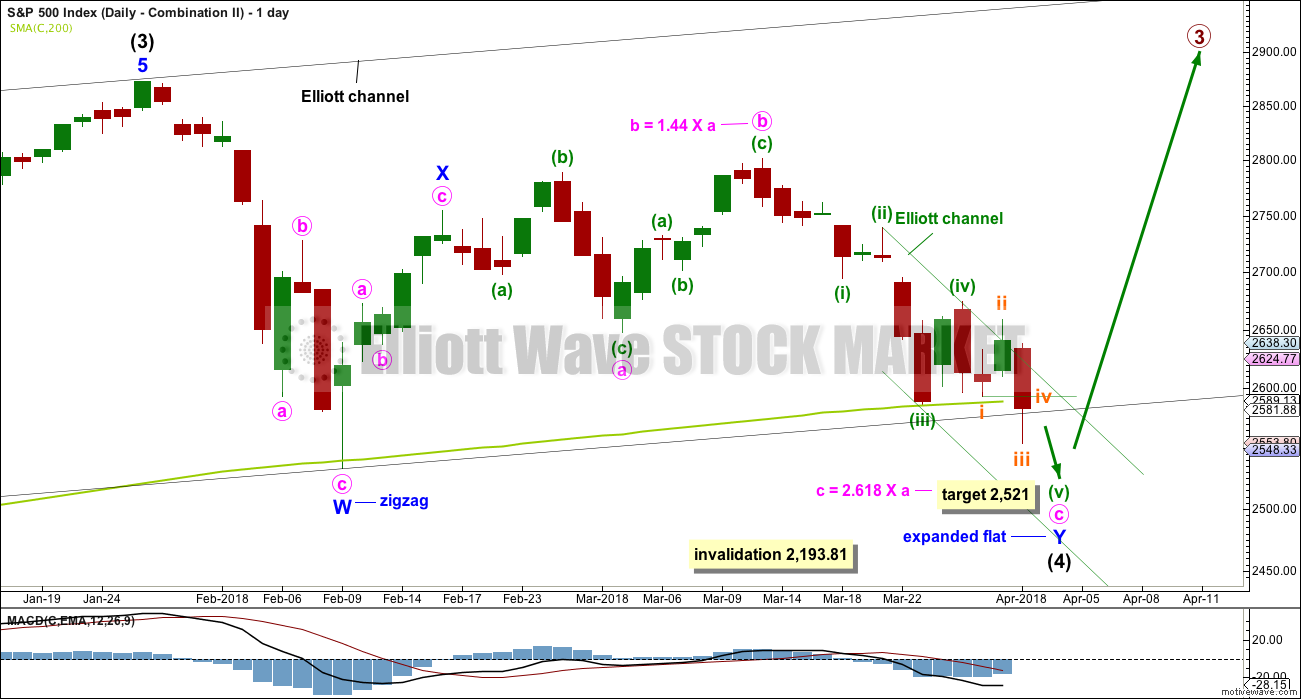
This is another way to label the combination.
Minor wave W is still a zigzag labelled in the same way, over at the first low within intermediate wave (4).
The double is joined by a quick three in the opposite direction labelled minor wave X, subdividing as a zigzag.
Minor wave Y may have begun earlier and may be an almost complete expanded flat correction, and within it minute wave a is a three, itself an expanded flat. Minute wave b is a zigzag and only slightly longer than the most common length of up to 1.38 times the length of minute wave a. Minute wave c downwards must be a five wave structure. It may need a final fifth wave to complete it.
Within minuette wave (v), no second wave correction may move beyond its start above 2,674.78.
The target would see minor wave Y end only slightly below the end of minor wave W. The whole structure for the double combination would move sideways. This wave count would also require a substantial breach of the 200 day moving average (at this point about 68 points). This looks unlikely but is discussed as a possibility in the classic technical analysis section below.
HOURLY CHART – COMBINATION II
Click chart to enlarge.
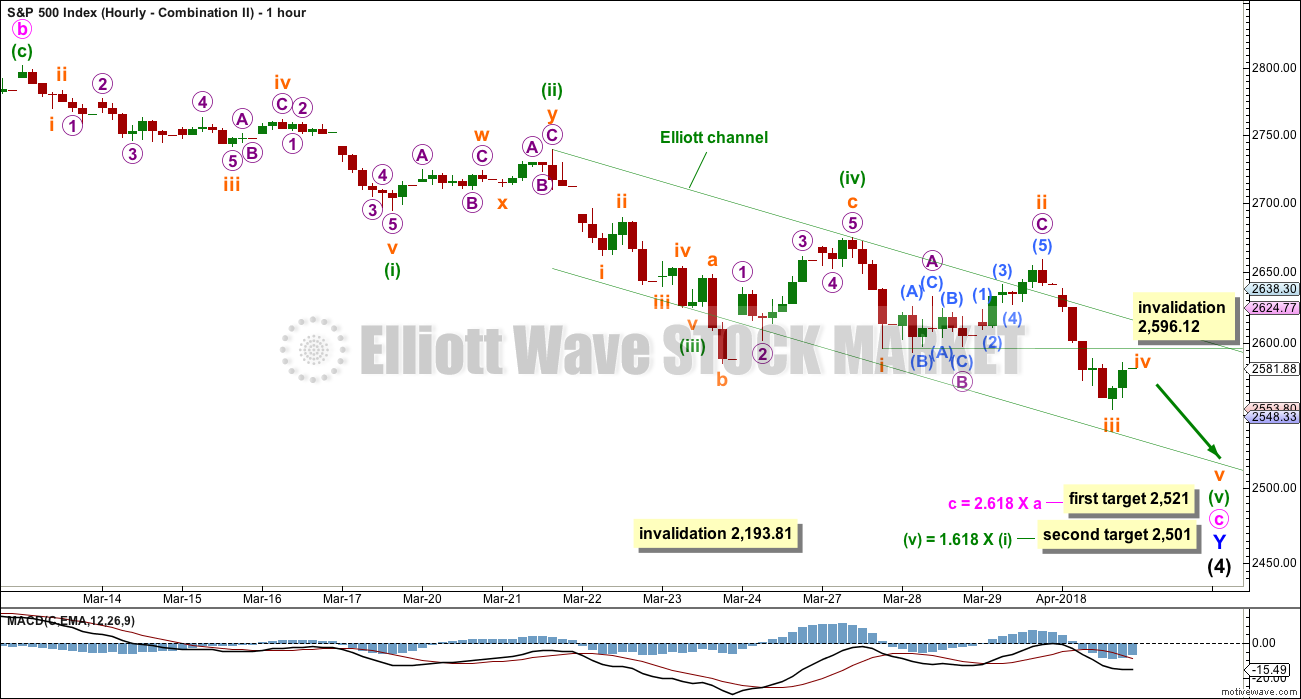
The Elliott channel is drawn using Elliott’s second technique for an impulse. If an impulse downwards is incomplete, then within minuette wave (v) upwards corrections should find strong resistance at the upper edge of the channel. That channel should not be breached.
The fact that the end of Thursday’s session has breached the channel indicates this wave count may be wrong. It has substantially reduced in probability.
Minuette wave (v) must subdivide as a five wave structure. It may be completing lower as an impulse. Within the impulse, subminuette wave iv may not move into subminuette wave i price territory above 2,596.12.
DAILY CHART – FLAT
Click chart to enlarge.
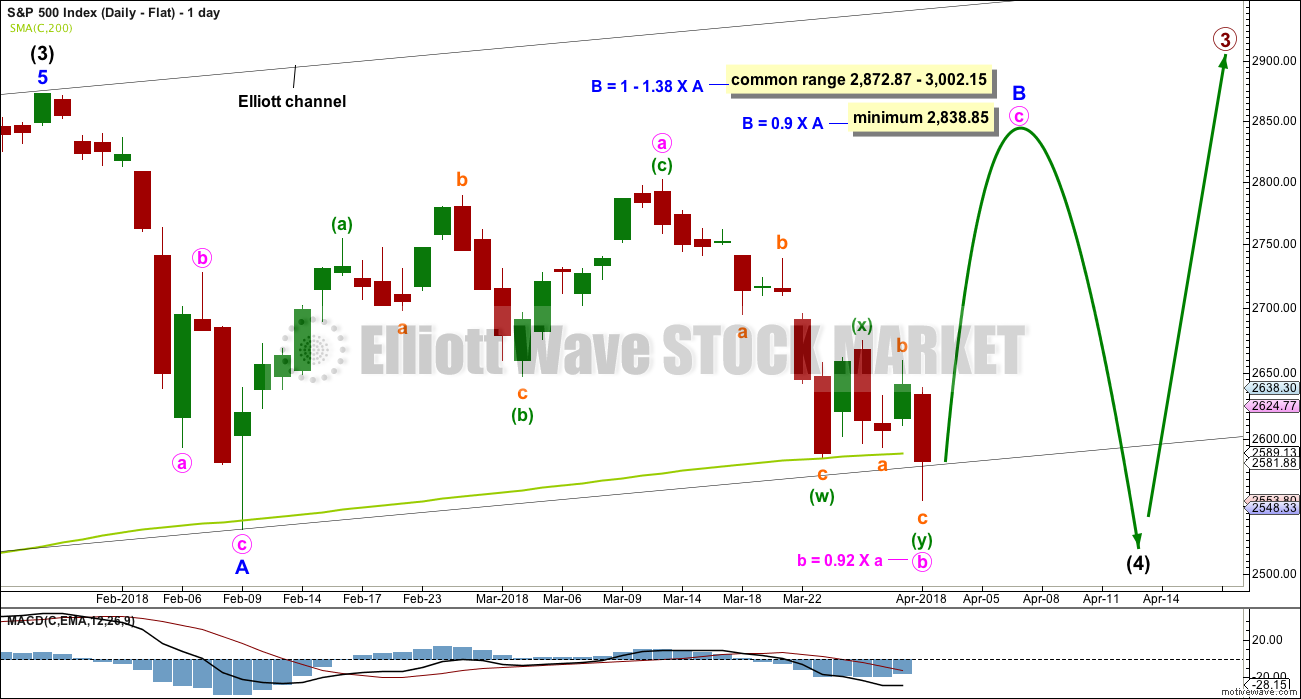
Flat corrections are very common. The most common type of flat is an expanded flat. This would see minor wave B move above the start of minor wave A at 2,872.87.
Within a flat correction, minor wave B must retrace a minimum 0.9 length of minor wave A at 2,838.85. The most common length for minor wave B within a flat correction would be 1 to 1.38 times the length of minor wave A at 2,872.87 to 3,002.15. An expanded flat would see minor wave B 1.05 times the length of minor wave A or longer, at 2,889.89 or above.
Minor wave B is today relabelled. It may be a regular flat correction, and within it minute wave a may have been a single zigzag and minute wave b may have been a double zigzag. This has a very good fit. The subdivisions at the hourly chart level at this stage would be the same for the last wave down as the main wave count.
This wave count would require a very substantial breach of the 200 day moving average for the end of intermediate wave (4). This is possible but may be less likely than a smaller breach.
DAILY CHART – ALTERNATE
Click chart to enlarge.
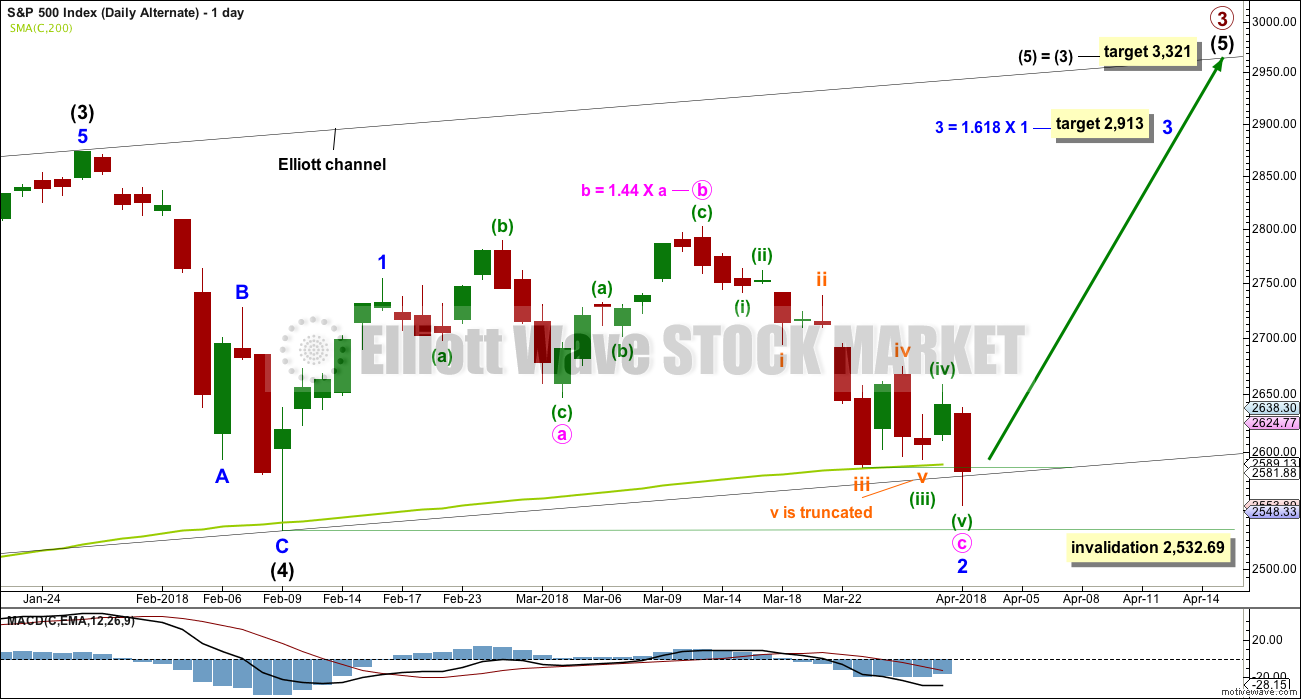
It is possible still that intermediate wave (4) was complete as a relatively brief and shallow single zigzag.
A new all time high with support from volume and any one of a bullish signal from On Balance Volume or the AD line would see this alternate wave count become the main wave count.
The target for minor wave 3 expects the most common Fibonacci ratio to minor wave 1.
Minor wave 2 may have continued lower today. There is a truncation for subminuette wave v to end minuette wave (iii) in order to see minute wave c a complete five wave impulse. This must necessarily reduce the probability of this wave count.
Minor wave 2 may not move beyond the start of minor wave 1 below 2,532.69.
TECHNICAL ANALYSIS
WEEKLY CHART
Click chart to enlarge. Chart courtesy of StockCharts.com.
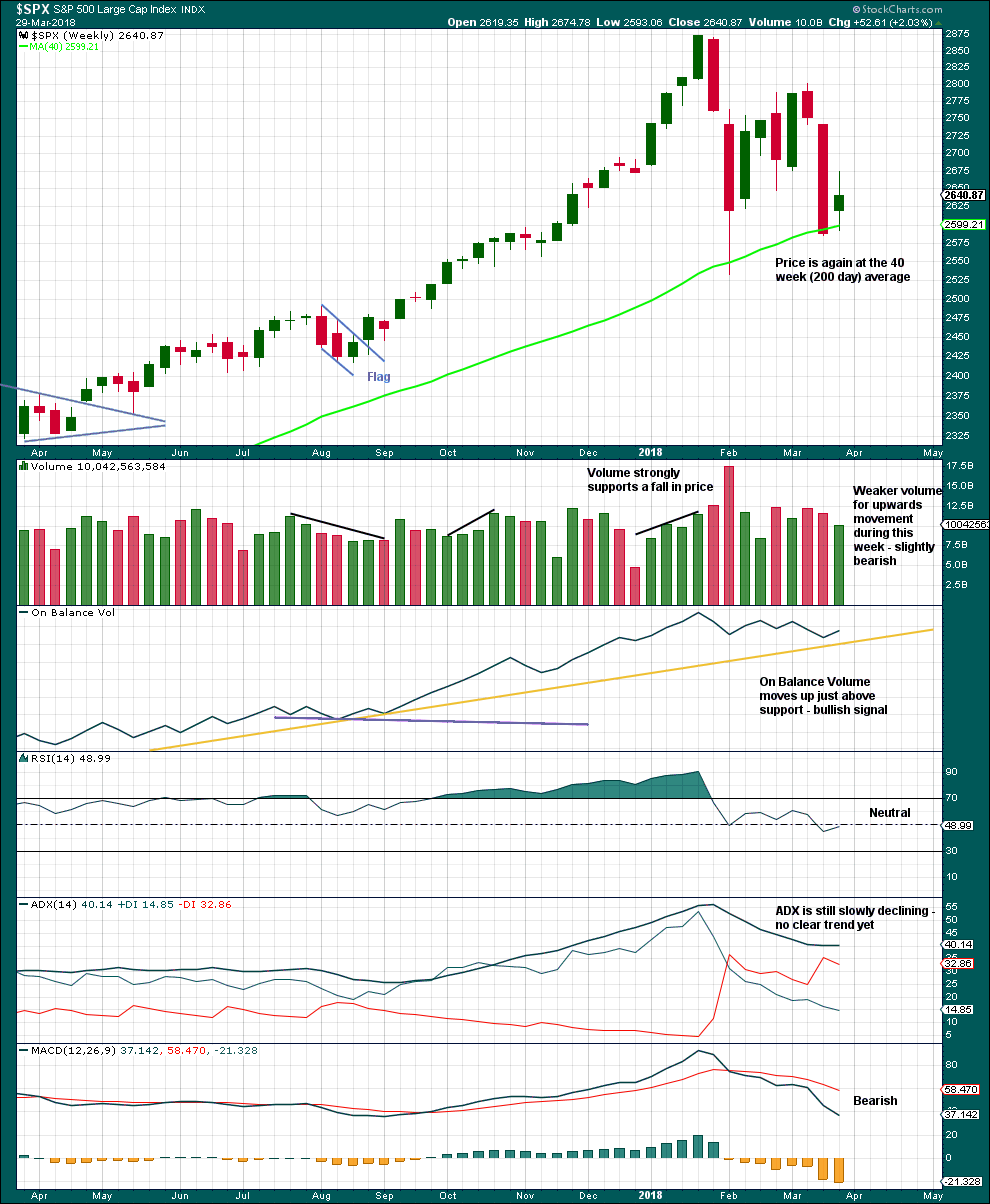
Although volume last week is lighter than last two downwards weeks, this is only of slight concern. Light and declining volume has long been a feature of this bull market. It does not appear to be causing the bull market to be unsustainable, yet.
Give reasonable weight to the bullish signal from On Balance Volume, although it has not perfectly touched the support line.
It is a reasonable approach to expect the 200 day / 40 week moving average to continue to provide strong support while price is above it. Price has overshot the 200 day moving average and has closed below it today. If this current week closes back above the average, then it may be expected that this area continues to provide support.
DAILY CHART
Click chart to enlarge. Chart courtesy of StockCharts.com.
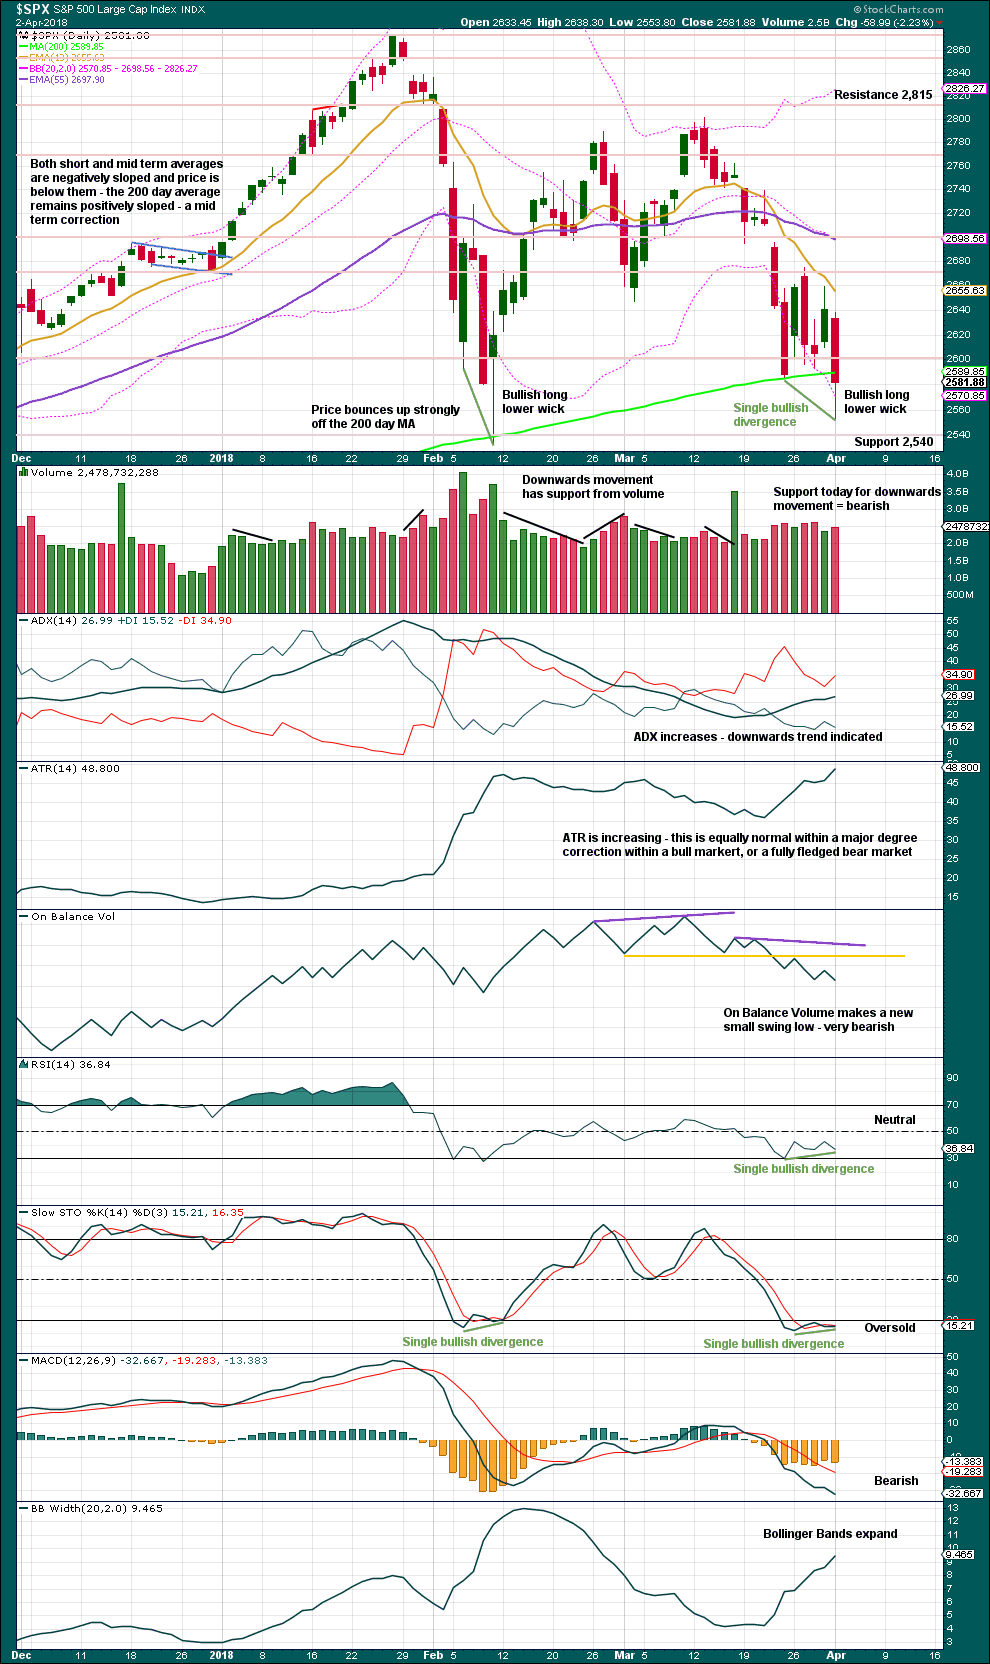
Volume is slightly bearish, but there is less support today for downwards movement than there was last week.
Usually a fairly reliable indicator of a low in place is a long lower candlestick wick along with bullish divergence between price and Stochastics. This is more reliable when Stochastics is oversold, and increasingly reliable when there is divergence with RSI as well. All of these conditions are met today. We may be reasonably confident of a low in place today.
That does not mean we may be 100% confident, only that it is highly likely. There is nothing in technical analysis (including Elliott wave) which is 100% certain. This is an exercise in probability.
VOLATILITY – INVERTED VIX CHART
Click chart to enlarge. Chart courtesy of StockCharts.com.
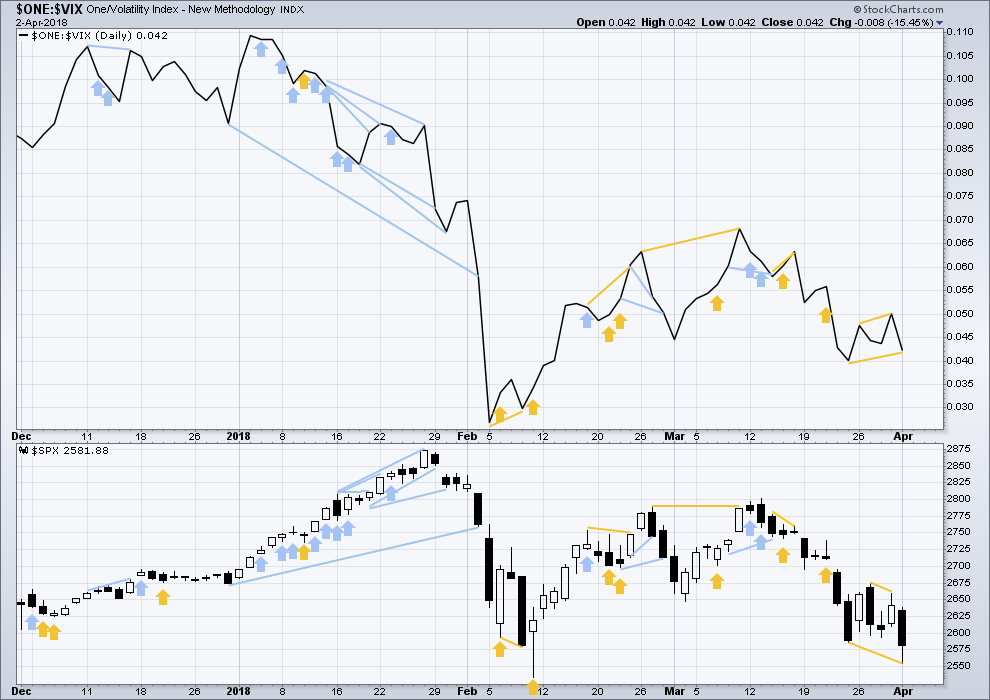
So that colour blind members are included, bearish signals will be noted with blue and bullish signals with yellow.
Normally, volatility should decline as price moves higher and increase as price moves lower. This means that normally inverted VIX should move in the same direction as price.
Price has today made a new small swing low, but inverted VIX has not. Price has not come with a normal corresponding increase in volatility while it moved lower. This divergence is bullish.
BREADTH – AD LINE
Click chart to enlarge. Chart courtesy of StockCharts.com.
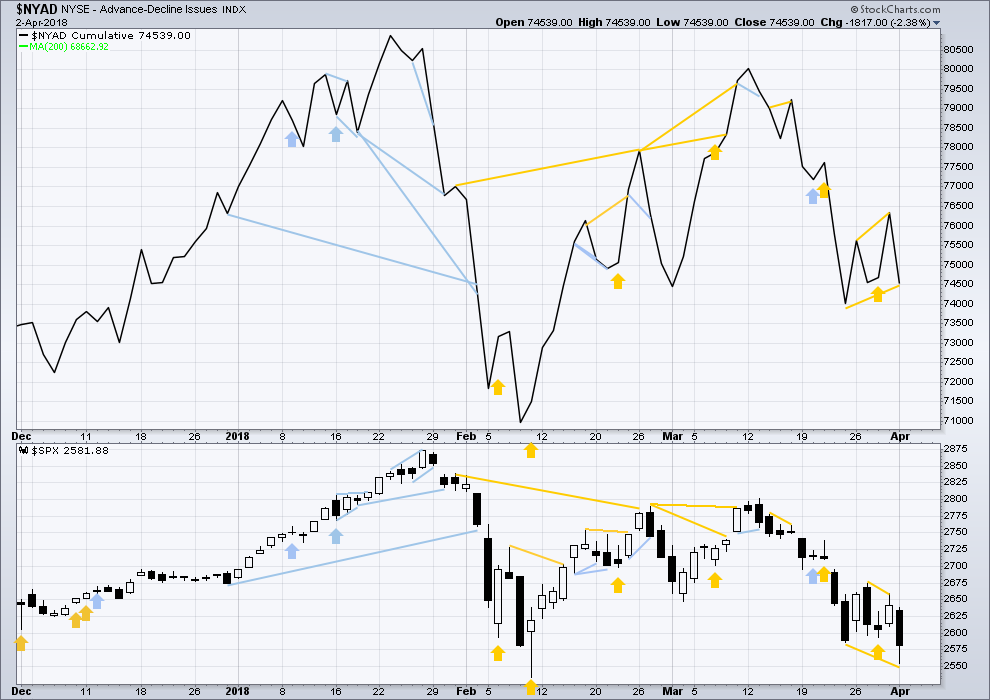
There is normally 4-6 months divergence between price and market breadth prior to a full fledged bear market. This has been so for all major bear markets within the last 90 odd years. With no longer term divergence yet at this point, any decline in price should be expected to be a pullback within an ongoing bull market and not necessarily the start of a bear market.
All of small, mid and large caps last week fell strongly. The fall in price has broad support from market breadth. It was small caps though that had the least decline. This slight divergence indicates some weakness and may be interpreted as slightly bullish.
Breadth should be read as a leading indicator.
Price has today made a new small swing low, but the AD line has not. The downwards movement in price today lacks support from declining market breadth. This divergence is bullish.
DOW THEORY
The following lows need to be exceeded for Dow Theory to confirm the end of the bull market and a change to a bear market:
DJIA: 23,360.29.
DJT: 9,806.79.
S&P500: 2,532.69.
Nasdaq: 6,630.67.
Charts showing each prior major swing low used for Dow Theory are below:
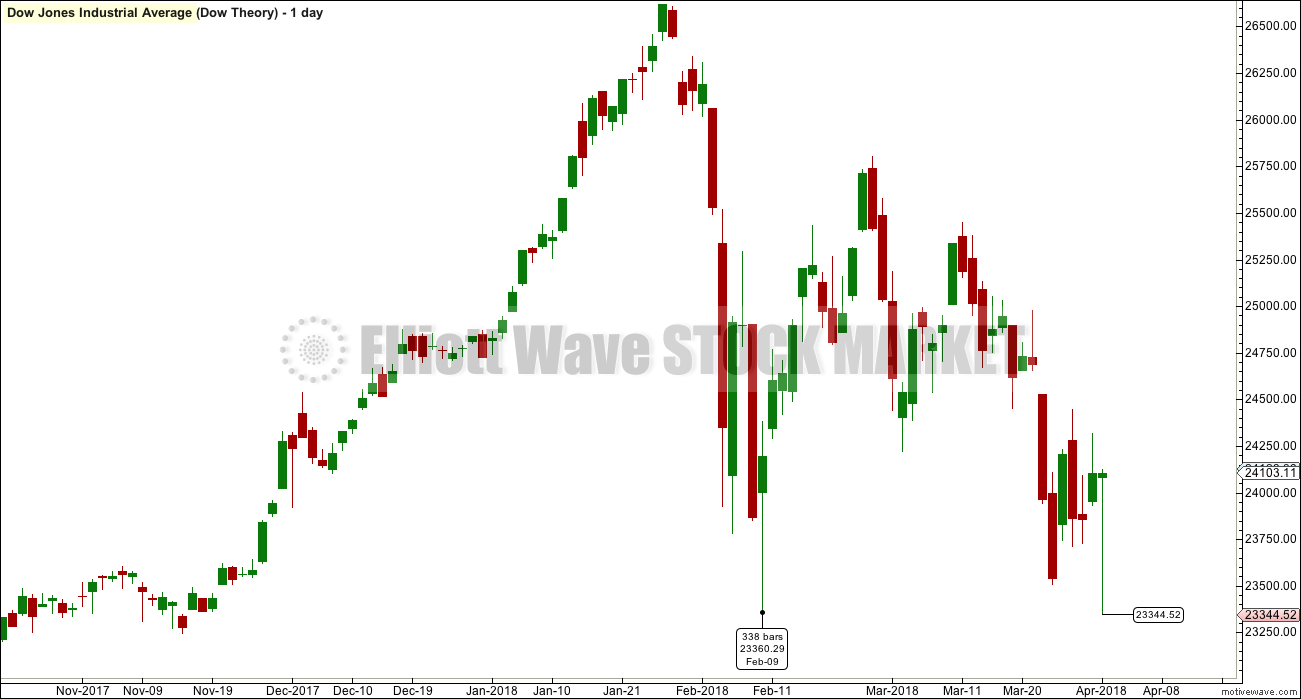
Click chart to enlarge.
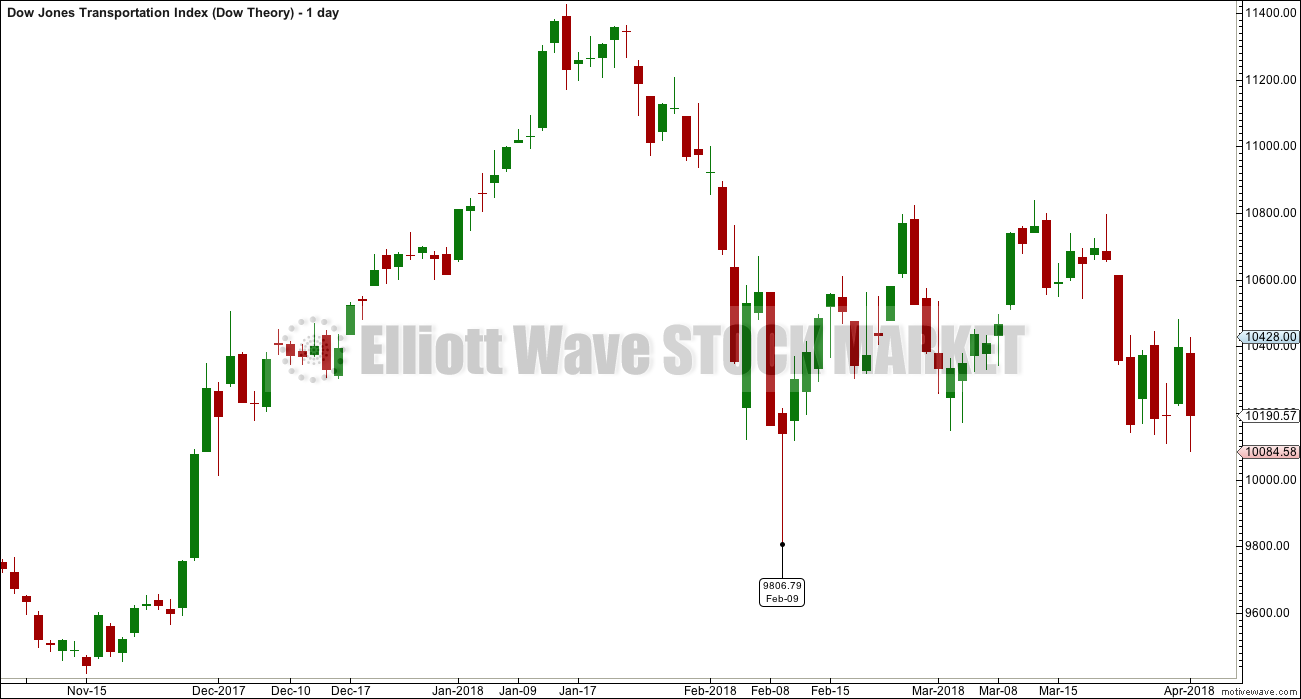
Click chart to enlarge.
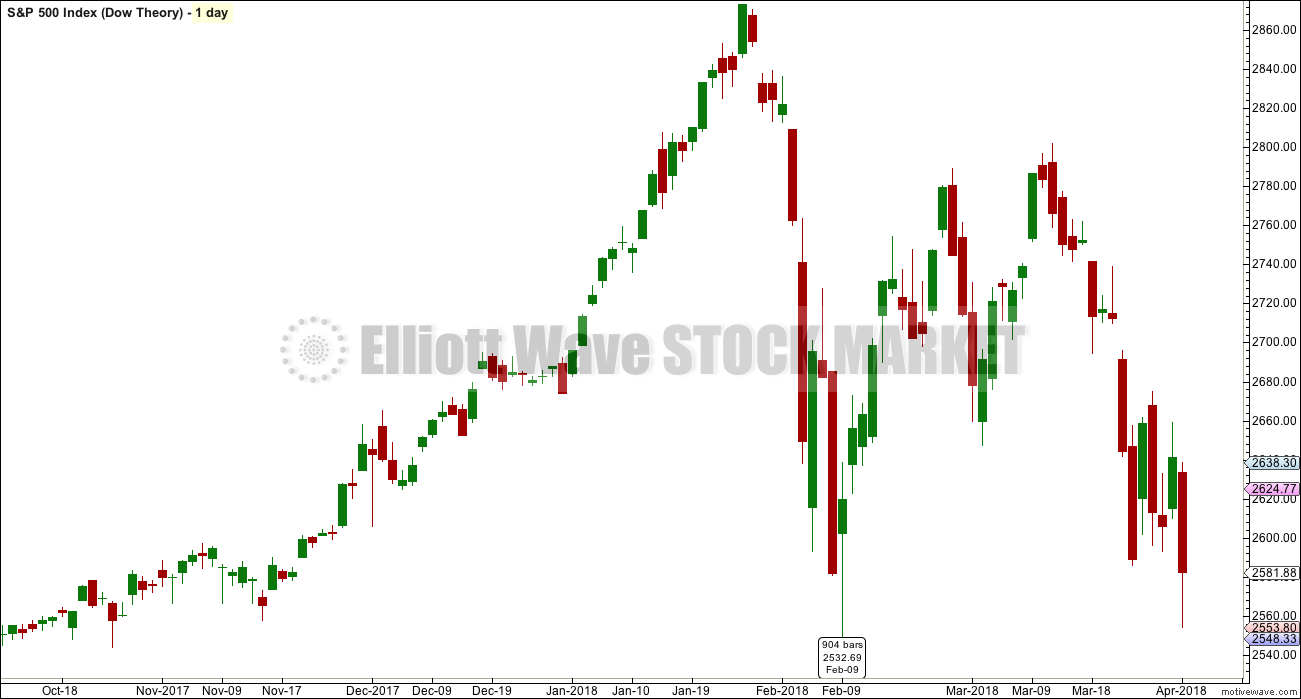
Click chart to enlarge.
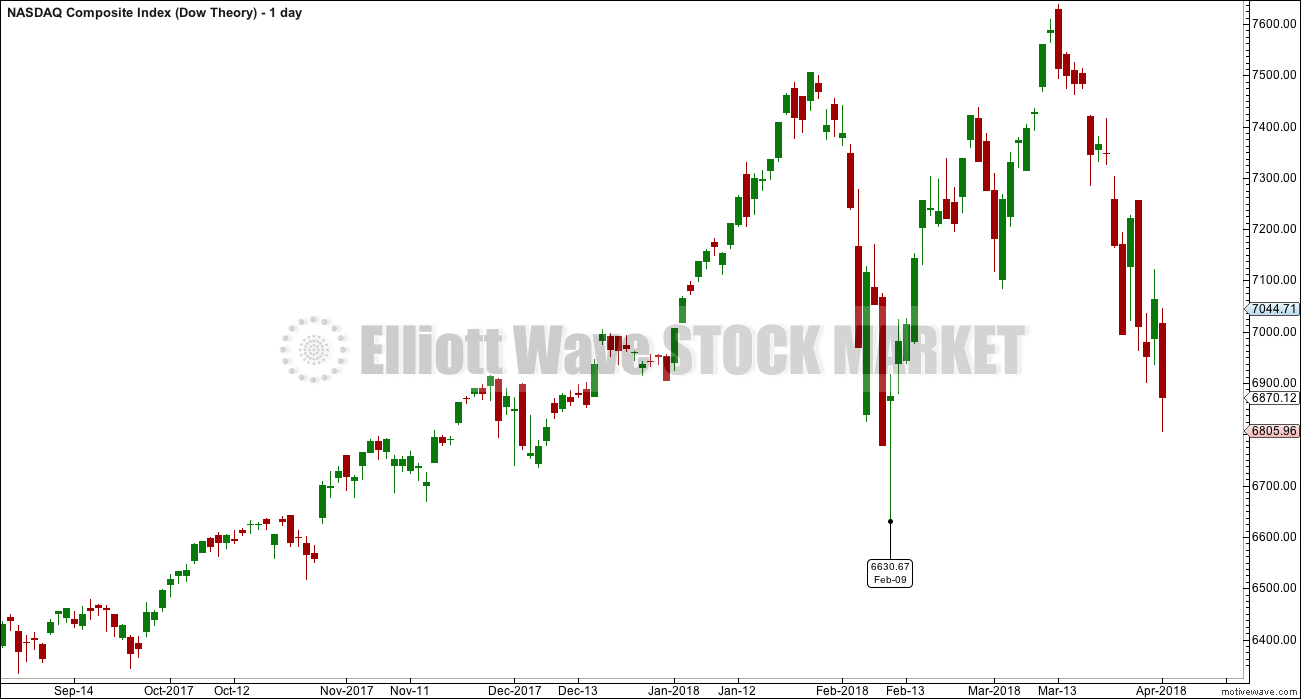
Click chart to enlarge.
Published @ 09:06 p.m. EST.
Hourly chart updated:
This is looking good so far. A green daily candlestick with a long lower wick looks bullish, so far.
Hi Lara
Did i read that correctly if the s & p goes below 2532
and the dow goes below 23360
Thats the end of the Bull Market?
Last week your targets were much lower for the bull market to end.
Thank You
Yes, that is correct. They’re not targets, they’re Dow Theory last major lows.
But for Dow Theory to confirm a switch from bull to bear both DJIA and DJT need to make new lows.
After the February 2018 lows it is now time to review where the last major lows are. And I think it’s those February lows.
The DJIA made a new low yesterday
The dow Jones transports did not make a new low so the theory is NOT confirmed as Lara said above.
Look at her 4 charts above.
And if we want to add in S&P500 and Nasdaq (because technology is an indicator of our modern economy) then my modified or extended Dow Theory requires both of them to also make new lows. And they haven’t yet.
But I’ll go first with the original Dow Theory, just DJIA and DJT.
I went for a long day trip to the mountains today. Intended to stay the night but I forgot it is spring break from public schools for our area. Too many people for my taste. So I came home. Only to discover all the fireworks were on Wall Street. 2450 on the SPX is my enticement to go long point. Otherwise, I am watching the triangle or other Intermediate 4 correction pattern until it completes.
I’ll try again in a week or two for my next visit to Paradise!
Amusing story Rodney….since I myself am outside Bend Oregon, with a task of taking my sister’s two kids skiing for the next several days. Yes, the airport was zoo. I am hoping the slopes of Mt. Bachelor aren’t quite so impacted!! And that the market rises as I slide down on my snowboard….
(Don’t let anyone else know because I have hidden my location from users of this site.) But I am kind of kitty-corner across the state from you in the hamlet of Hermiston. Small small world! My trip was into Washington though and they are on Spring Break for elementary through high school.
Your secret is safe with me!! Meanwhile…I’m rather long this market. Not close to all-in, but a decent size set of positions. Betting this sell-off period is cooked for at least a few days, if not more. Please world, no new craziness for just a few days!!! (unlikely, I know…)
The craziness, I fear, is just beginning…! 🙂
Yesterday, the Fear Greed Indicator hit a low of 7 (extreme fear). Today it is at 8. Just one piece of evidence we may see a bounce, hence the Minor D wave of the triangle Intermediate 4.
That is interesting. McClelland Oscillator and a few other indicators not yet registering extreme oversold readings….
No need to fear, humanity needs a giant kick in the but. Good for long term. So many hypocritical socialists…….
Hi Kevin
I noticed on Lara’s daily updates
She lowered the end of the bull market with the Dow lower then 23360 and the S & P below 2532
Last week her targets were much lower then that for the bull market to end.
Was today a typo or was she not updating that before.
Thank you
I’m with you on the too many people Rodney. The town I live in is a sea side holiday destination and it fills up during summer and long weekends like Easter. I hibernate until the holiday makers go home. It feels overwhelming when I go out amongst them. I’m not used to crowds.
My only comment is that the breaking of the support line that I have drawn (which has held for almost 2 years) is reason for concern that something bigger than an intermediate size correction is taking place. We will know more tomorrow!
If it does end below 600 I hope New Zealand lightens up on its immigration policy 😉
Unlikely with our current coalition government. One party in it is very anti-immigration. It’s tightening. And there’s a growing public distaste here for wealthy foreigners using us as a bolthole. Thanks to Peter Theil.
A most astute observation nxs. The same is true for quite a few long held trend lines of late. Futures indicating the expcted reaction to the 200 day.
How soon will it be faded? Have a great trading day everyone!
If you have not yet tried it, I recommend you learn how:
To make bread, with a credit spread!
They are tailor made for the current trading enironment!
I will post a few examples… 🙂
Interesting chart and nicely done. I’d like to see how you label this going back to the low in 2009. Below is one of my monthly charts. Of course, I invite comments.
Hi Rodney,
I’m trying to sync the historic wave count of the S&P with what is going on since 2000 and I’m wondering if Lara’s bear wave count she has posted in the historical section is now in fact the correct one. If that is the case, then Grand Super Cycle I ended in March 2000 and we finished an A-B-C called Super Cycle (A) in 2009. Since 2009 we should then be in a 3 wave Super Cycle (B) and I think a case can be made that we just finished a 3 wave structure (as you illustrate in your chart).
VERY interesting. I know of only one other person who has charted massive corrective zig zags for the last many years!
Very ominous implications…
First!