
Last analysis expected for the short term a small amount of downwards movement as most likely to end about 2,892.64. A small downwards day with a low at 2,891.73 fits this expectation almost exactly.
Summary: The trend is up. Assume the trend remains the same until proven otherwise.
The last gap may be a breakaway gap, which may offer support at 2,876.16. Gaps can be useful in trading as a place to set stops.
Stops for long positions may be pulled up to just below 2,876.16.
Primary wave 3 may now be over; but, although there is a little support for this possibility from VIX, there is no reasonable bearish signal from the AD line nor On Balance Volume. Expect that price most likely may continue higher with brief shallow corrections along the way up.
The mid to longer term target is now either 2,950 (Elliott wave) or 3,045 (classic analysis). Another multi week to multi month correction is expected at one of these targets.
The final target for this bull market to end remains at 3,616.
Always practice good risk management. Always trade with stops and invest only 1-5% of equity on any one trade.
New updates to this analysis are in bold.
The biggest picture, Grand Super Cycle analysis, is here.
Last historic analysis with monthly charts is here, video is here.
ELLIOTT WAVE COUNT
WEEKLY CHART
Click chart to enlarge.
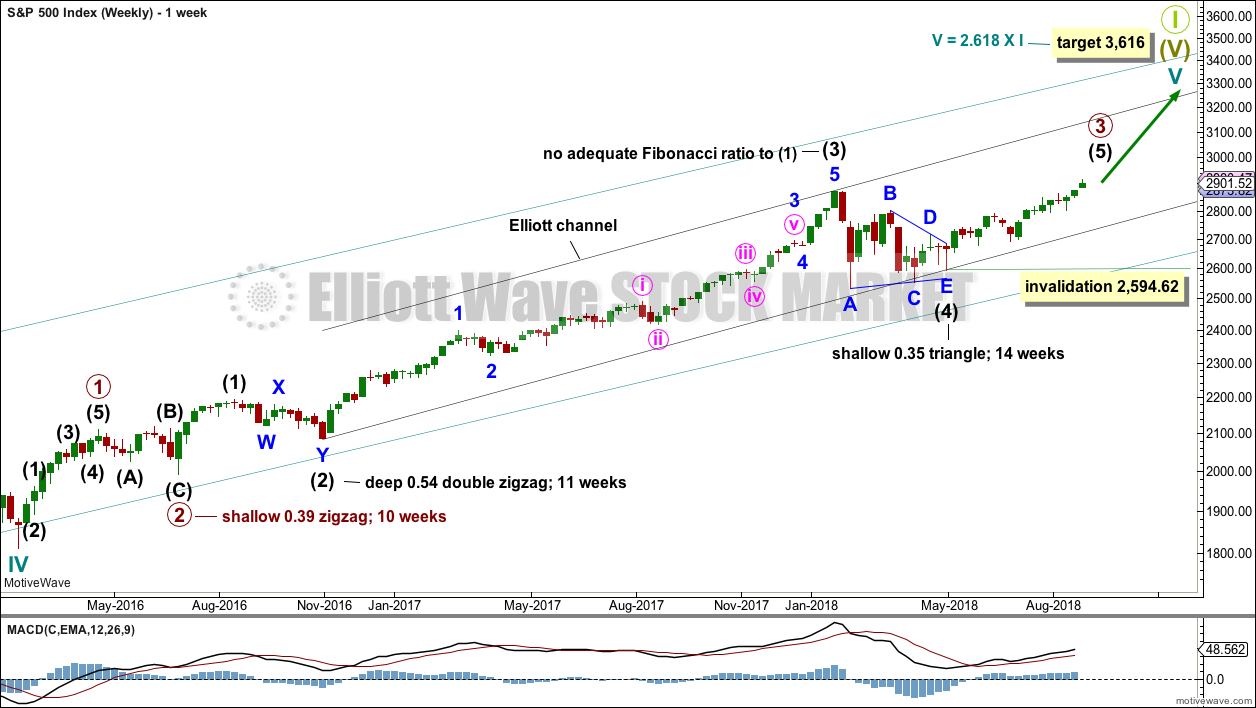
Cycle wave V must complete as a five structure, which should look clear at the weekly chart level and also now at the monthly chart level. It may only be an impulse or ending diagonal. At this stage, it is clear it is an impulse.
Within cycle wave V, the third waves at all degrees may only subdivide as impulses.
Intermediate wave (4) has breached an Elliott channel drawn using Elliott’s first technique. The channel is redrawn using Elliott’s second technique: the first trend line from the ends of intermediate waves (2) to (4), then a parallel copy on the end of intermediate wave (3). Intermediate wave (5) may end either midway within the channel, or about the upper edge.
There is perfect alternation and excellent proportion between intermediate waves (2) and (4).
Within intermediate wave (5), no second wave correction may move beyond the start of its first wave below 2,594.62. However, the lower edge of the black Elliott channel drawn across the ends of intermediate degree waves should provide very strong support for any deeper pullbacks, holding price well above the invalidation point while intermediate wave (5) unfolds.
At this stage, the expectation is for the final target to me met in October 2019. If price gets up to this target and either the structure is incomplete or price keeps rising through it, then a new higher target would be calculated.
A multi week to multi month consolidation for primary wave 4 is expected on the way up to the final target. This large correction may now be fairly close by in terms of time; classic analysis will be watched carefully to identify early warning signs of its approach.
The last bullish fifth wave of minor wave 5 to end intermediate wave (3) exhibited commodity like behaviour. It was strong and sustained. It is possible that minor wave 5 to end intermediate wave (5) to end primary wave 3 may exhibit similar behaviour, so we should be on the lookout for this possibility. This may be beginning to happen now.
DAILY CHART
Click chart to enlarge.
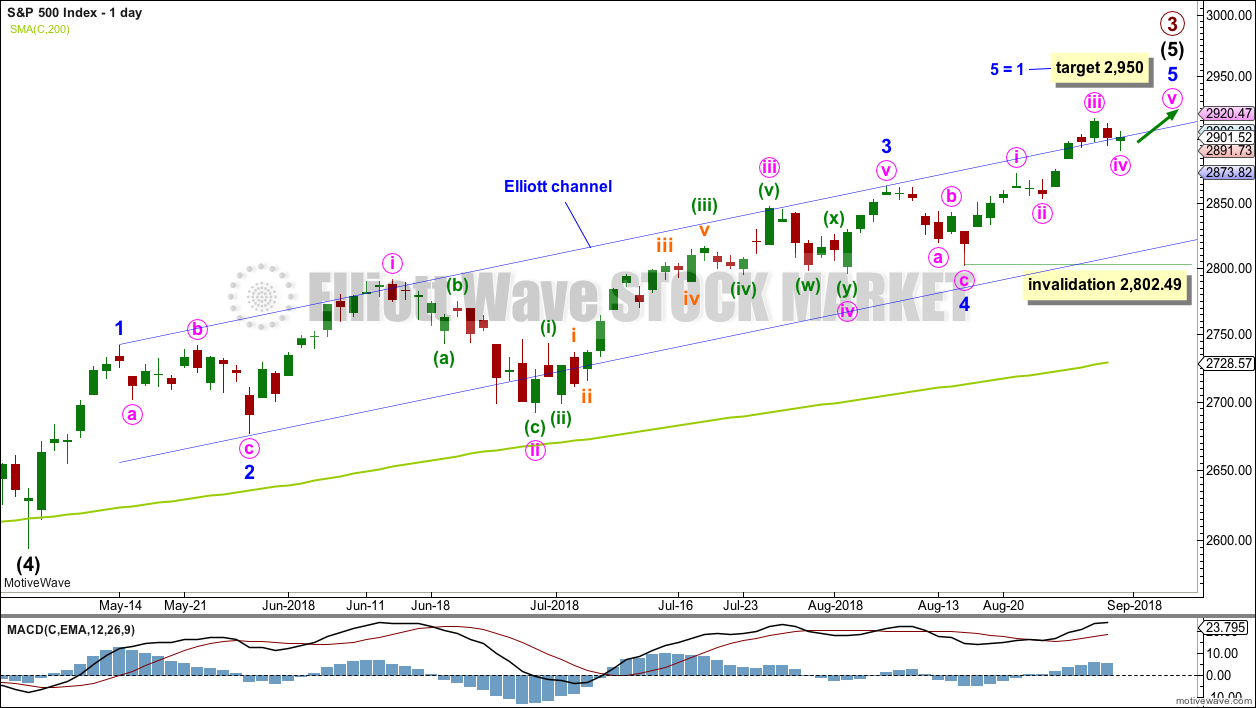
Intermediate wave (5) avoided a truncation now that it has a slight new high above the end of intermediate wave (3) at 2,872.87.
Intermediate wave (3) exhibits no Fibonacci ratio to intermediate wave (1). It is more likely then that intermediate wave (5) may exhibit a Fibonacci ratio to either of intermediate waves (1) or (3). Intermediate wave (5) has passed equality in length with intermediate wave (1). The next target was at 1.618 the length of intermediate wave (1), which may have been almost met.
Intermediate wave (5) is unfolding as an impulse, and within it minor waves 1 through to 4 may now all be complete.
The channel is drawn about intermediate wave (5) using Elliott’s first technique. Price has closed above the upper edge.
Minor wave 5 is developing some commodity like behaviour.
Assume the upwards trend remains intact while price remains above 2,802.49. The trend remains the same until proven otherwise.
It is possible that primary wave 3 was over at this week’s high and primary wave 4 has just begun. However, a new low below 2,802.49 is required for any confidence whatsoever in this view.
HOURLY CHART
Click chart to enlarge.
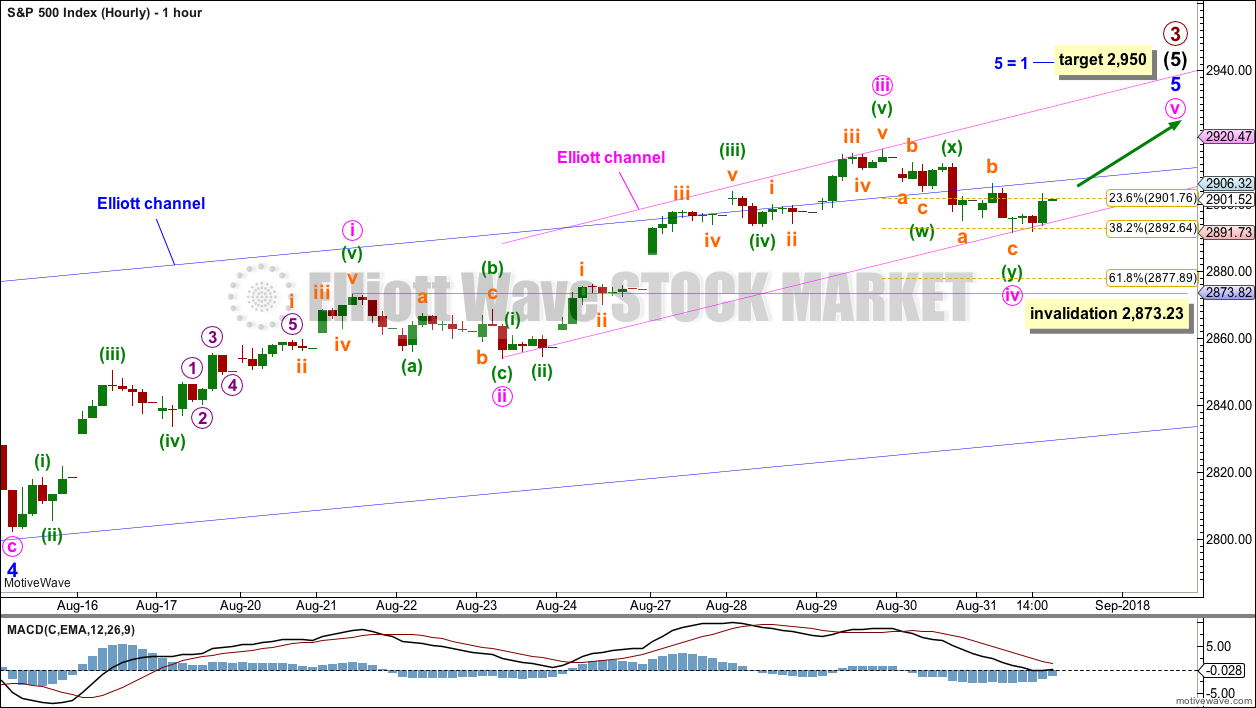
Minor wave 5 may unfold as either an impulse or an ending diagonal. An impulse is more likely.
Minute waves i through to iv may be complete.
Minute wave ii was a 0.27 shallow single zigzag. Minute wave iv may have completed as a relatively shallow double zigzag. There is very little alternation between minute waves ii and iv, but alternation is a guideline and not a rule, and is not always seen. There is good proportion if minute wave iv is over at Friday’s low.
Minute wave iv may not move into minute wave i price territory below 2,873.23.
ALTERNATE HOURLY CHART
Click chart to enlarge.
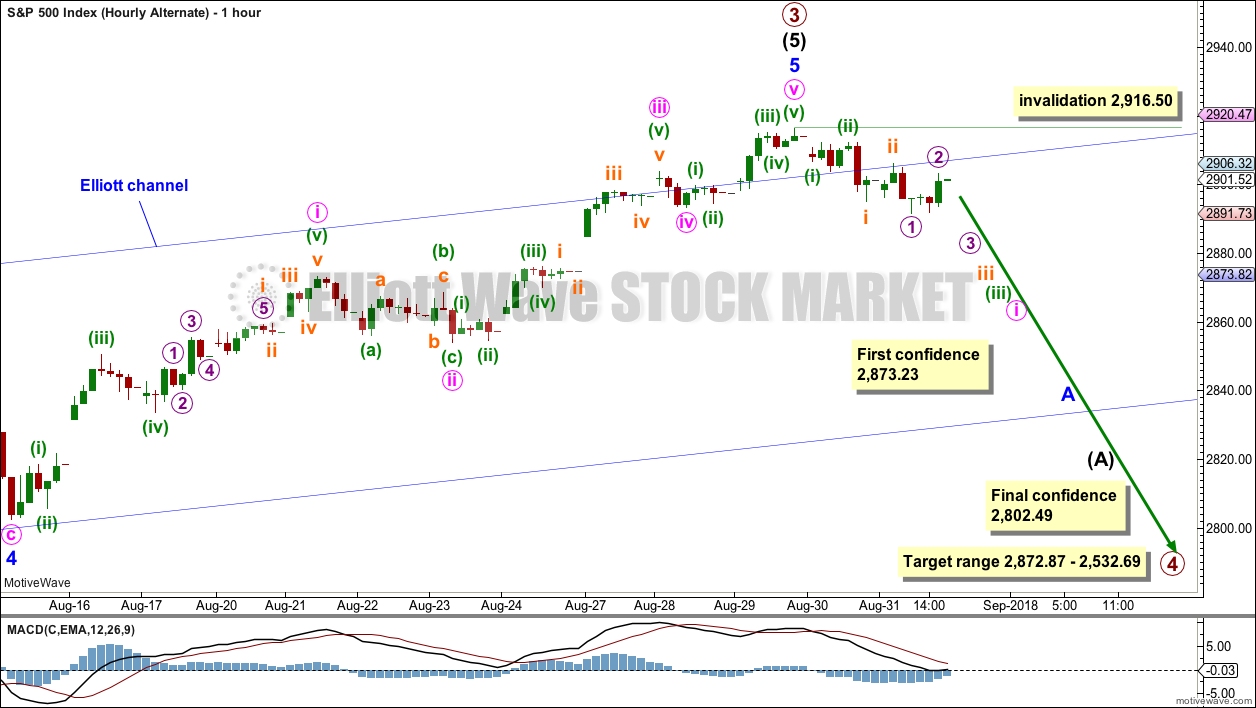
It is possible that primary wave 3 could be over. There is a little support at the end of this week from classic analysis for this wave count but not yet enough for any confidence.
This wave count is published for members as only an outside possibility to consider, and to provide a road map if this low probability outcome does occur.
If primary wave 3 is over, then within it intermediate wave (5) would be just 5.16 points short of 1.618 the length of intermediate wave (1).
If price makes a new low by any amount at any time frame below the first confidence point, then this wave count would slightly increase in probability. A new low below the second confidence point would be required for any reasonable confidence in this wave count.
At that stage, a multi month consolidation for primary wave 4 would be expected. Primary wave 4 may end within the price territory of the fourth wave of one lesser degree: intermediate wave (4) has its range from 2,872.87 to 2,532.69. Within this range sit the 0.236 and 0.382 Fibonacci ratios of primary wave 3: at 2,698.24 and 2,563.22. These would both be reasonable targets for primary wave 4, with the 0.236 Fibonacci ratio slightly favoured as it would see primary wave 4 sit better within an Elliott channel.
Within primary wave 4, downwards waves may be swift and very strong.
Primary wave 4 may not move into primary wave 1 price territory below 2,111.05.
TECHNICAL ANALYSIS
WEEKLY CHART
Click chart to enlarge. Chart courtesy of StockCharts.com.
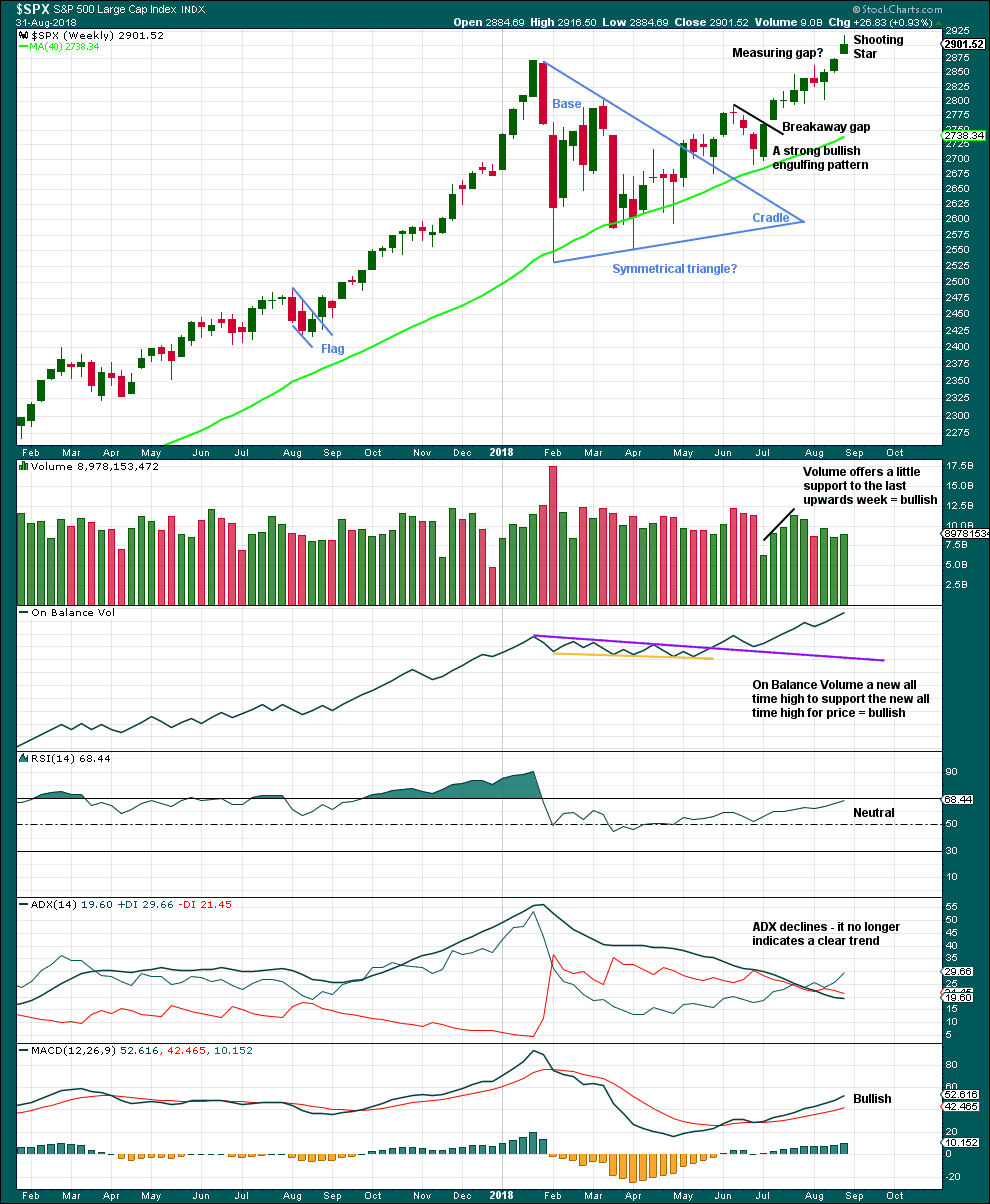
The symmetrical triangle may now be complete. The base distance is 340.18. Added to the breakout point of 2,704.54 this gives a target at 3,044.72. This is above the Elliott wave target at 2,950, so the Elliott wave target may be inadequate.
A new all time high for price has support from another new all time high from On Balance Volume at the weekly chart level. This is bullish.
Price can rise in current market conditions on light and declining volume for a reasonable period of time, so lighter volume last week does not mean that the rise in price is unsustainable for the short or mid term.
Another upwards gap this week may be a measuring gap; it should be assumed to be so until proven otherwise. While this gap remains open, it may be useful in calculating a new short term target at 2,992. If this gap is closed, it may then be considered an exhaustion gap, and that may be taken as a signal that primary wave 4 may have arrived.
This weekly candlestick closes as a Shooting Star. From Steve Nison CMT in “Japanese Candlestick Charting Techniques”, page 74:
“The Japanese aptly say that the shooting star shows trouble overhead. Since it is one session, it is usually not a major reversal signal as is the bearish engulfing pattern or evening star. Nor do I view the shooting star as pivotal resistance as I do with the two previously mentioned patterns.”
This weekly candlestick is a small warning; it may not be read as a reversal signal.
DAILY CHART
Click chart to enlarge. Chart courtesy of StockCharts.com.
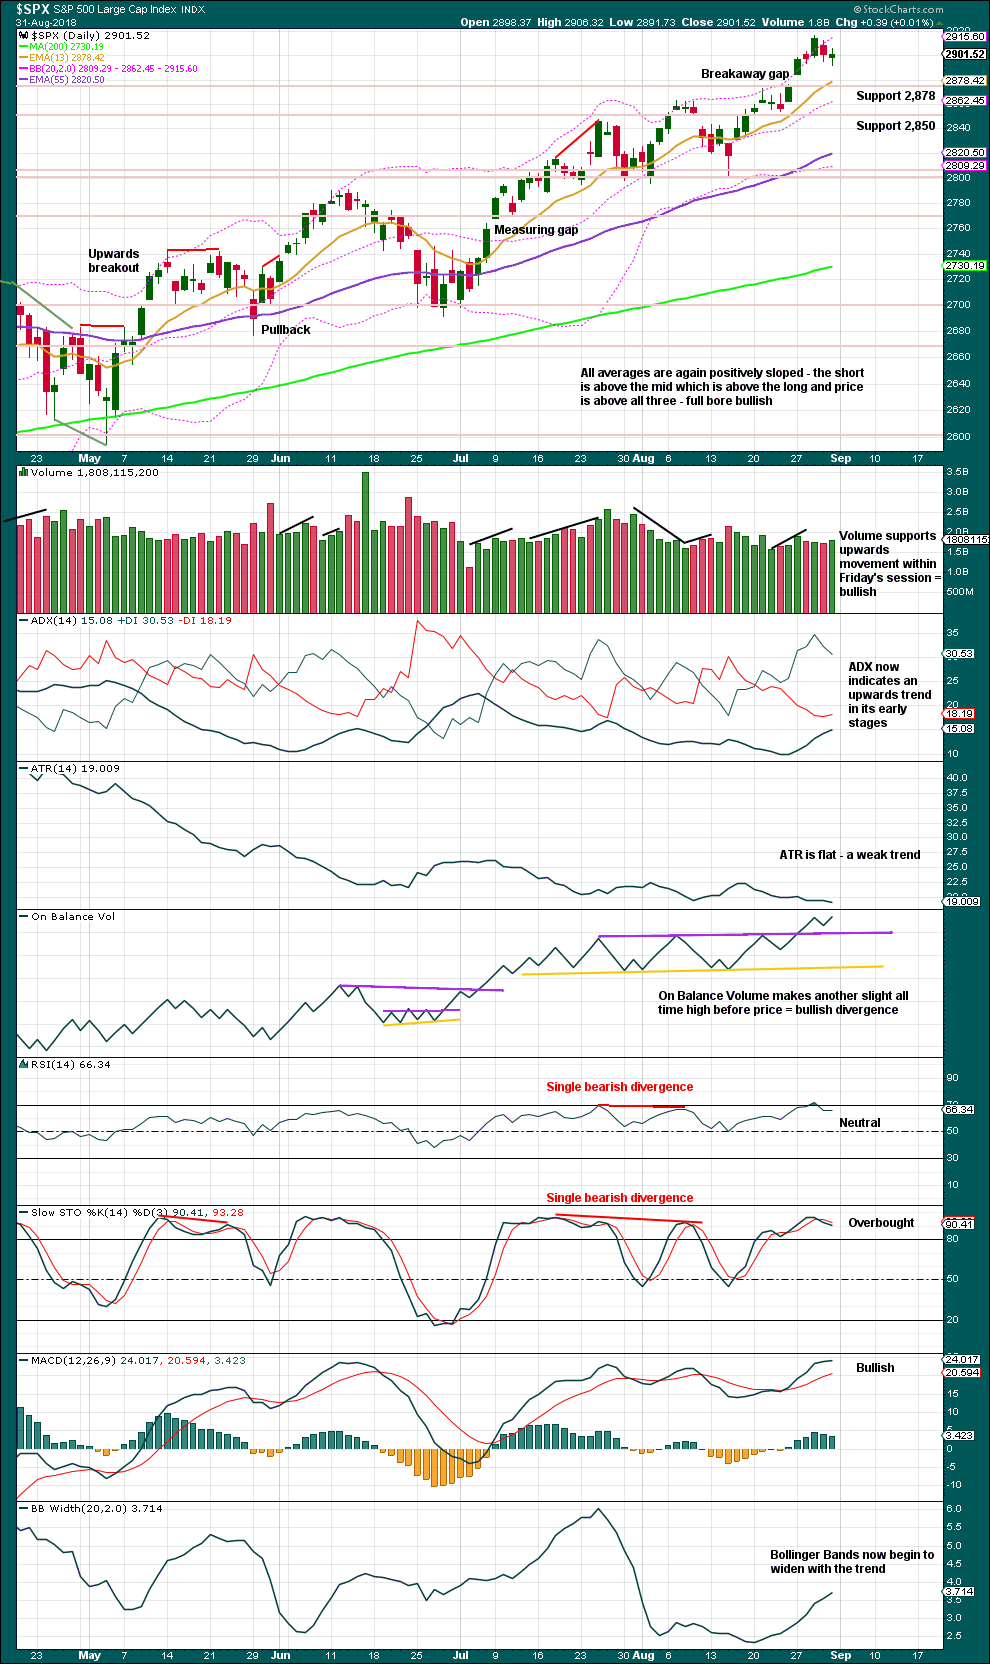
Since the low on the 2nd of April, 2018, price has made a series of higher highs and higher lows. This is the definition of an upwards trend. But trends do not move in perfectly straight lines; there are pullbacks and bounces along the way.
Breakaway and measuring gaps can be useful in trading: stops may be adjusted using these gaps. If the last gap is closed, then it would not be a breakaway gap but would then correctly be an exhaustion gap, so a reasonable correction would be expected and long positions should then be closed. If the last gap is closed, that may be taken as a signal that primary wave 3 may be over and primary wave 4 may have arrived.
Current market conditions with price rising on declining volume and low ATR may be sustained even while upwards momentum increases. This has happened before; most recently up to the high of the 26th of January, so it may happen again.
The trend is up, and it looks like it is strengthening. ADX has now indicated an upwards trend; when rising from low levels and coming up from both directional lines, this is the strongest signal ADX can give.
RSI can reach further into overbought when the S&P has a strong trend. Stochastics may remain overbought for a reasonable period of time.
At this stage, there is no candlestick reversal pattern to support the idea of primary wave 4 arriving, but it must be noted that on the daily chart intermediate wave (4) was not heralded by a candlestick reversal pattern.
Friday’s session moved price lower, but the balance of volume was upwards and the candlestick has closed green. Upwards movement within Friday’s session has support from rising volume.
VOLATILITY – INVERTED VIX CHART
WEEKLY CHART
Click chart to enlarge. Chart courtesy of StockCharts.com. So that colour blind members are included, bearish signals
will be noted with blue and bullish signals with yellow.
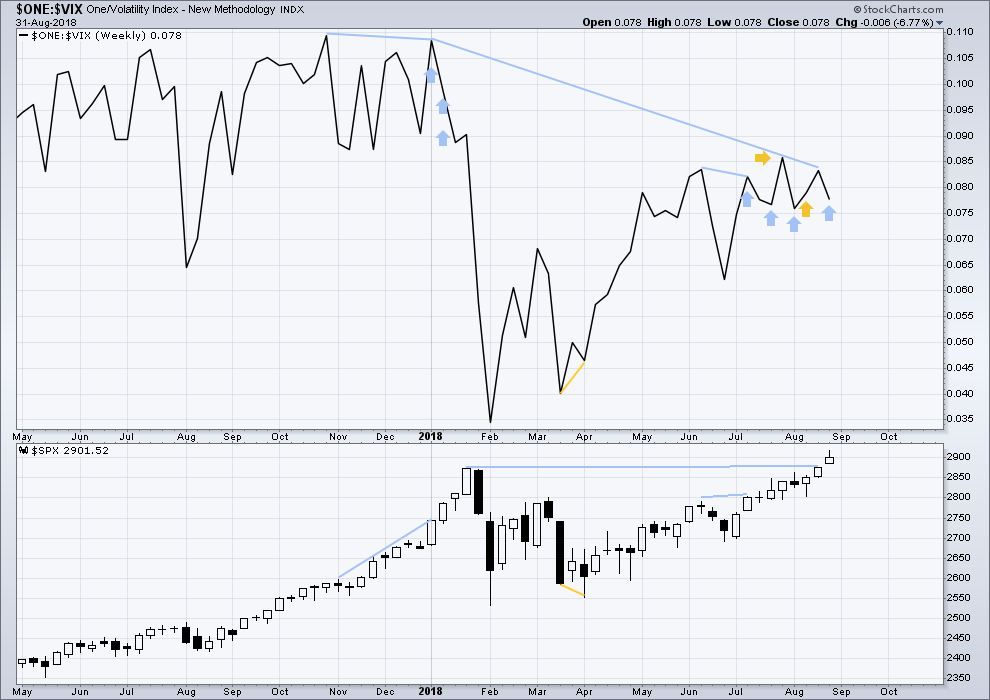
To keep an eye on the all time high for inverted VIX a weekly chart is required at this time.
Notice how inverted VIX has very strong bearish signals four weeks in a row just before the start of the last large fall in price. At the weekly chart level, this indicator may be useful again in warning of the end of primary wave 3.
At this time, there is mid term bearish divergence between price and inverted VIX: price has made a new all time high, but inverted VIX has not. This divergence may persist for some time and may remain at the end of primary wave 3.
There is single and weak short term bearish divergence between price and inverted VIX: this week price moved higher, but inverted VIX moved lower. Price has not come with a normal corresponding decline in market volatility although it has made new all time highs this week; volatility has increased. This may be an early warning that primary wave 4 could begin here or fairly soon. It is possible that more instances of weekly divergence may yet develop before primary wave 4 begins.
DAILY CHART
Click chart to enlarge. Chart courtesy of StockCharts.com. So that colour blind members are included, bearish signals
will be noted with blue and bullish signals with yellow.
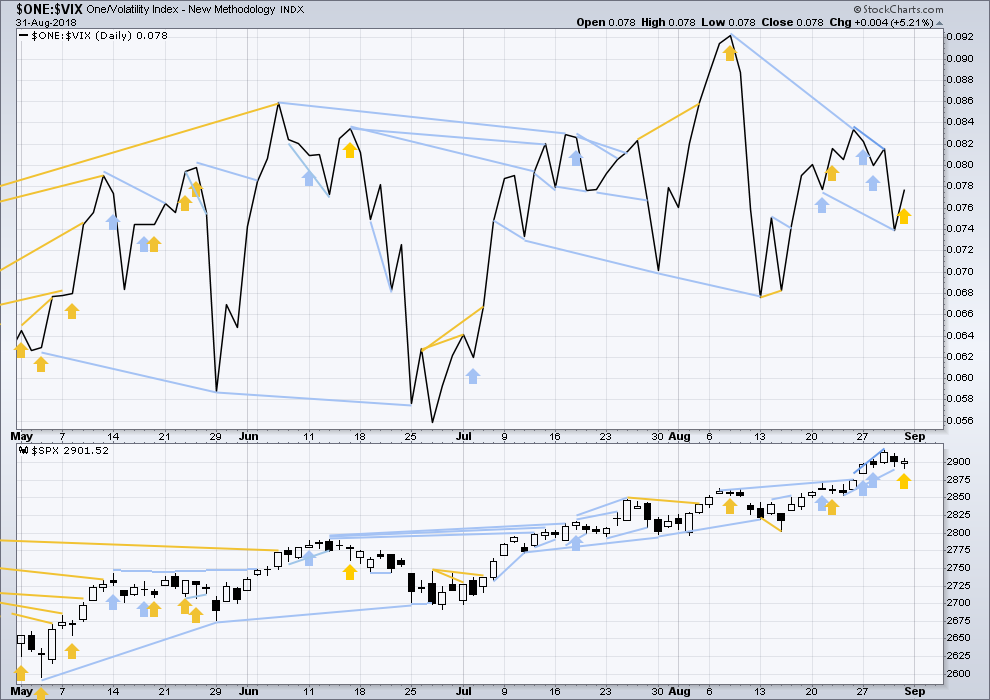
Normally, volatility should decline as price moves higher and increase as price moves lower. This means that normally inverted VIX should move in the same direction as price.
There is mid term divergence with a new all time high from price not supported by a corresponding new all time high from inverted VIX. This divergence is bearish.
Inverted VIX has made a new low below the low six sessions prior, but price has not. This divergence is bearish and strong. However, it is also possible that this is only an early warning and that further bearish divergence may develop before primary wave 4 begins; inverted VIX may not be very useful as a timing tool, only a warning.
There is now a small cluster of bearish signals from inverted VIX, which offer a very small support to the idea that primary wave 4 may begin here or very soon.
Friday’s session saw price move lower, but inverted VIX move higher. This divergence is bullish and supports the idea of new all time highs early next week.
BREADTH – AD LINE
WEEKLY CHART
Click chart to enlarge. Chart courtesy of StockCharts.com.
When primary wave 3 comes to an end, it may be valuable to watch the AD line at the weekly time frame as well as the daily.
The AD line and price both moved higher to new all time highs this week; there is no divergence. The rise in price has support from rising market breadth. This is bullish.
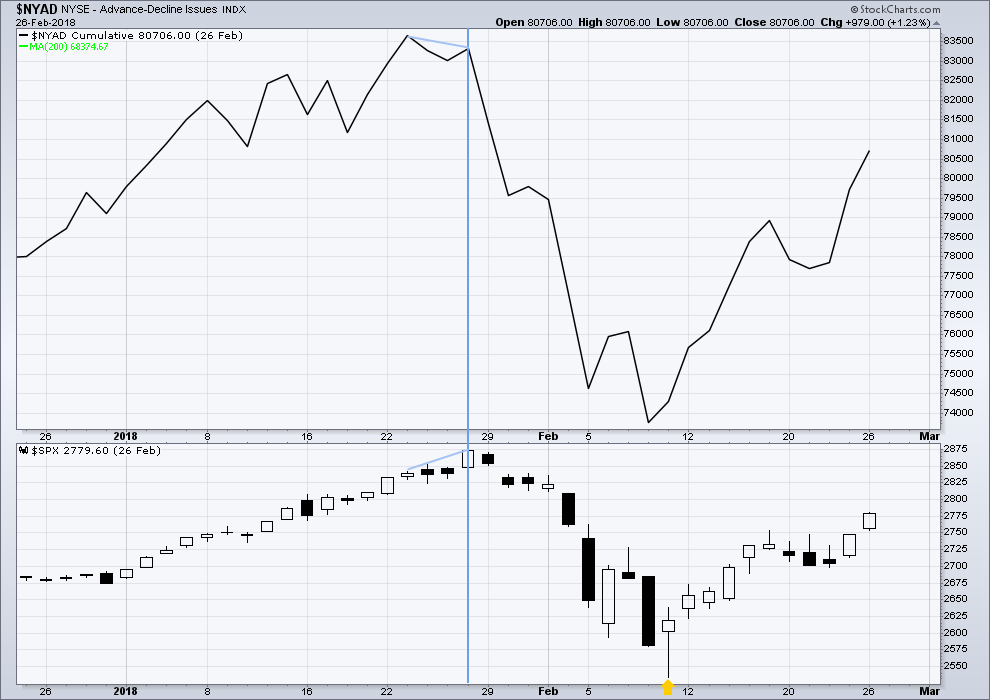
DAILY CHART
Click chart to enlarge. Chart courtesy of StockCharts.com.
There is normally 4-6 months divergence between price and market breadth prior to a full fledged bear market. This has been so for all major bear markets within the last 90 odd years. With no longer term divergence yet at this point, any decline in price should be expected to be a pullback within an ongoing bull market and not necessarily the start of a bear market. New all time highs from the AD line means that any bear market may now be an absolute minimum of 4 months away. It may of course be a lot longer than that. My next expectation for the end of this bull market may now be October 2019.
Breadth should be read as a leading indicator.
Very weak bearish divergence noted in last analysis has now been followed by a very little downwards movement. It may now be resolved.
Friday’s session saw price moved slightly lower and the AD line move slightly higher. This is short term bullish divergence.
All of small, mid and large caps made new all time highs on the 27th of August. There is a little divergence here in breadth with large caps continuing to make new all time highs on the 29th of August and small and mid caps lagging.
DOW THEORY
The following lows need to be exceeded for Dow Theory to confirm the end of the bull market and a change to a bear market:
DJIA: 23,360.29.
DJT: 9,806.79.
S&P500: 2,532.69.
Nasdaq: 6,630.67.
Nasdaq and DJT and now the S&P500 have all made recent new all time highs. For Dow Theory confirmation of the ongoing bull market, DJIA needs to make a new all time high.
Charts showing each prior major swing low used for Dow Theory may be seen at the end of this analysis here.
ANALYSIS OF THE END OF INTERMEDIATE WAVE (3)
TECHNICAL ANALYSIS
Click chart to enlarge. Chart courtesy of StockCharts.com.
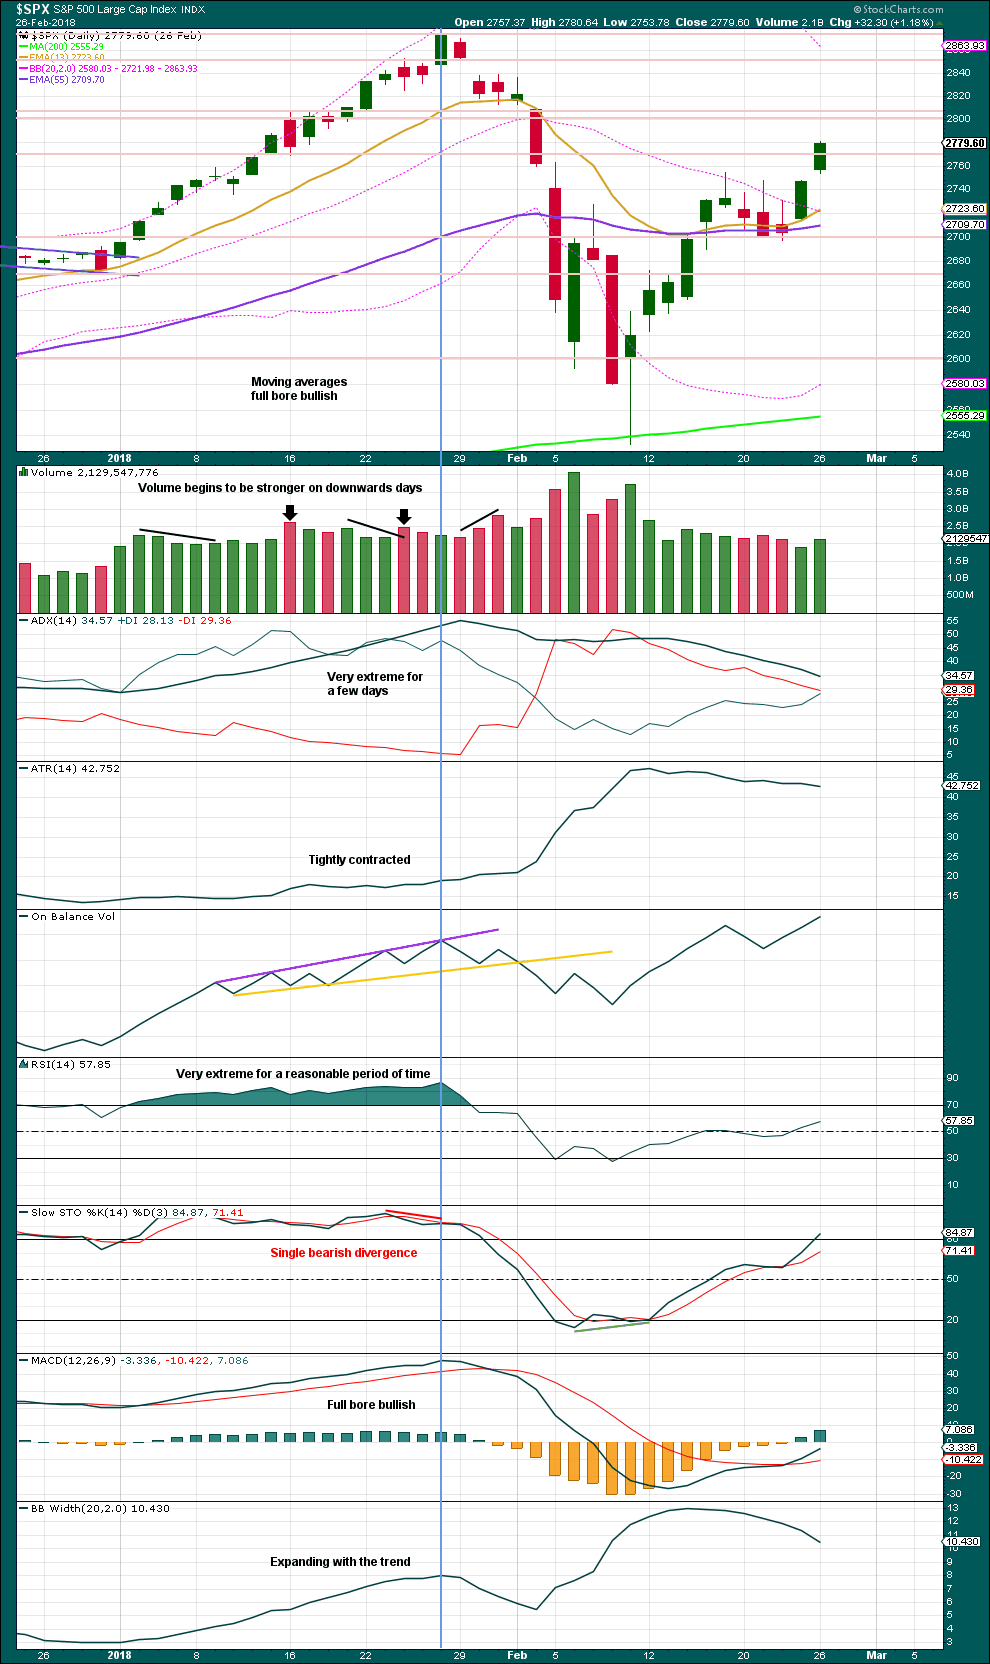
This chart looked overly bullish at the end of intermediate wave (3). The only warning in hindsight may have been from volume spiking slightly on downwards days. There was no bearish divergence between price and either of RSI or On Balance Volume.
Single bearish divergence between price and Stochastics was weak, which is often an unreliable signal.
VIX
Click chart to enlarge. Chart courtesy of StockCharts.com.
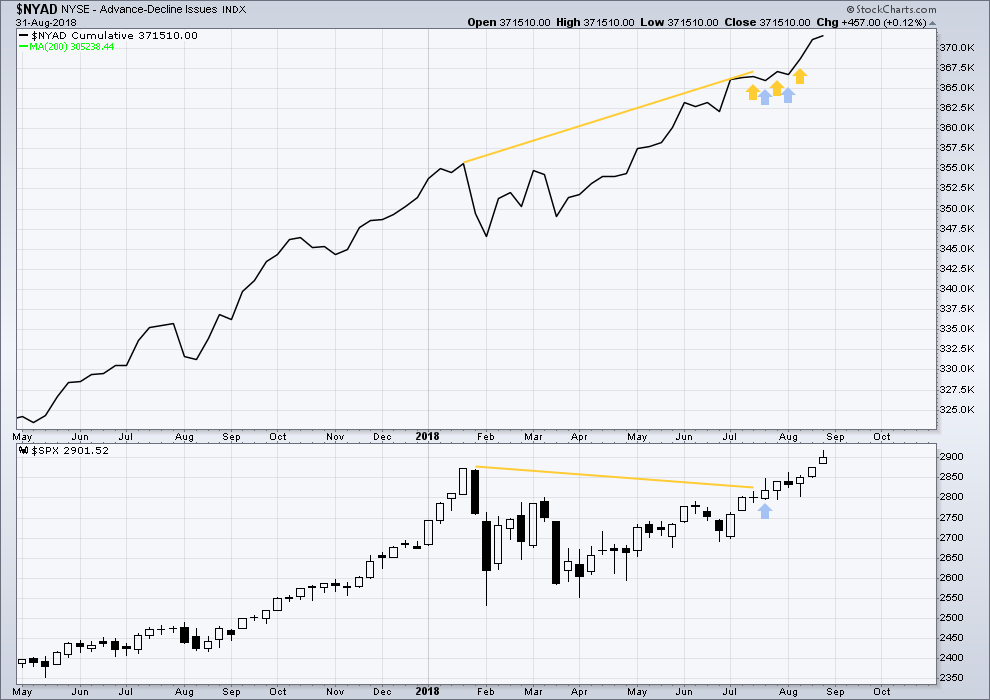
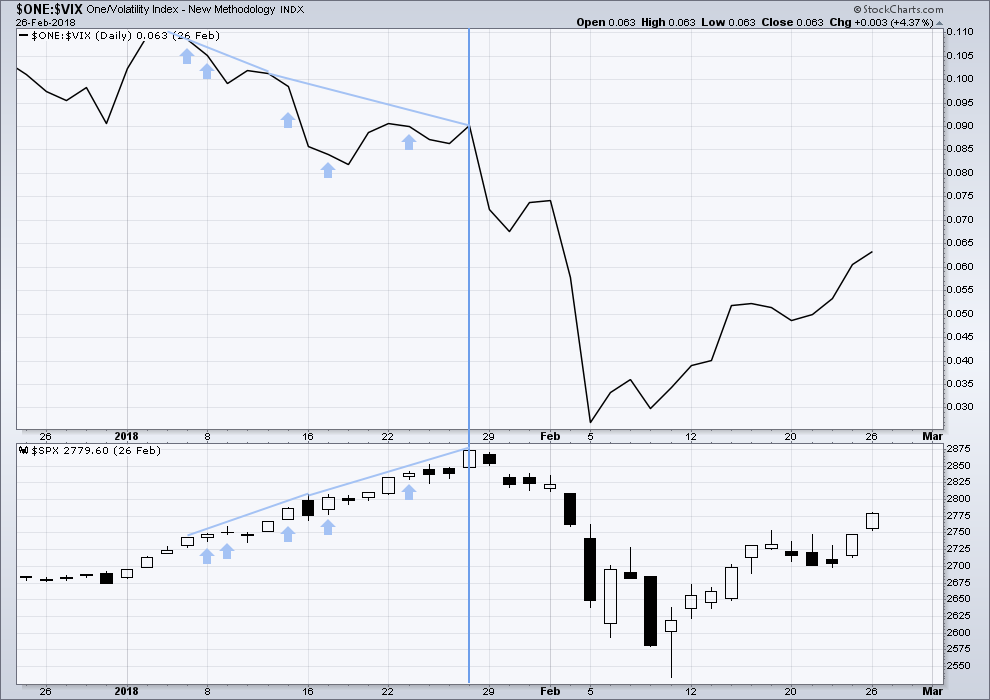
The strongest warning of an approaching intermediate degree correction at the daily chart level came from inverted VIX.
There was strong double bearish divergence at the high of intermediate wave (3), which is noted by the vertical line. There was also a sequence of five days of bearish divergence, days in which price moved higher but inverted VIX moved lower.
AD LINE
Click chart to enlarge. Chart courtesy of StockCharts.com.
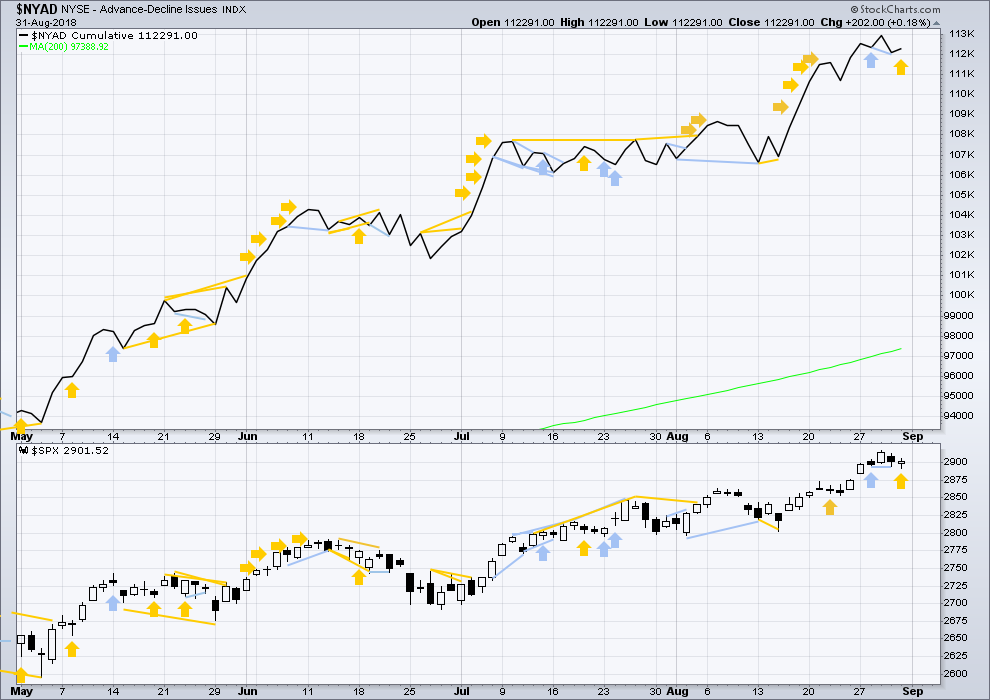
There was only single bearish divergence between price and the AD line at the end of intermediate wave (3). Approaching the high, there were no instances of price moving higher and the AD line moving lower.
Conclusion: When studying the behaviour of price and these indicators just before the start of intermediate wave (4), we may see some clues for warning us of primary wave 4. A cluster of bearish signals from VIX along with a bearish divergence from price and the AD line or On Balance Volume may warn of primary wave 4. The next instance will probably not behave the same as the last, but there may be similarities.
At this time, it does not look like primary wave 4 may begin right now, but we need to be aware of its approach.
Published @ 02:45 a.m. EST on 1st September, 2018.
Goooood morning everybody.
I’m going to label minute iv now as a rare triple zigzag. While these are rare, they’re not as rare as running flats. I’ve seen 4 on Gold in my research there.
That’s how this fits, and it fits well.
Now that minute iv is not contained in a channel drawn using Elliott’s first technique, the channel needs to be redrawn using the second technique. Minute v may end mid way within the channel, or about the upper edge.
I’ve added a small channel about minute iv drawn in the most conservative way possible. When that’s breached it may be an indication that minute iv is over.
WOW… no wonder I had no clue
Wow for sure! I was lost too.
I’m getting used to them now. Not common, but not the rarest structure.
Another benefit I’ve found from doing some research.
I took additional TLT shorts against the top of the long running (5+ months) range it pushed up to last week. Nice break back down, continuing today. Boy would I love to see 116 soon, that would float my boat. Notice it’s now WEEK 15 of an ongoing weekly tf squeeze. Last one (on chart) blew out hugely to the down side. One more time? My chips on are on the table.
I’m short looking for 2877, but I can’t figure an EW model, a diagonal for C down ?
Hourly trend still clearly down, but possibly a turn in progress on the 23% retrace fibo, other markets showing similar possible turn action at the same retrace level.
We should complete a small fourth going into the close before a final fifth up. VIX spreads hinting at an increase in volatility coming soon. I was able to snag 3.50 on a bid of just 2.50 for VIX 11.00 strike calls this morning. The upcoming turn will present one of those rare opportunities to really post very substantial gains to trading accounts. Negative divergences at these new highs are actually steeper than those seen at the January top. Many Happy Returns! 😀
Without going into any specifics (I won’t discuss/debate specifics here, only note the existence of risk), I do note that there are many possible sources of “bad news” that could initiate some significant (multi-week, multi-month) selling activity on the immediate horizon. Trade war escalation, multi-party conflict in Syria, political/legal issues in the US, just to cite three general large areas. I do believe things are going to Get Interesting. as in Chinese cursed Interesting, Real Soon Now (few days, maybe weeks). This factor is causing me a lot of difficulty in getting long here. Gad. “Fear” is the mind killer…
I am right with you on this one Kevin. Add to it the typical seasonality of September and early October. The next six weeks or so are down a few percentage points seasonally speaking.
I am sticking with Lara’s target. No point in leaving all that moolah on the table. Holding my SPY calls a few more days as we still have another 75 upside points or more. Ringing the register on half at 2920….
Absolutely no reason to concern yourselves about “political/legal issues in the US”… no risk/nothing on that front to occur for the next several years! Except of course if you’re a F N junkie.
I am much more concerned and everyone else should be about the persistent decline in Gold and Silver and the messages/signals that fact is sending.
Precious metals close to a bottom. Some miners presenting a once-in-a-lifetime buying opportunity…GORO, SA, WPM.
In a few years no one will believe they traded at today’s prices!
My larger analysis of Gold sees it still within a B wave.
And members here know my opinion on B waves. I really dislike them. So many possible structures, so many alternates, all valid.
It’s been flip flopping in the signals too: bullish to bearish. On Balance Volume makes a new significant high – very bullish. Only to see price turn and begin a sustained fall, then On Balance Volume makes a significant new low – very bearish.
Typical behaviour during B waves. Very difficult to analyse, horrible to trade. A nightmare.
Back, and right you are Kevin. Kudos to new high calls Lara!!! Trade safe everyone. I have tons of pics Lara but they’re too big to load.
Welcome back Chris!
Very interesting rumblings in the vol chart…I am sure you noticed! 🙂
Yes, got very long Vol. last week, took gains on short duration calls around 10am, holding longer duration. At full tilt on the short side as well. (not trading advice).
Ooooooh! Maybe you could format for web and upload just one really good one! Then I can have serious surf envy.
We’ve had some good swell here lately. Nice clean 3-4ft and powerful. But nothing like what you’ve been getting.
It looks to me as though the SPX gap of August 27th from roughly 2876 to 2785 will be tested today. Since I am still short term bullish, I don’t expect it to be filled.
So far it remains open and looks like price is bouncing up off the upper side of that gap…
If it remains open that’s a bullish signal, it’s still then a measuring gap.
The minor 5 structure looks very clear, and I’m quite confident there will be a minute v up now or very soon now. Up to 2922 or up and through to 2950 and then…we’ll see!!! One level at a time…
No updated analysis for you today everybody because New York is closed for Labour Day.
The large divergence shown the daily inverted VIX chart from Aug 6 to now is, to my eye, very similar looking to the VIX divergence in Jan leading up to the last Jan high.
Very similar.
Yes indeed it is.
I do think this is a warning sign.
But, looking at what happened when int (3) ended and int (4) began, it happened five times on the daily chart, and it was really clear on the weekly chart too.
What that means, is when it occurs we can read it as a warning. When it occurs again, the warning is louder. And again, the warning gets louder. But it may be hopeless as a timing tool.
After the first time it occurred approaching the end of int (3), price kept going up with increased strength, for another 100 points before the end.
So, yeah, sadly hopeless as a timing tool. But lets listen carefully to warnings.
I agree, not a timing tool, but a serious heads up indicator. The 3 week larger divergence (vs the many smaller ones) is what appears unique and significant here to me. Something has to give; the VIX has to get back in line with continued bull market action, or…the bear needs to growl. The impending P4 suggests its going to be the latter…eventually.
Next a minute v up though, is certainly my expectation.
Interesting times. Personally I have a difficult time going long with P4 lurking close by. But can’t go short either as we might have another 50-100 SPX points to the upside, and it may very well meander at the top for a bit once we get there… unlike intermediate 4.
Its SOH time for me 🙂
Enjoy the long weekend everybody!
Recall that the approach to the end of intermediate wave (3) saw some reasonable bearishness expressed here in comments. I expect that is going to happen again as primary 3 comes to an end.
While I want to continue to consider all possibilities, and I must, I am also aware that the bearish case may be given too much weight before we have any signals of a turn.
The trend is up, until proven otherwise. And today there is no proof that it has changed.
SOH is certainly a valid approach if it fits with your risk management system. The less time in the market the less risk.
But also, the less time in a trend the less profits.
Another possible approach would be to stay long while the trend is up, and keep moving stops higher based upon open gaps / Elliott wave invalidation points or any other method you choose to employ. Being prepared for some slippage if P4 arrives early and begins with strength.
soh ? – sense of humour?
“Sit on hands” 🙂
Actually, I like sense of humour better LOL
But yeah, Ari’s got it.
Ha thank you both !