
Price continues higher exactly as the Elliott wave count expects.
Members were warned at the end of last week to look out for strength in upwards movement. With a strong gap higher and an increase in slope of upwards movement, that is what is happening so far.
Summary: Expect price to keep moving higher. Look out for further strength in upwards movement. Today’s gap may be a breakaway gap, which may offer support at 2,876.16. Gaps can be useful in trading as a place to set stops.
Stops for long positions may be pulled up to just below 2,876.16.
We may not see another consolidation or pullback of reasonable duration until primary wave 3 is complete.
The mid to longer term target is at 2,922 (Elliott wave), or 2,950 (Elliott wave), or 3,045 (classic analysis). Another multi week to multi month correction is expected at one of these targets.
The final target for this bull market to end remains at 3,616.
Always practice good risk management. Always trade with stops and invest only 1-5% of equity on any one trade.
New updates to this analysis are in bold.
The biggest picture, Grand Super Cycle analysis, is here.
Last historic analysis with monthly charts is here, video is here.
ELLIOTT WAVE COUNT
WEEKLY CHART
Click chart to enlarge.
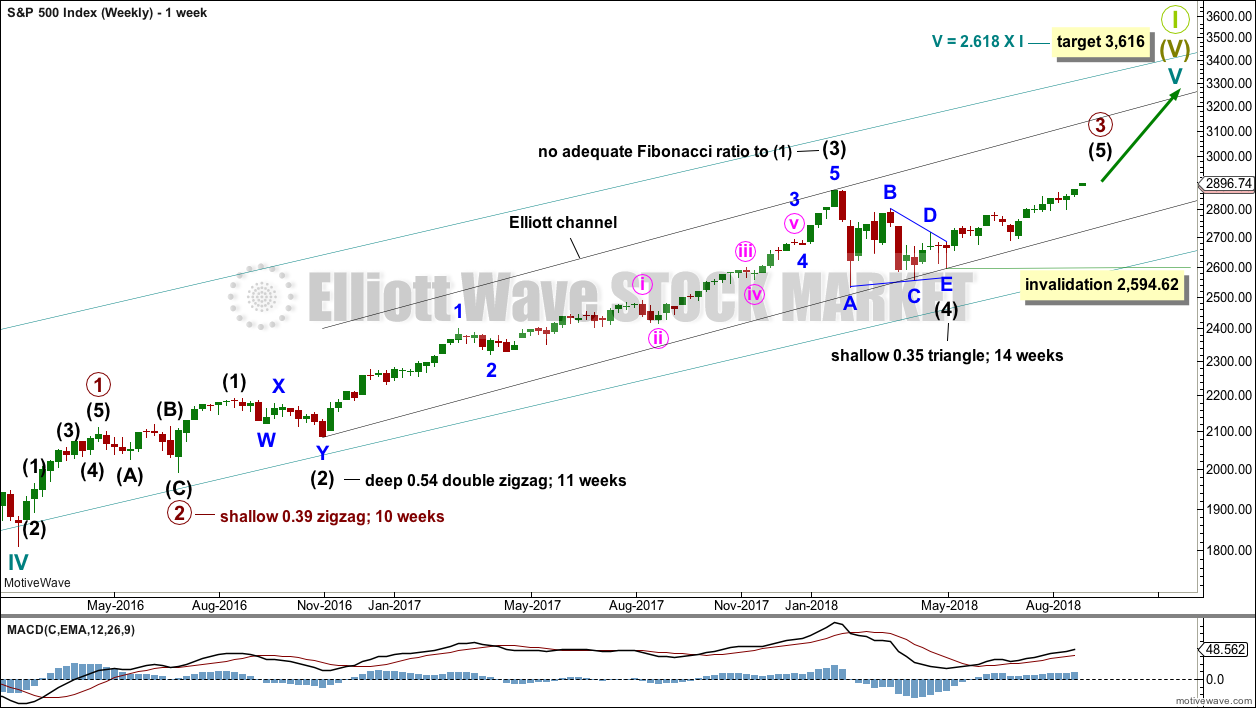
Cycle wave V must complete as a five structure, which should look clear at the weekly chart level and also now at the monthly chart level. It may only be an impulse or ending diagonal. At this stage, it is clear it is an impulse.
Within cycle wave V, the third waves at all degrees may only subdivide as impulses.
Intermediate wave (4) has breached an Elliott channel drawn using Elliott’s first technique. The channel is redrawn using Elliott’s second technique: the first trend line from the ends of intermediate waves (2) to (4), then a parallel copy on the end of intermediate wave (3). Intermediate wave (5) may end either midway within the channel, or about the upper edge.
Intermediate wave (4) may now be a complete regular contracting triangle lasting fourteen weeks, one longer than a Fibonacci thirteen. There is perfect alternation and excellent proportion between intermediate waves (2) and (4).
Within intermediate wave (5), no second wave correction may move beyond the start of its first wave below 2,594.62. However, the lower edge of the black Elliott channel drawn across the ends of intermediate degree waves should provide very strong support for any deeper pullbacks, holding price well above the invalidation point while intermediate wave (5) unfolds.
At this stage, the expectation is for the final target to me met in October 2019. If price gets up to this target and either the structure is incomplete or price keeps rising through it, then a new higher target would be calculated.
A multi week to multi month consolidation for primary wave 4 is expected on the way up to the final target.
The last bullish fifth wave of minor wave 5 to end intermediate wave (3) exhibited commodity like behaviour. It was strong and sustained. It is possible that minor wave 5 to end intermediate wave (5) to end primary wave 3 may exhibit similar behaviour, so we should be on the lookout for this possibility. This may happen over the next very few weeks.
DAILY CHART
Click chart to enlarge.
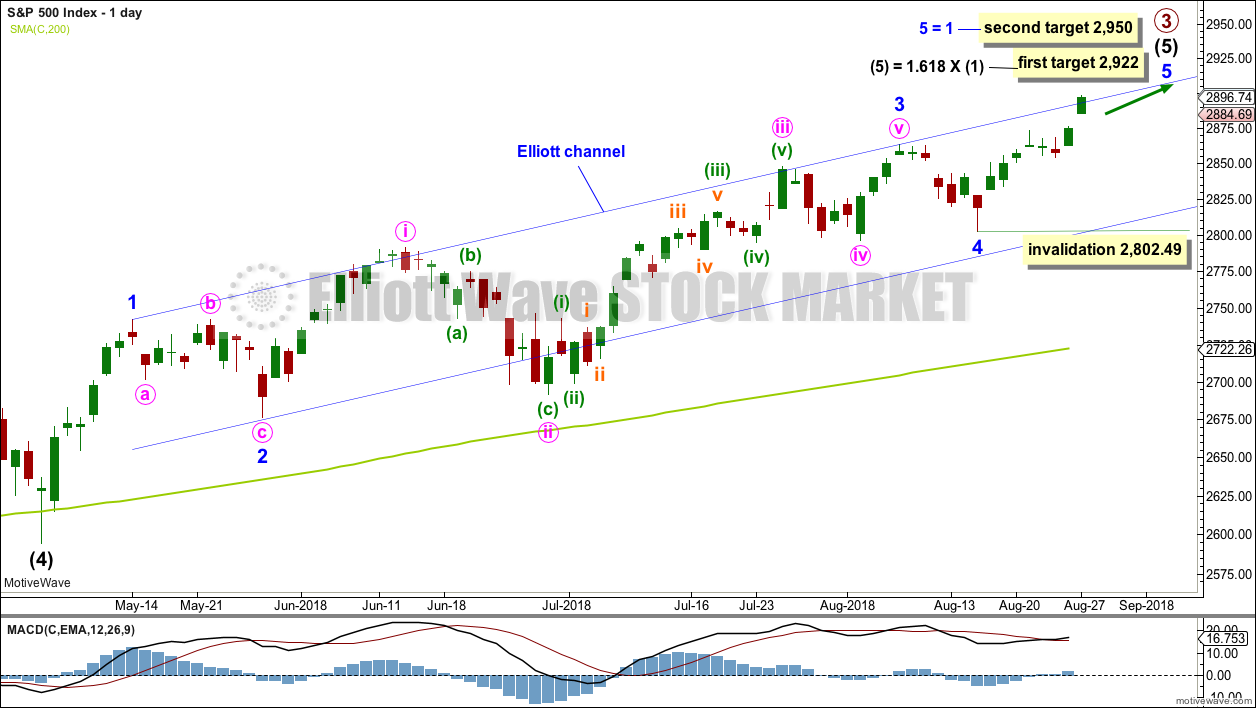
Intermediate wave (5) avoided a truncation now that it has a slight new high above the end of intermediate wave (3) at 2,872.87.
Intermediate wave (3) exhibits no Fibonacci ratio to intermediate wave (1). It is more likely then that intermediate wave (5) may exhibit a Fibonacci ratio to either of intermediate waves (1) or (3). The most common Fibonacci ratio would be equality in length with intermediate wave (1), but in this instance that would expect a truncation. The next common Fibonacci ratio is used to calculate a target for intermediate wave (5) to end.
Intermediate wave (5) is unfolding as an impulse, and within it minor waves 1 through to 4 may now all be complete.
The channel is drawn about intermediate wave (5) using Elliott’s first technique. Price today has closed above the upper edge.
This upwards day exhibits some reasonable strength. Minor wave 5 may be developing some commodity like behaviour, which was one possibility we were looking out for. If price can move further above the upper edge of this channel, then it may provide some support.
If price gets to the first target and the structure of minor wave 5 is incomplete, or if price just keeps on rising through the first target, then the second target will be used. It looks like at this stage the second target may now be more likely.
HOURLY CHART
Click chart to enlarge.
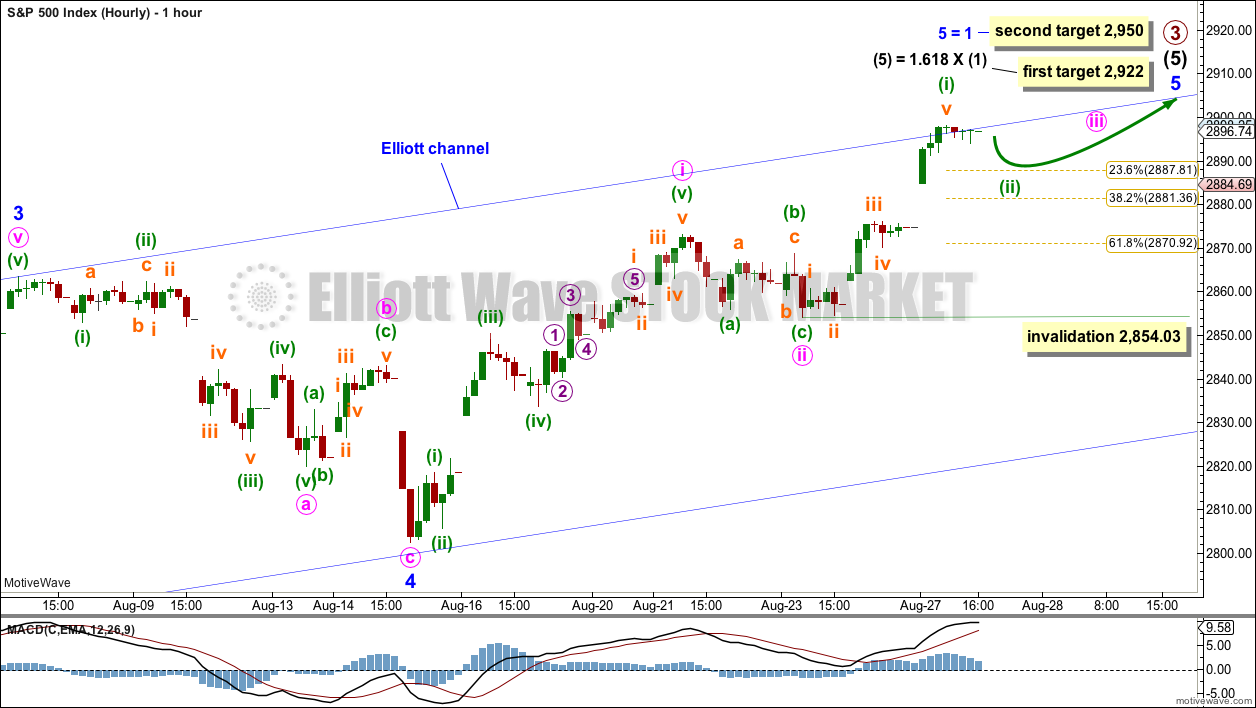
The hourly chart will focus now on minor wave 5.
Minor wave 5 may unfold as either an impulse or an ending diagonal. An impulse is more likely.
So far minute waves i and ii may be complete. Minute wave iii may exhibit some further increase in upwards momentum this week.
Minute wave iii may only subdivide as an impulse. While it could be over at today’s high, that would see it much shorter than minute wave i. What would be more likely is that minute wave iii would be at least about even in length with minute wave i, and likely longer. Therefore, the upwards impulse complete at today’s high is labelled minuette wave (i) within minute wave iii.
Minuette wave (ii) may be surprisingly shallow as the upwards pull of a third wave at two small degrees forces it to be more brief and shallow. Minuette wave (ii) may not move beyond the start of minuette wave (i) below 2,854.03.
When minute waves i to iv may be complete, then the target may be calculated at a third degree. At that stage, the target may widen to a small zone or it may change.
TECHNICAL ANALYSIS
WEEKLY CHART
Click chart to enlarge. Chart courtesy of StockCharts.com.
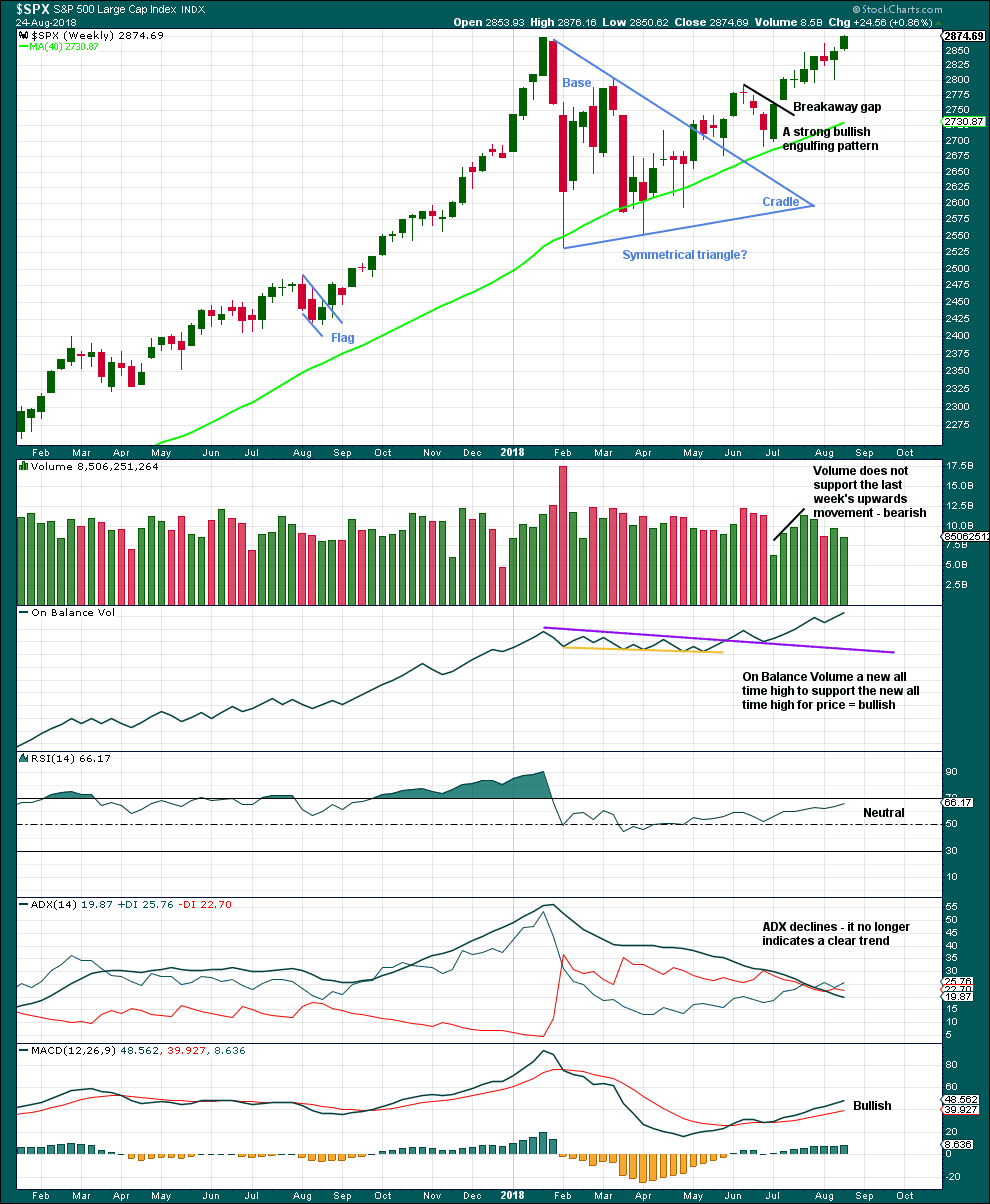
The symmetrical triangle may now be complete. The base distance is 340.18. Added to the breakout point of 2,704.54 this gives a target at 3,044.72. This is above the Elliott wave target at 2,922, so the Elliott wave target may be inadequate.
A new all time high for price has support from another new all time high from On Balance Volume at the weekly chart level, although not at the daily chart level. This is bullish.
Price can rise in current market conditions on light and declining volume for a reasonable period of time, so lighter volume last week does not mean that the rise in price is unsustainable for the short or mid term.
DAILY CHART
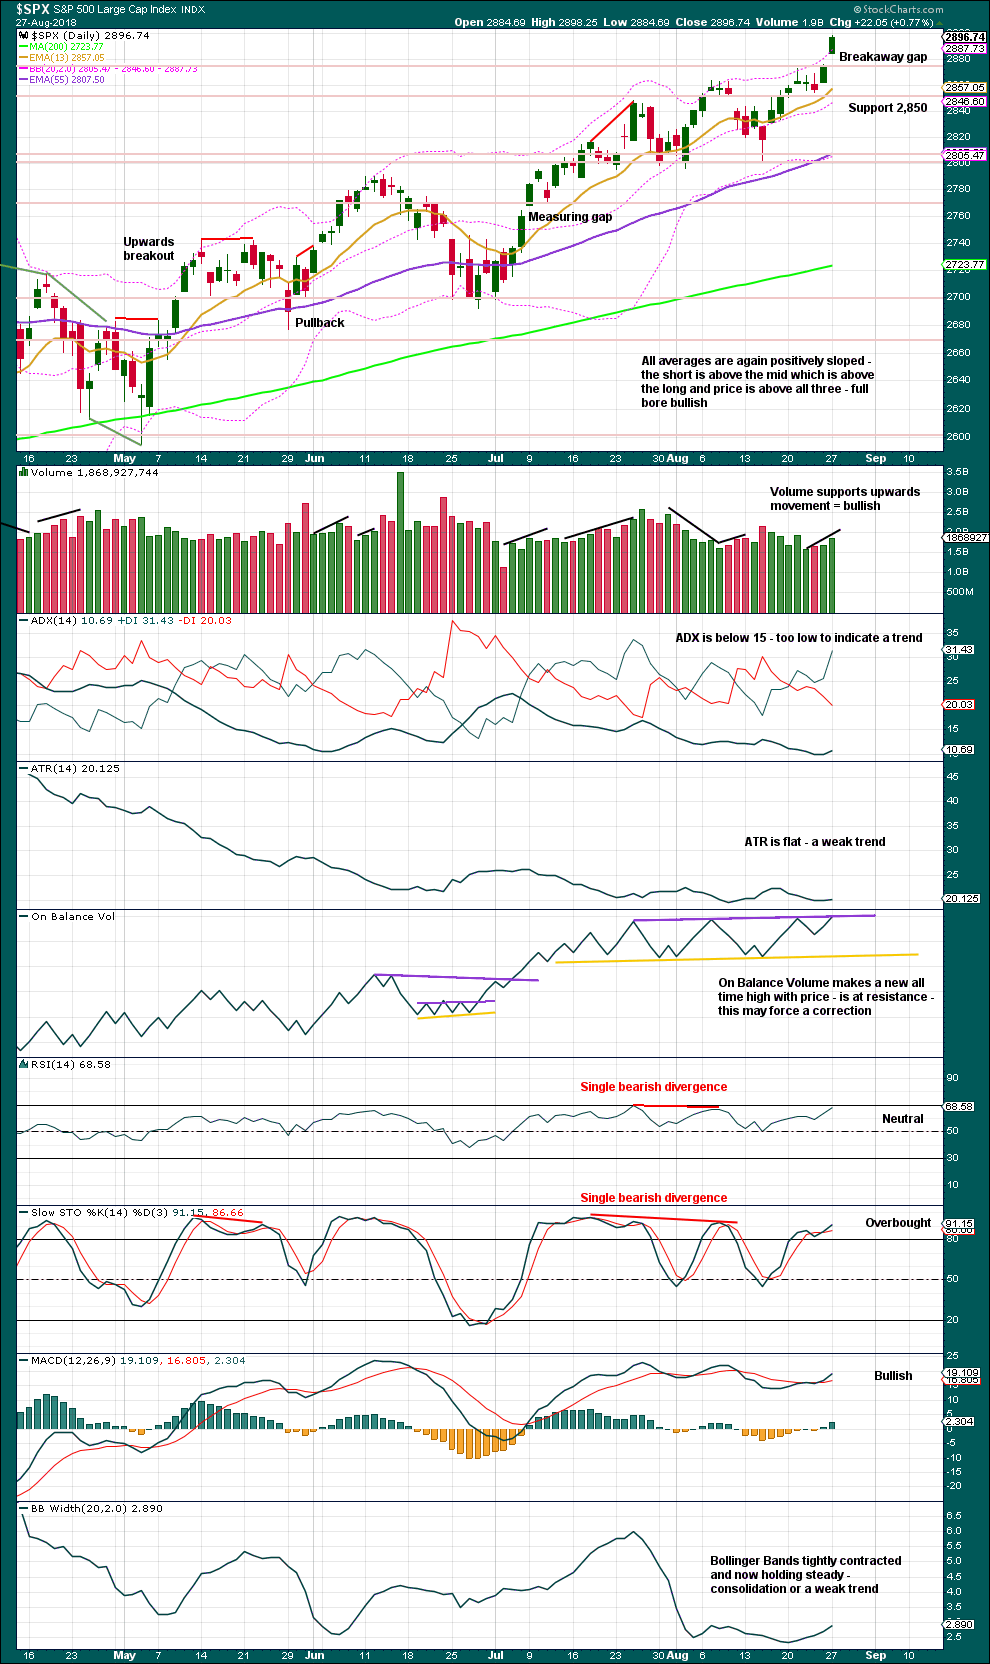
Click chart to enlarge. Chart courtesy of StockCharts.com.
Since the low on the 2nd of April, 2018, price has made a series of higher highs and higher lows. This is the definition of an upwards trend. But trends do not move in perfectly straight lines; there are pullbacks and bounces along the way.
Price today has gapped up from prior resistance. The gap looks like a breakaway gap.
It is a common myth that all gaps must be closed. But breakaway and measuring gaps are in fact not closed, so they can be useful in trading: stops may be adjusted using these gaps. If today’s gap is closed, then it would not be a breakaway gap but would then correctly be an exhaustion gap, so a reasonable correction would be expected and long positions should then be closed.
On Balance Volume is at resistance. While this might initiate a small pullback, it does not have to. A break above resistance would be another bullish signal.
VOLATILITY – INVERTED VIX CHART
WEEKLY CHART
Click chart to enlarge. Chart courtesy of StockCharts.com. So that colour blind members are included, bearish signals
will be noted with blue and bullish signals with yellow.
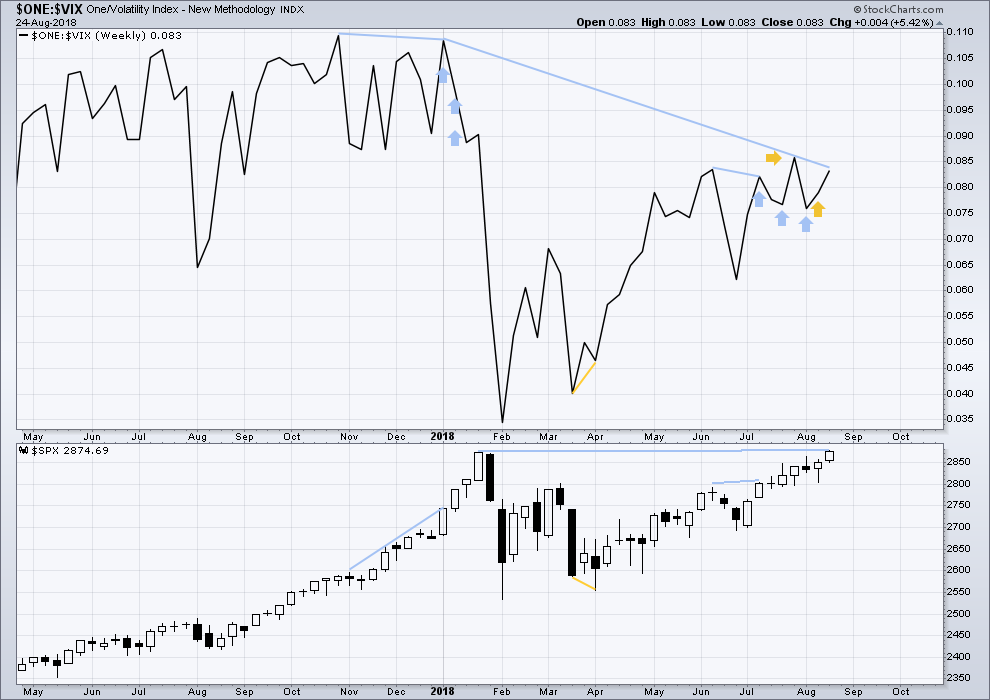
To keep an eye on the all time high for inverted VIX a weekly chart is required at this time.
Notice how inverted VIX has very strong bearish signals four weeks in a row just before the start of the last large fall in price. At the weekly chart level, this indicator may be useful again in warning of the end of primary wave 3.
At this time, there is mid term bearish divergence between price and inverted VIX: price has made a new all time high, but inverted VIX has not. This divergence may persist for some time and may remain at the end of primary wave 3.
For the short term, upwards movement last week had support from a decline in market volatility. There is no very short term divergence.
DAILY CHART
Click chart to enlarge. Chart courtesy of StockCharts.com. So that colour blind members are included, bearish signals
will be noted with blue and bullish signals with yellow.
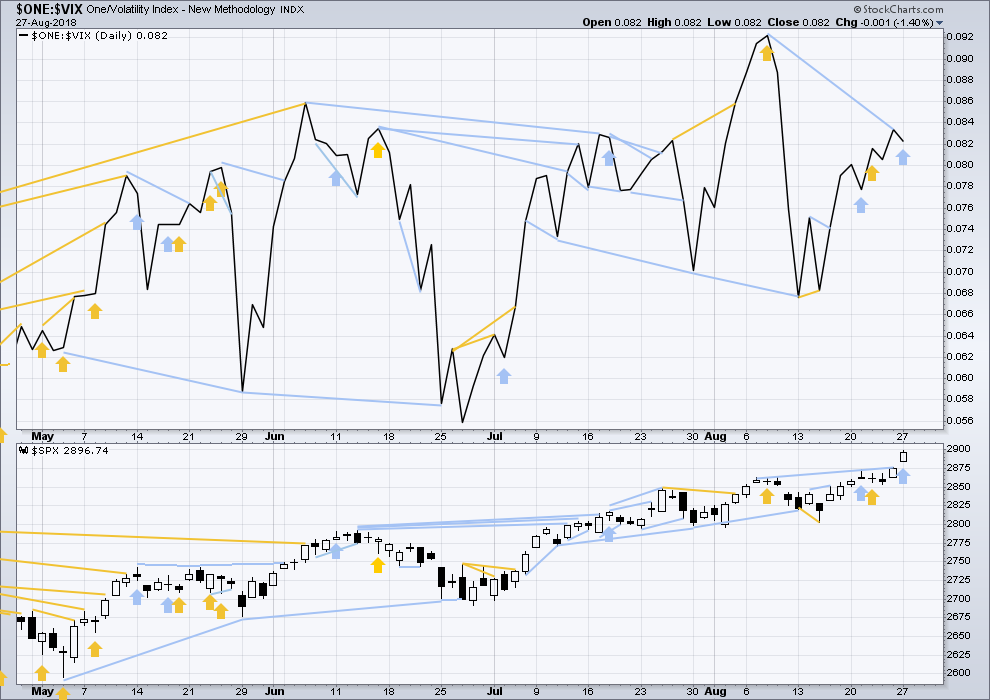
Normally, volatility should decline as price moves higher and increase as price moves lower. This means that normally inverted VIX should move in the same direction as price.
There is mid term divergence with a new all time high from price not supported by a corresponding new all time high from inverted VIX. This divergence is bearish.
There is single day bearish divergence today: price has moved strongly higher, but inverted VIX has moved lower. The upwards movement today from price does not come with a normal corresponding decline in volatility. Volatility has reasonably increased.
BREADTH – AD LINE
WEEKLY CHART
Click chart to enlarge. Chart courtesy of StockCharts.com.
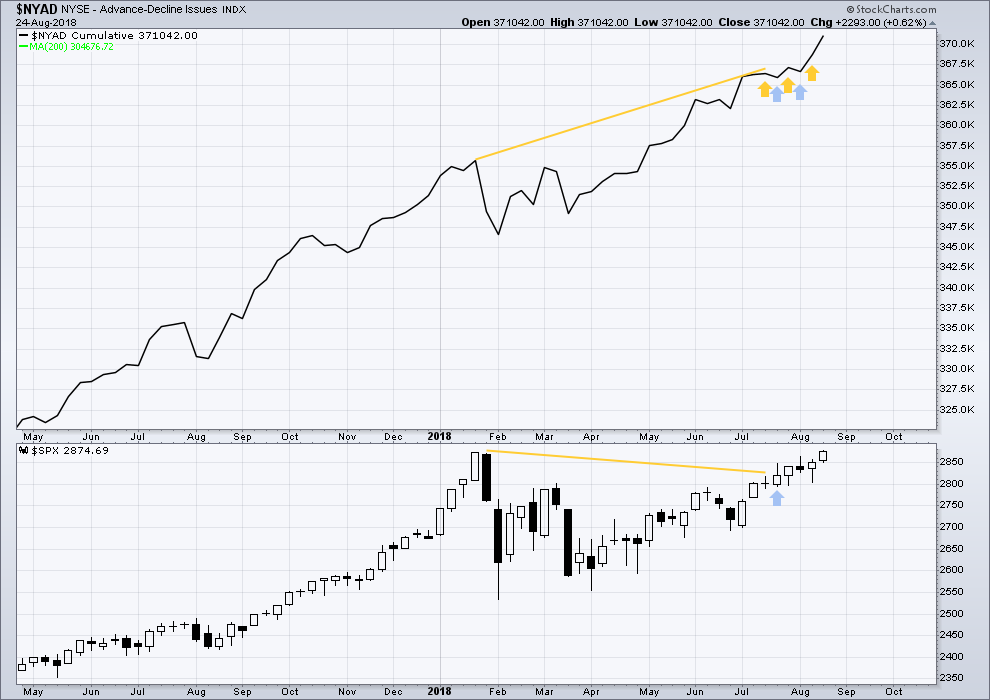
When primary wave 3 comes to an end, it may be valuable to watch the AD line at the weekly time frame as well as the daily.
Strong bullish divergence noted between price and the AD line has finally been followed by a new all time high from price. This divergence may now be resolved, or it may be followed by more upwards movement.
DAILY CHART
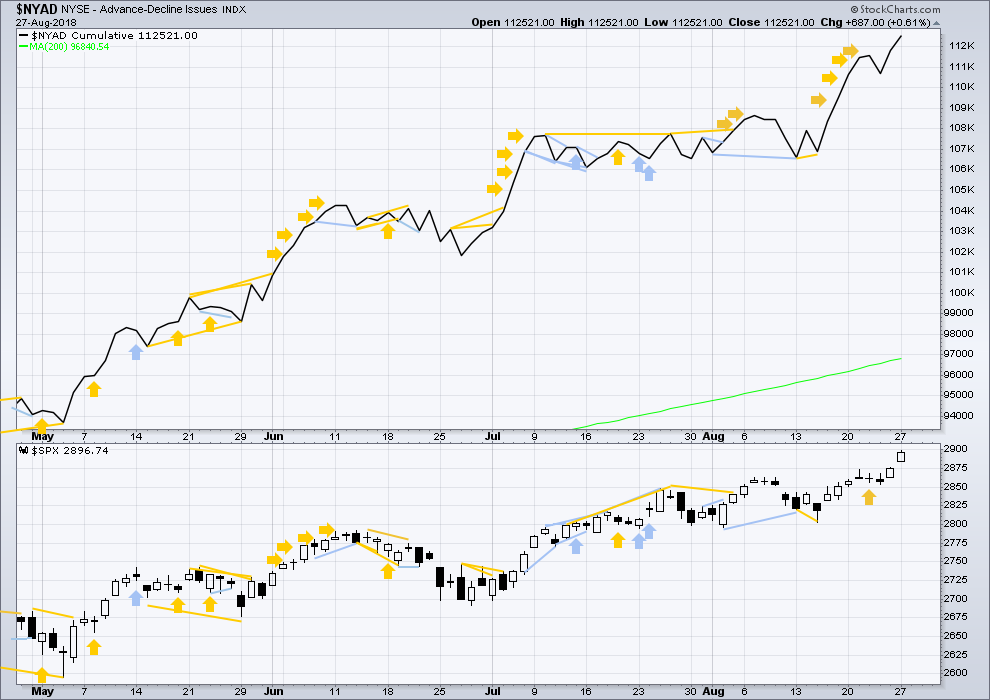
Click chart to enlarge. Chart courtesy of StockCharts.com.
There is normally 4-6 months divergence between price and market breadth prior to a full fledged bear market. This has been so for all major bear markets within the last 90 odd years. With no longer term divergence yet at this point, any decline in price should be expected to be a pullback within an ongoing bull market and not necessarily the start of a bear market. New all time highs from the AD line means that any bear market may now be an absolute minimum of 4 months away. It may of course be a lot longer than that. My next expectation for the end of this bull market may now be October 2019.
Breadth should be read as a leading indicator.
Another new all time high today from price has support from rising market breadth. There is no divergence, which is bullish.
All of small, mid and large caps made new all time highs today. Mid and small caps have Shooting Star candlestick patterns.
From Nison, “Japanese Candlestick Charting Techniques”:
“The shooting star has a small real body at the lower end of its range with a long upper shadow… The Japanese aptly say that the shooting star hows trouble overhead. Since it is one session, it is usually not a major reversal signal as is the bearish engulfing pattern or evening star. Nor do I view the shooting star as pivotal resistance as I do with the previously mentioned patterns.”
DOW THEORY
The following lows need to be exceeded for Dow Theory to confirm the end of the bull market and a change to a bear market:
DJIA: 23,360.29.
DJT: 9,806.79.
S&P500: 2,532.69.
Nasdaq: 6,630.67.
Nasdaq and DJT and now the S&P500 have all made recent new all time highs. For Dow Theory confirmation of the ongoing bull market, DJIA needs to make a new all time high.
Charts showing each prior major swing low used for Dow Theory may be seen at the end of this analysis here.
ANALYSIS OF THE END OF INTERMEDIATE WAVE (3)
TECHNICAL ANALYSIS
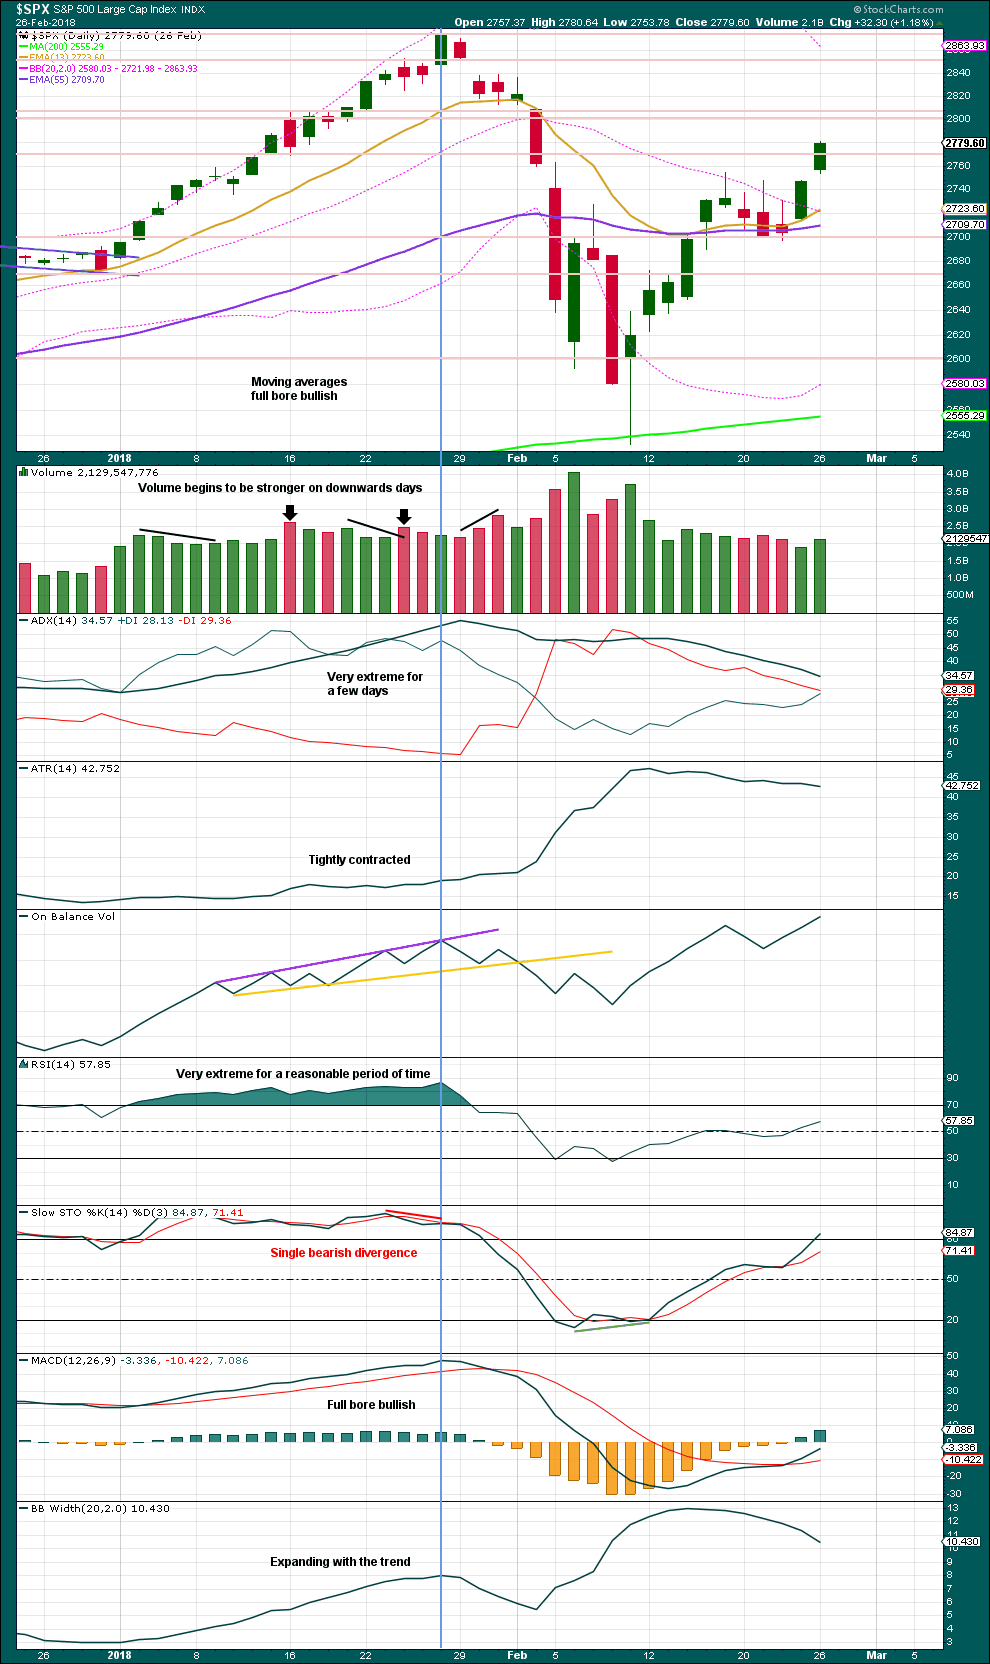
Click chart to enlarge. Chart courtesy of StockCharts.com.
This chart looked overly bullish at the end of intermediate wave (3). The only warning in hindsight may have been from volume spiking slightly on downwards days. There was no bearish divergence between price and either of RSI or On Balance Volume.
Single bearish divergence between price and Stochastics was weak, which is often an unreliable signal.
VIX
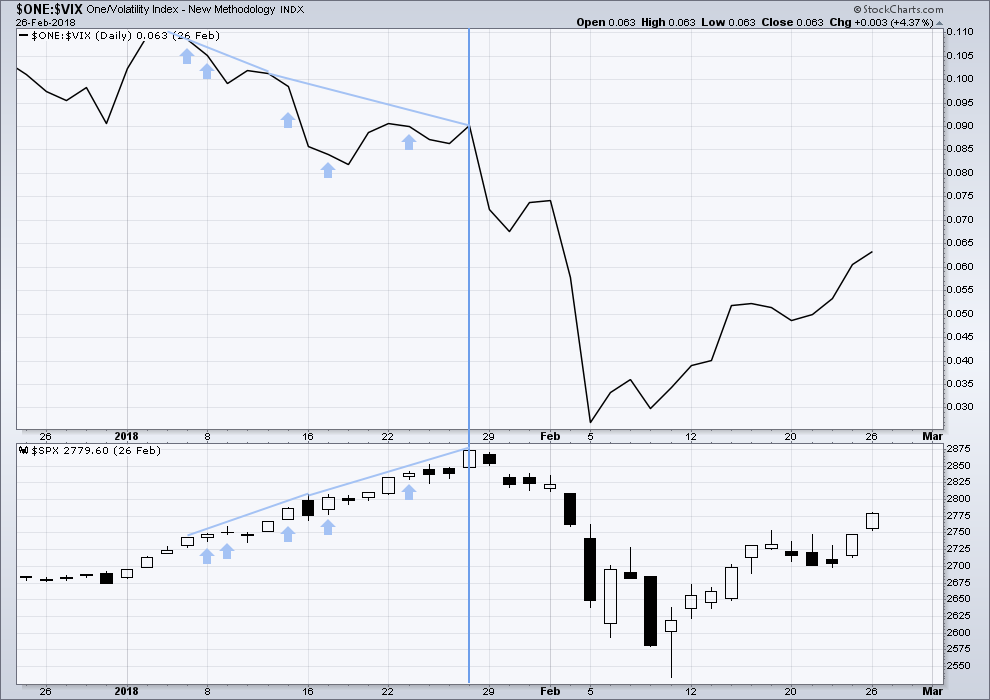
Click chart to enlarge. Chart courtesy of StockCharts.com.
The strongest warning of an approaching intermediate degree correction at the daily chart level came from inverted VIX.
There was strong double bearish divergence at the high of intermediate wave (3), which is noted by the vertical line. There was also a sequence of five days of bearish divergence, days in which price moved higher but inverted VIX moved lower.
AD LINE
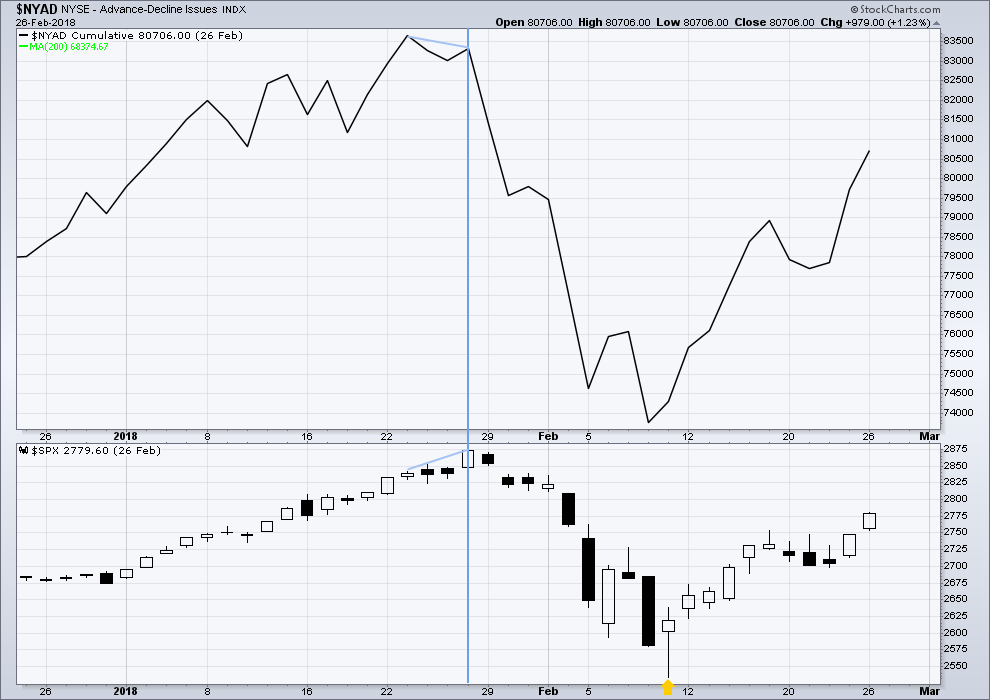
Click chart to enlarge. Chart courtesy of StockCharts.com.
There was only single bearish divergence between price and the AD line at the end of intermediate wave (3). Approaching the high, there were no instances of price moving higher and the AD line moving lower.
Conclusion: When studying the behaviour of price and these indicators just before the start of intermediate wave (4), we may see some clues for warning us of primary wave 4. A cluster of bearish signals from VIX along with a bearish divergence from price and the AD line or On Balance Volume may warn of primary wave 4. The next instance will probably not behave the same as the last, but there may be similarities.
At this time, it does not look like primary wave 4 may begin right now, but we need to be aware of its approach.
Published @ 10:00 p.m. EST.
Here is how volocaust 2 might unfold…
Sorry everybody for not being here before market close.
I’m preparing your analysis now, to be published very soon.
Hi Kevin
Why is the VIX up today when the market is up also.
Thank You
I think the nominal interpretation is that the option traders are increasingly expecting downward price movement, despite price moving up. It’s continuing the divergence that started yesterday, and can be part of the signalling of an impending top. Like the one we are about to get, if Lara’s count is correct, and every indication for the last 9 months is that it is.
Thanks Kevin
I hope your right!
If it is what kind of correction do you think we might get?
Thank You
Wanted to get thoughts on a couple of beaten stocks I’m considering on going long while we get to a top: one is BABA, which has plummeted due to the China trade concerns and general emerging market volatility. And the other is a play on oil that Kevin mentioned a couple of months ago: FANG, which plummeted after they bought out a competitor making them one of the biggest players in the Permian basin…
Any thoughts?
I look at FANG and have no idea which way it might go next. If you forced me to trade it, I’d consider a butterfly around it’s current price. Next, a short. Last, a long. My $0.02 worth less.
As for BABA, I think it’s a similar story. The downtrend line on the daily is not broken yet to the upside.
I’d say perhaps you can do better re: stocks in an immediate trend? And…the P4 down could start in 2 days. Or 2 weeks. You don’t have much time to be riding prices up here, unless you are very tactical and nimble. So I would think you’d only want stocks clearly trending now, this moment.
One to consider would be GS. Trending pretty hard up. Of if you like rocket fueled equities, BLUE carries a punch and is trending up now.
There’s always AAPL, which for a few days long trade isn’t the worst idea!
You’re right. No need to be bottom fishing here with P4 around the corner. As eric mentions above, VIX is green along with the market going on 2 days now…
Lets see where it closes…
I’ve refined my top target zone in price and time. Hourly chart. I think it will be in the 2 week period starting this Thursday, at this point. Right in the middle of that (vertical white line) is the point in time where the current singular swing up on the weekly is the same length of time as the singular swing up that led to the January top. The market LOVES that kind of symmetry, the EW reinforces the likelihood by indicating a primary 3 top is extremely close at hand. Still looking at the 2950 price level as the most likely for the top. I’ve 3 different channels drawn in here, each progressively on more recent data only, and each progressively steeper. I.e., the market is “going exponential”, as is often the case before BIG tops. Yet more supporting evidence.
AMD approaching gap fill, first fibo, and looks like a C completing ….
took my little short profit, thanks!
I wonder if Aug 16 was the breakaway gap, making today a continuation gap, and we can expect an exhaustion gap before it’s all over.
The similarity in the Aug ’17 run to the Jan ’18 top to this run starting from the Apr low is quite high. Timing wise, this run will be at equal time at the end of next week. Right about the time we might expect this primary 3 to end.
Getting a bit more sell off in bonds in over night action. I thinking that’s going to continue in general for the next 5 days, driving finance and the market higher. Just a hunch, since we also generally expect the market to move higher; I look for reinforcing setups and moves. Bonds have turned down off the top of a very wide channel, and finance has been rallying on every tick up in interest rates for weeks now.
Hi Kevin,
Do you have a price target for TLT or ZB on this move down?
I’m thinking 144’25 for ZB and possibly 120 for TLT as an initial targets based on prior resistance. Wondering if you have any fibo clusters or trend line targets?
Actually 144’25 is not much of a drop, we’re close to that already. The next 2 support levels would be 144 and 143’15… But 120 for TLT still is a good target, with 119.25 next support…
Here’s my TLT view. The 120.3 area is “first target” (a 50% and 38%), the 199.6 area “second target” (a 62% and a 50%), and after that, I’d say 118.7-119 (a 62% and 78%), then 118.1. (100% retrace).
Thanks Kevin 🙂 the short trade is working out great so far.
I need a big move down. But, I have until December. I’m not sweating it at this point!
Looking at previous chart action with moves down from peaks, we might get a big move in the next day or two… options expire in October so I need to be nimble.
Good luck my man!