
An extremely likely new all time high for the S&P has been expected.
Summary: Expect price to keep moving higher next week.
We may not see another consolidation or pullback of reasonable duration until primary wave 3 is complete.
The mid to longer term target is at 2,922 (Elliott wave), or 2,950 (Elliott wave), or 3,045 (classic analysis). Another multi week to multi month correction is expected at one of these targets.
The final target for this bull market to end remains at 3,616.
Always practice good risk management. Always trade with stops and invest only 1-5% of equity on any one trade.
New updates to this analysis are in bold.
The biggest picture, Grand Super Cycle analysis, is here.
Last historic analysis with monthly charts is here, video is here.
ELLIOTT WAVE COUNT
WEEKLY CHART
Click chart to enlarge.
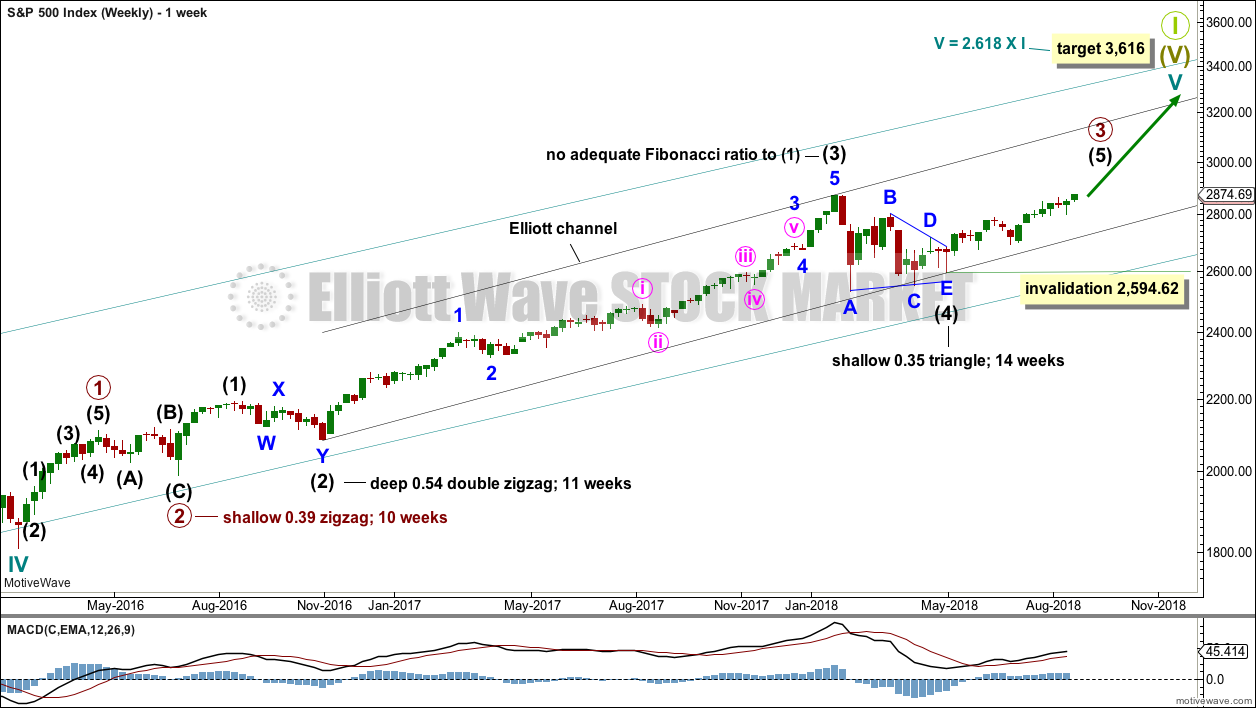
Cycle wave V must complete as a five structure, which should look clear at the weekly chart level and also now at the monthly chart level. It may only be an impulse or ending diagonal. At this stage, it is clear it is an impulse.
Within cycle wave V, the third waves at all degrees may only subdivide as impulses.
Intermediate wave (4) has breached an Elliott channel drawn using Elliott’s first technique. The channel is redrawn using Elliott’s second technique: the first trend line from the ends of intermediate waves (2) to (4), then a parallel copy on the end of intermediate wave (3). Intermediate wave (5) may end either midway within the channel, or about the upper edge.
Intermediate wave (4) may now be a complete regular contracting triangle lasting fourteen weeks, one longer than a Fibonacci thirteen. There is perfect alternation and excellent proportion between intermediate waves (2) and (4).
Within intermediate wave (5), no second wave correction may move beyond the start of its first wave below 2,594.62. However, the lower edge of the black Elliott channel drawn across the ends of intermediate degree waves should provide very strong support for any deeper pullbacks, holding price well above the invalidation point while intermediate wave (5) unfolds.
At this stage, the expectation is for the final target to me met in October 2019. If price gets up to this target and either the structure is incomplete or price keeps rising through it, then a new higher target would be calculated.
A multi week to multi month consolidation for primary wave 4 is expected on the way up to the final target.
The last bullish fifth wave of minor wave 5 to end intermediate wave (3) exhibited commodity like behaviour. It was strong and sustained. It is possible that minor wave 5 to end intermediate wave (5) to end primary wave 3 may exhibit similar behaviour, so we should be on the lookout for this possibility. This may happen over the next very few weeks.
DAILY CHART
Click chart to enlarge.
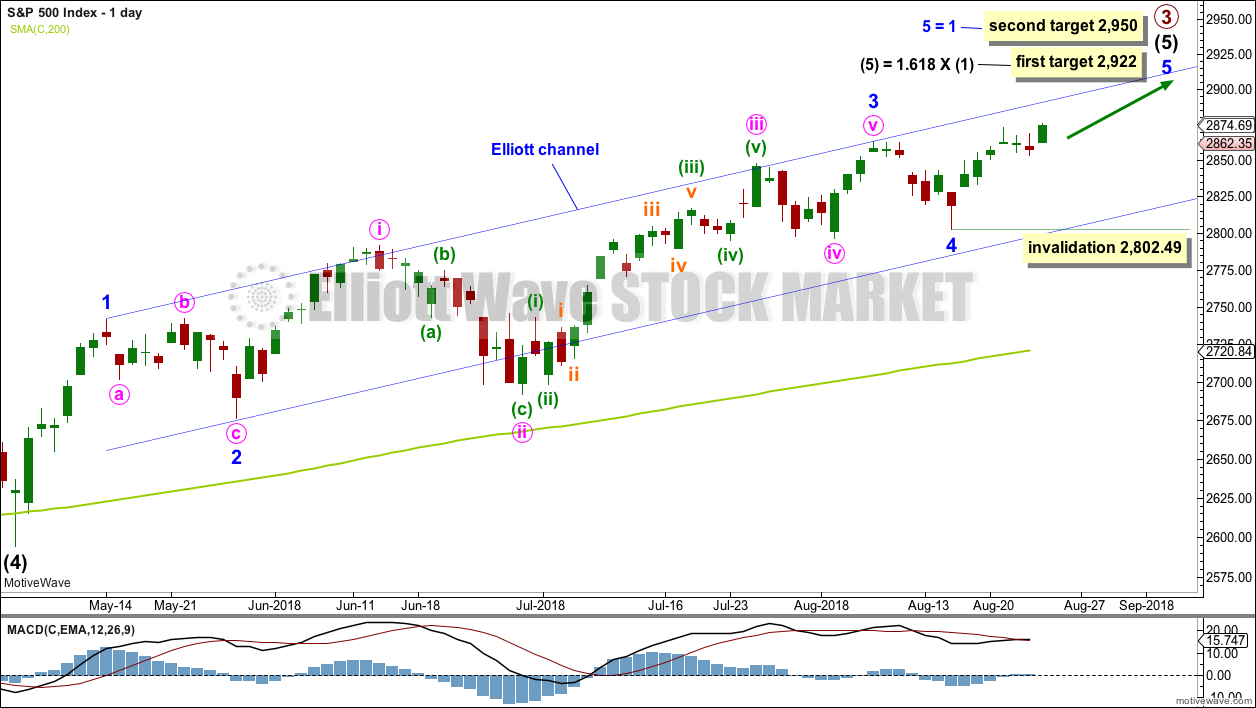
Intermediate wave (5) avoided a truncation now that it has a slight new high above the end of intermediate wave (3) at 2,872.87.
Intermediate wave (3) exhibits no Fibonacci ratio to intermediate wave (1). It is more likely then that intermediate wave (5) may exhibit a Fibonacci ratio to either of intermediate waves (1) or (3). The most common Fibonacci ratio would be equality in length with intermediate wave (1), but in this instance that would expect a truncation. The next common Fibonacci ratio is used to calculate a target for intermediate wave (5) to end.
Intermediate wave (5) is unfolding as an impulse, and within it minor waves 1 through to 4 may now all be complete.
The channel is redrawn about intermediate wave (5) using Elliott’s first technique. The upper edge may continue to provide resistance.
If price gets to the first target and the structure of minor wave 5 is incomplete, or if price just keeps on rising through the first target, then the second target will be used.
HOURLY CHART
Click chart to enlarge.
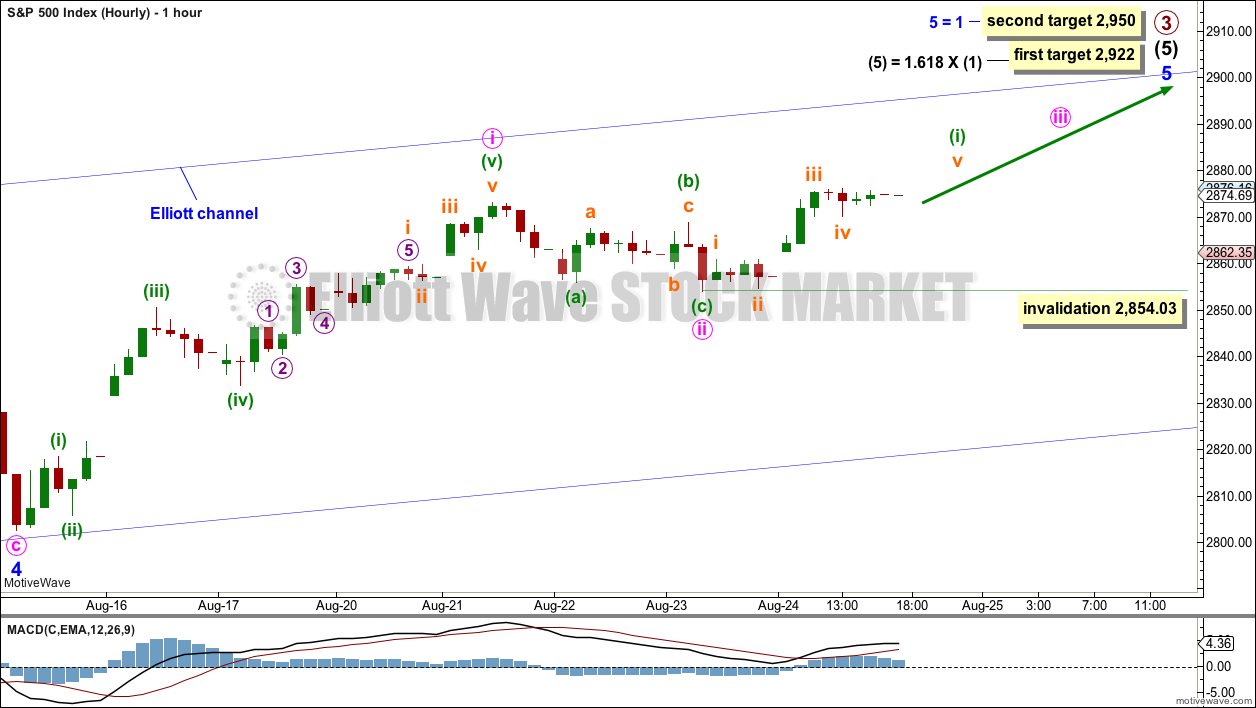
The hourly chart will focus now on minor wave 5.
Minor wave 5 may unfold as either an impulse or an ending diagonal. An impulse is more likely.
So far minute waves i and ii may be complete. Minute wave iii may exhibit some increase in upwards momentum next week.
When minute waves i to iv may be complete, then the target may be calculated at a third degree. At that stage, the target may widen to a small zone or it may change.
TECHNICAL ANALYSIS
WEEKLY CHART
Click chart to enlarge. Chart courtesy of StockCharts.com.
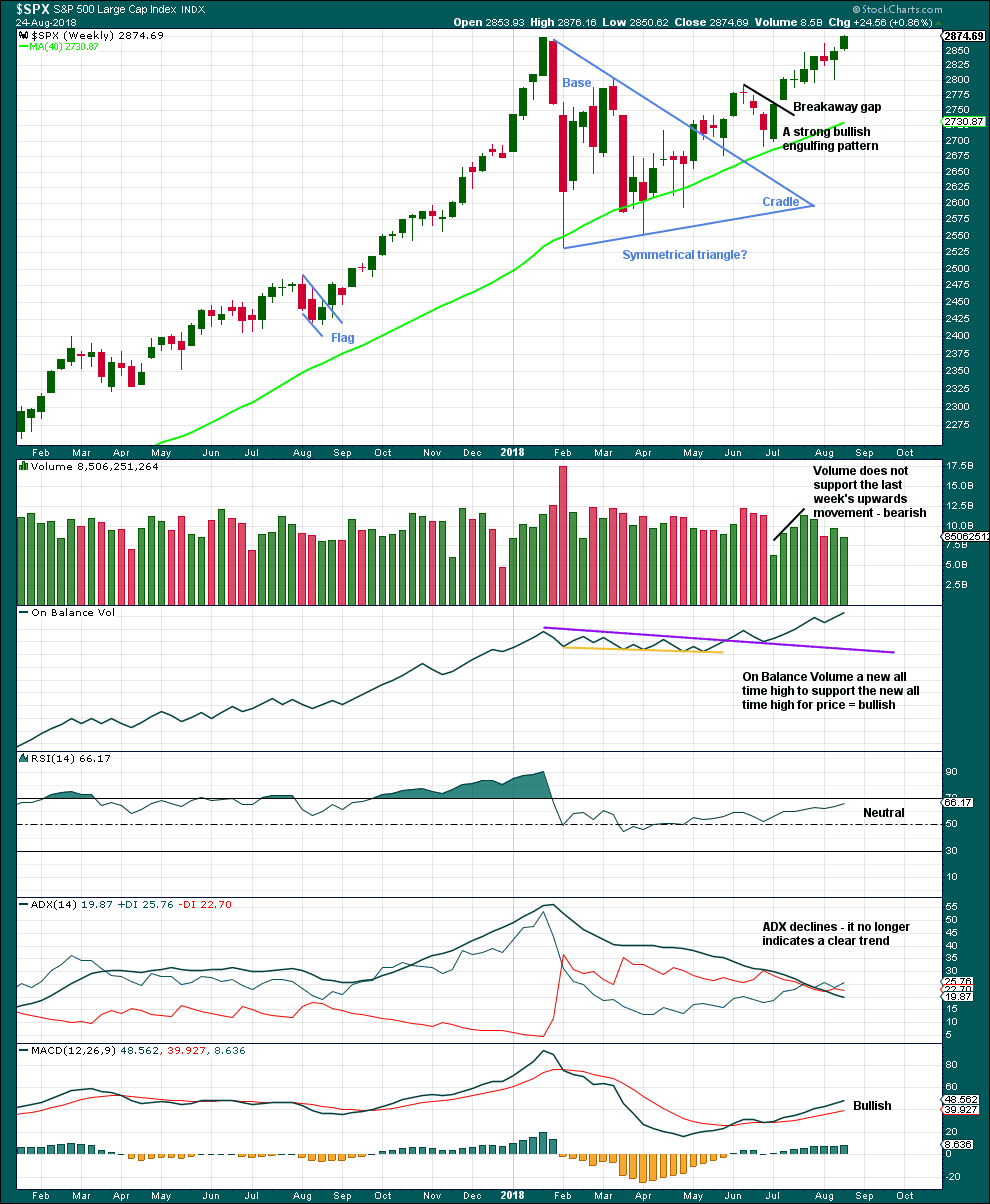
The symmetrical triangle may now be complete. The base distance is 340.18. Added to the breakout point of 2,704.54 this gives a target at 3,044.72. This is above the Elliott wave target at 2,922, so the Elliott wave target may be inadequate.
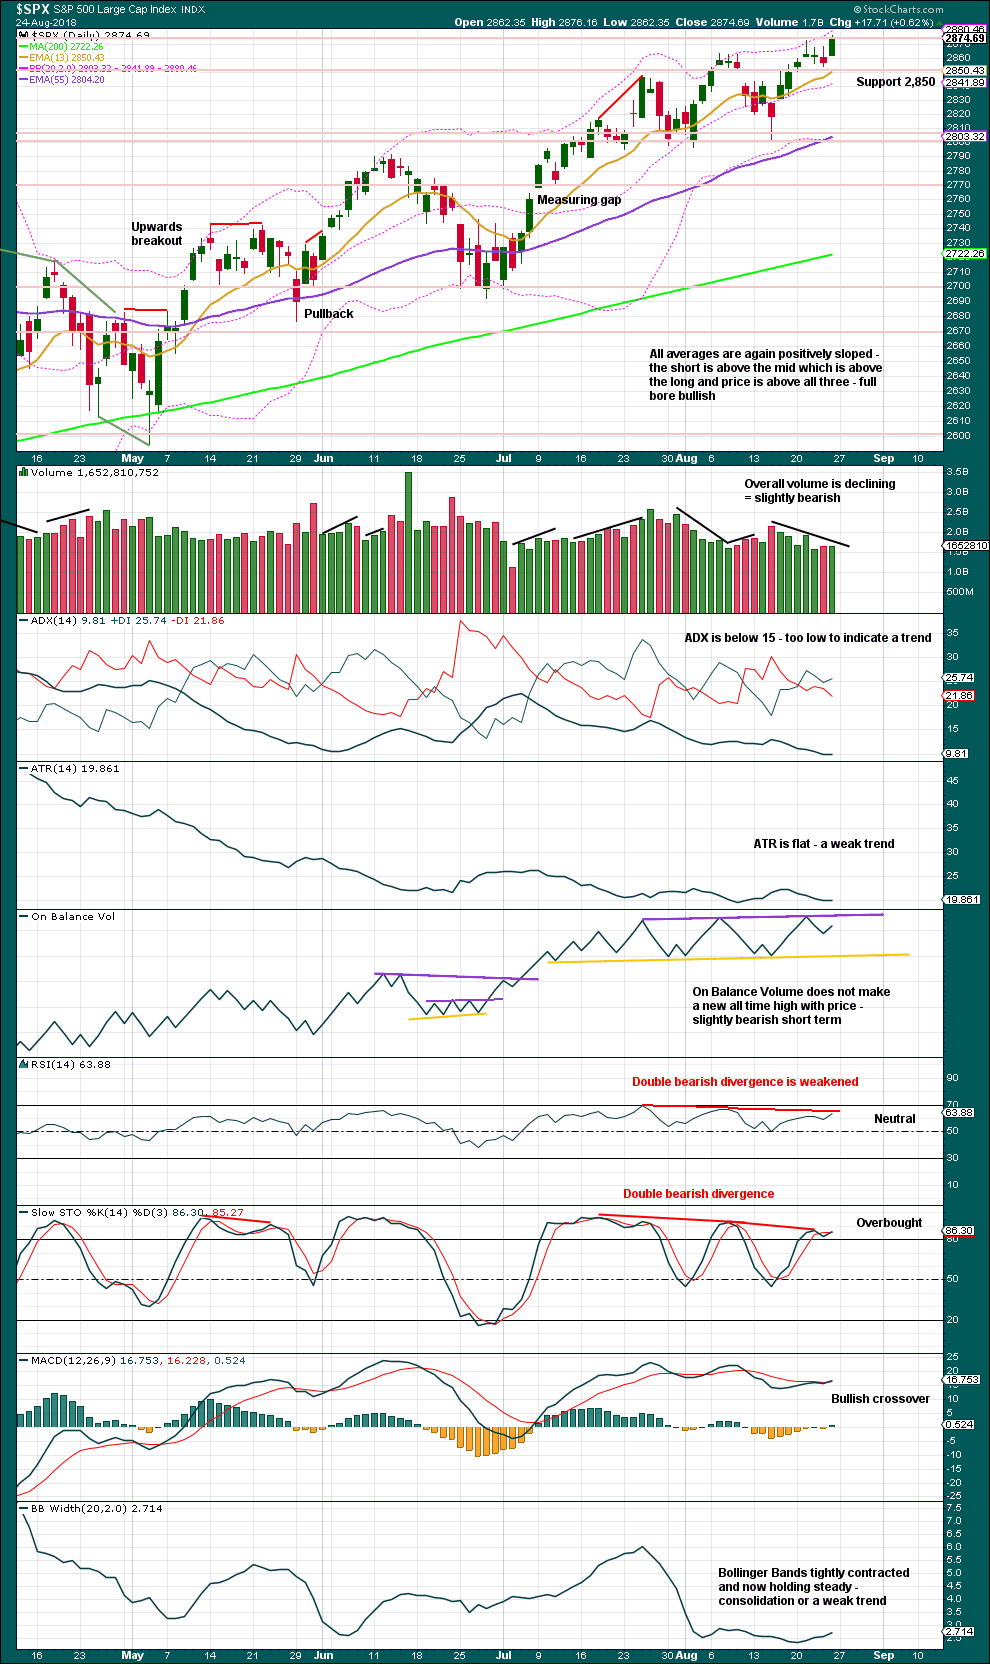
A new all time high for price has support from another new all time high from On Balance Volume at the weekly chart level, although not at the daily chart level. This is bullish.
Price can rise in current market conditions on light and declining volume for a reasonable period of time, so lighter volume this week does not mean that the rise in price is unsustainable for the short or mid term.
DAILY CHART
Click chart to enlarge. Chart courtesy of StockCharts.com.
Since the low on the 2nd of April, 2018, price has made a series of higher highs and higher lows. This is the definition of an upwards trend. But trends do not move in perfectly straight lines; there are pullbacks and bounces along the way.
Price has closed at a new all time high with a little support from volume. This is extremely bullish. Look now for support about 2,850.
When On Balance Volume gets up to resistance, then a small consolidation or pullback may develop there. A break above resistance would be another bullish signal.
VOLATILITY – INVERTED VIX CHART
WEEKLY CHART
Click chart to enlarge. Chart courtesy of StockCharts.com. So that colour blind members are included, bearish signals
will be noted with blue and bullish signals with yellow.
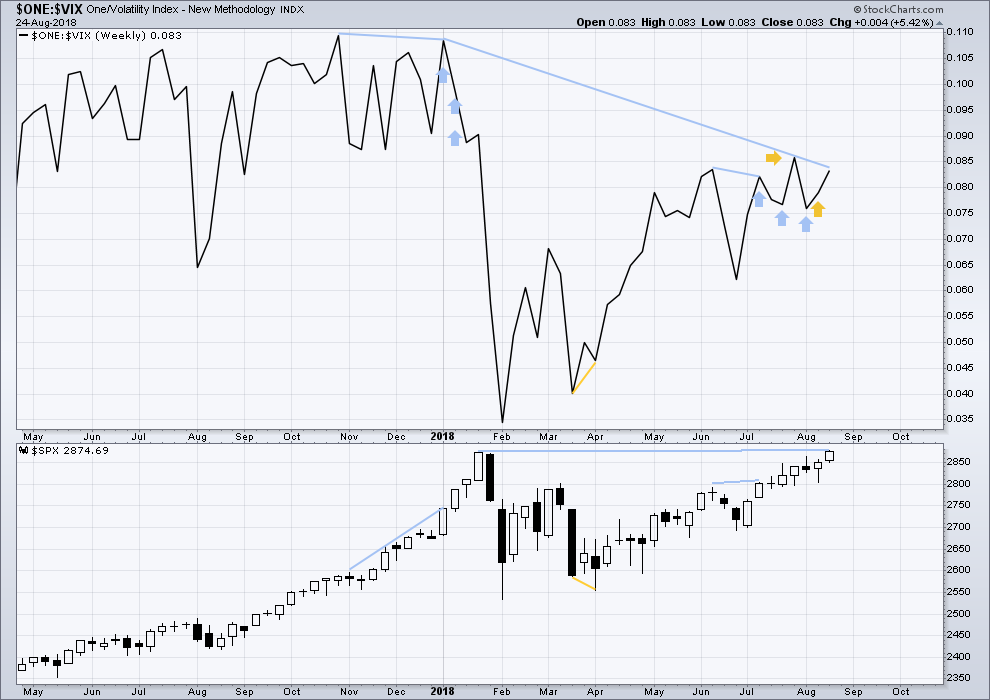
To keep an eye on the all time high for inverted VIX a weekly chart is required at this time.
Notice how inverted VIX has very strong bearish signals four weeks in a row just before the start of the last large fall in price. At the weekly chart level, this indicator may be useful again in warning of the end of primary wave 3.
At this time, there is mid term bearish divergence between price and inverted VIX: price has made a new all time high, but inverted VIX has not. This divergence may persist for some time and may remain at the end of primary wave 3.
For the short term, upwards movement this week had support from a decline in market volatility. There is no very short term divergence.
DAILY CHART
Click chart to enlarge. Chart courtesy of StockCharts.com. So that colour blind members are included, bearish signals
will be noted with blue and bullish signals with yellow.
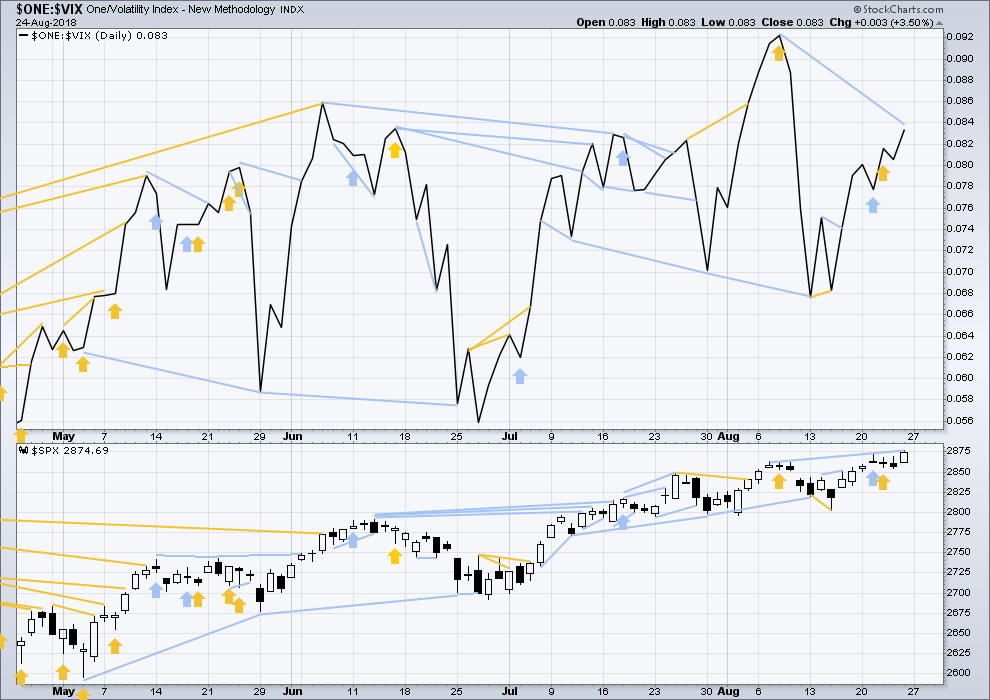
Normally, volatility should decline as price moves higher and increase as price moves lower. This means that normally inverted VIX should move in the same direction as price.
Last noted bullish short term divergence has now been followed by upwards movement in price, so it may now be resolved.
There is mid term divergence with a new all time high from price not supported by a corresponding new all time high from inverted VIX. This divergence is bearish.
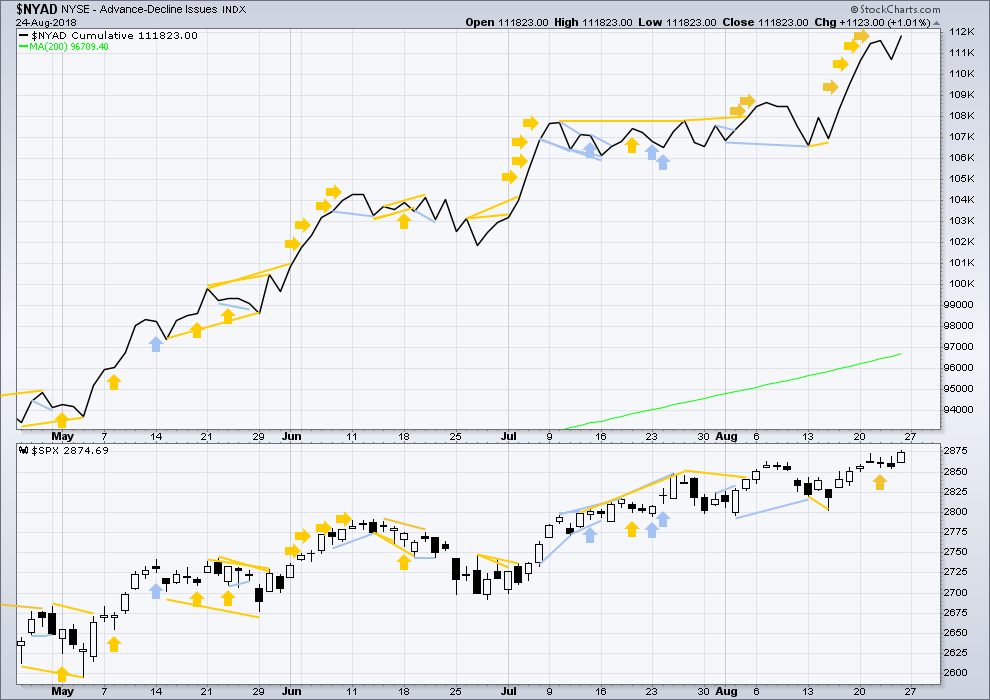
BREADTH – AD LINE
WEEKLY CHART
Click chart to enlarge. Chart courtesy of StockCharts.com.
When primary wave 3 comes to an end, it may be valuable to watch the AD line at the weekly time frame as well as the daily.
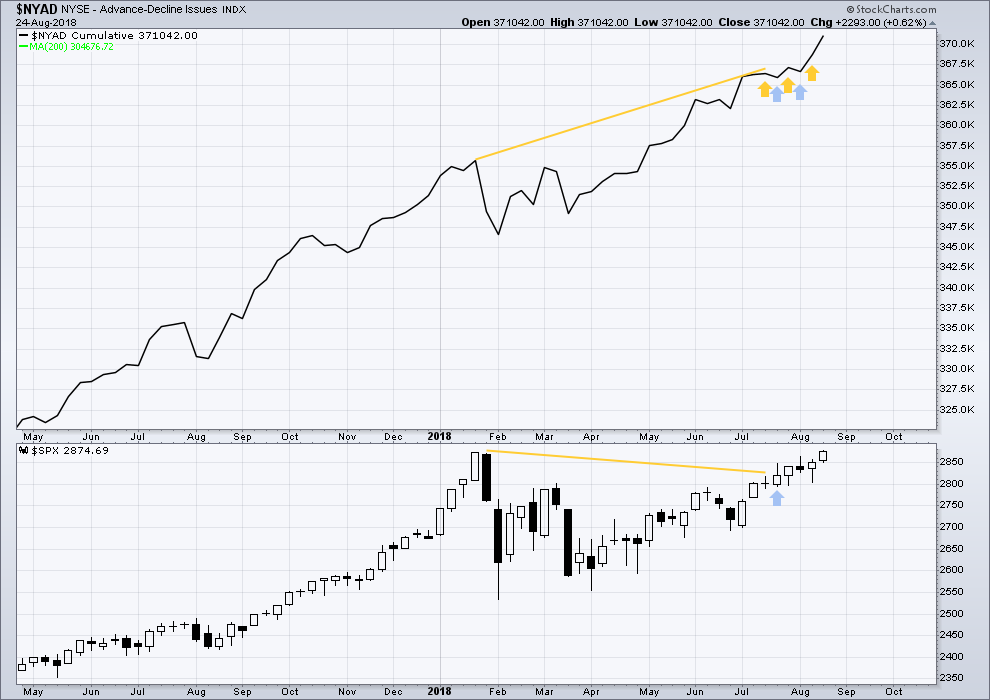
Strong bullish divergence noted between price and the AD line has finally been followed by a new all time high from price. This divergence may now be resolved, or it may be followed by more upwards movement.
DAILY CHART
Click chart to enlarge. Chart courtesy of StockCharts.com.
There is normally 4-6 months divergence between price and market breadth prior to a full fledged bear market. This has been so for all major bear markets within the last 90 odd years. With no longer term divergence yet at this point, any decline in price should be expected to be a pullback within an ongoing bull market and not necessarily the start of a bear market. New all time highs from the AD line means that any bear market may now be an absolute minimum of 4 months away. It may of course be a lot longer than that. My next expectation for the end of this bull market may now be October 2019.
Breadth should be read as a leading indicator.
The new all time high from price at the end of the week has support from rising market breadth. There is no divergence, which is bullish.
Both large and small caps made a new all time high on Friday but mid caps did not. Mid caps may follow through next week.
Large caps have been the last to make a new all time high; it is normal for large caps to lag in the latter stages of a bull market. This bull market is very aged, but it is not over yet.
DOW THEORY
The following lows need to be exceeded for Dow Theory to confirm the end of the bull market and a change to a bear market:
DJIA: 23,360.29.
DJT: 9,806.79.
S&P500: 2,532.69.
Nasdaq: 6,630.67.
Nasdaq and DJT and now the S&P500 have all made recent new all time highs. For Dow Theory confirmation of the ongoing bull market, DJIA needs to make a new all time high.
Charts showing each prior major swing low used for Dow Theory may be seen at the end of this analysis here.
Published @ 02:46 a.m. EST on 25th August, 2018.
Wow, 2950 is NOT that far away. And structurally, it looks like the final minor 5 will be over when price likely gets there, to me at the moment anyway. That’s all coming faster than I expected. The start of a primary 4 is NOT an event that can be slept through! Thinking through how to manage this…
After today, it seems pretty safe to be long equity markets for now. Everything seemed to be up today. Of course Lara has been telling us about both the OBV and AD giving us all time highs…
Just to follow up on TLT/ZB, what’s your target for a down movement Kevin? Any clusters of Fibo numbers, or a trend line target? Looking at the chart, there seems to be good support around 120, so thinking of selling some of my shorts at that level…
The first target looks too close by now. The second target is looking better.
Following up on Bo’s comment below: I looked back at the start of intermediate 4 wave, and Lara’s EW analysis was expecting up to January 26 to keep going to 2896, and then 2951if it got past that… Then in hindsight only, some made comments how from January 22 through 25, both SPX and VIX generally increased together. Then the market topped on January 26, and we all know what happened after that.
Also on January 26, there was divergence between SPX price and AD line…
That’s it. That was all the warning we had before a VIX spike from 11 to 50.
Does anyone have any other input on impending signs of intermediate 4? That might help all of us look into upcoming warning signs for the start of primary 4…
VIX gave a strong warning of intermediate (4) with three weeks of decline as price moved strongly higher (weekly chart).
On the daily chart, VIX had a few days of rising price and increasing volatility (declining inverted VIX). At the high on the daily chart there was strong triple bearish divergence between the two.
And you’re right, apart from VIX behaviour there really wasn’t any warning of intermediate (4). On the price chart (with indicators) everything looked very bullish.
It’s not going to be helpful in accurate timing, but if we see it again then we know to keep stops on long positions tight and be prepared for primary 4 to begin at any time.
Well, price itself was going absolutely exponential for a few weeks leading up to that Jan 28 top. If price goes virtually straight up here to 2950, AND the VIX keeps diverging, it’s going to be looking extremely similar. Certainly I’m going to be getting lighter and lighter as price gets up to our target here.
I’ll certainly be on the lookout for that to happen again.
But I’m also aware that the market rarely behaves exactly the same. Next time, there will probably be something different.
And there’s no way to know what that might be, I just have to keep an open mind and weigh all the evidence as objectively as I can.
anybody watching AMD?
wasn’t…but I will now after buying some cheap oom puts expiring friday. Why not??!!!
EEM very close to breaking a major down trend line on the daily chart. EEM options market is extremely liquid. This could be an interesting area for a butterfly, try to profit between those two 38% fibos? Because I expect price to oscillate here.
VIX maintaining a green print. Not what the bulls want to see here. Let’s see if they can change that by the close.
Interesting. If that happens for a few days, it will be a strong clue primary 4 may be about to begin.
2900 SPX today? I think there is a good chance seeing as we are only a handful of points away.
Pretty close… only short by 1.75
2891.5 is a 1.272 fibo, SPX is right there at the moment. Similarly, RUT has paused just under a 1.272 at 1734.6.
Above that I don’t have anything until the 2922 area with 1.618 targets.
bull rush going today! 3 up action. Been awhile!!!
Wow, Spooz up almost 8 handles already! Is it 2017 again?
Just want to give a big thanks to Lara for maintaining a rational outlook through all of this sticking to the core EW and TA principles, as always. I really like the no-nonsense scientific approach focusing on price action only and ignoring the constant drama from the financial media.
Thanks Bo.
I don’t read it actually, so it’s easy if one ignores the noise to not be influenced by it.
Well, I do read a very little of it. Mostly local NZ stuff though.
My most important takeaway from the new state of the SPX EW count is…
A primary 4 COULD start up at any time. And a primary 4 isn’t your garden variety sell off. We can see this one is likely to be well over -11%. Let’s not let that one sneak up on us, eh?
Once again, kudos to you Lara for guiding us here to new ATH’s after that “fascinating” intermediate 4 ride through a giant triangle. Your clarity on where we were in the big picture was firm and correct even as much of the analyst world was yelling “market top”. Very nicely done!
Here here. Well said.
Or is it “Hear. Hear. Well said.”
Or is it “Hair. Hair. Well said.”
Whatever. Well said Kevin.
I might add that the next 4th wave to come is Primary 4 which is higher degree than the Intermediate 4 triangle we just finished. It will be Primary 4 of Cycle V of Super Cycle (5) of Grand Super Cycle I.
If I recall properly, 4th waves tend to go into the price territory of the previous 4th wave of one lesser degree. If this is correct, then we can expect Primary 4 to bottom somewhere between 2550 and 2850 SPX. How about the apex of Intermediate 4 triangle at roughly 2600?
Weekly chart. The gray ellipse marks what I think is the first high probability zone for a top of the primary 3 and start of primary 4 down. Massive cluster of fibo extensions from 2945 to 2775. I’ve got 3 incrementally steeper channels sketched in, and the two horizontal white lines are Lara’s targets. In week 3 of strong uptrend at weekly tf. Price now riding solidly on top of the 5 period weekly ema (white line) and shoving up against upper 21 period keltner/bollinger.
Funny how the most bullish period is also quickly becomes the most dangerous.
Eeehh…Are we forgetting something here Doc?!
Thanks Kevin.
The smaller corrections are tricky, but at this time I am very confident that this bull market is not over.
Now, my next trick, is to try and be as accurate as I can in letting you all know when primary wave 4 has arrived.
Hi Lara,
The fact that the respective fourth waves of minute [ii] and minor 2 were both shorter in time is ok?
I know it’s a guideline, not a rule.
Thanks
Peter
For this market, absolutely fine.
Hi Kevin,
Do you see the break down of ZB on the hourly as a false signal? It seems to be back up over the hourly trend line the way I’ve drawn it, but I can also redraw it as a back test of the trend line too…
Appears at the moment that perhaps /ZB is rolling over Ari. Lots of “churn at the top”!!
Yes I see that, thanks Kevin. Do you have any targets below such as fibo clusters or trend lines?
Im seeing some support around 120 area, so thinking about reducing my short position there…
Good day Lara. Hoping you have a great weekend.
Thanks for the great analysis. I have a question for you. What do you use for your mid-cap equities reference. I use SCHM which is Schwab US Mid-Cap ETF. It made a new ATH yesterday. Because you noted the mid caps did not make a new high is the reason I ask.
Again, have a great weekend.
Hi Rodney
I’m using StockCharts $MID: S&P400 Mid Cap Index
I expect their failure to make another new ATH is going to be very short lived.
I’m having an okay weekend, we might just have a tiny longboard wave for me to play on and that would turn it into an awesome weekend.
I hope you found that perfect wave.
Sadly, no. But we’re on our way to Gisborne later this week to visit good friends. And Gizzy usually gives us something.