A red daily candlestick fits expectations of overall downwards movement for the session.
An outside day remains below the last high.
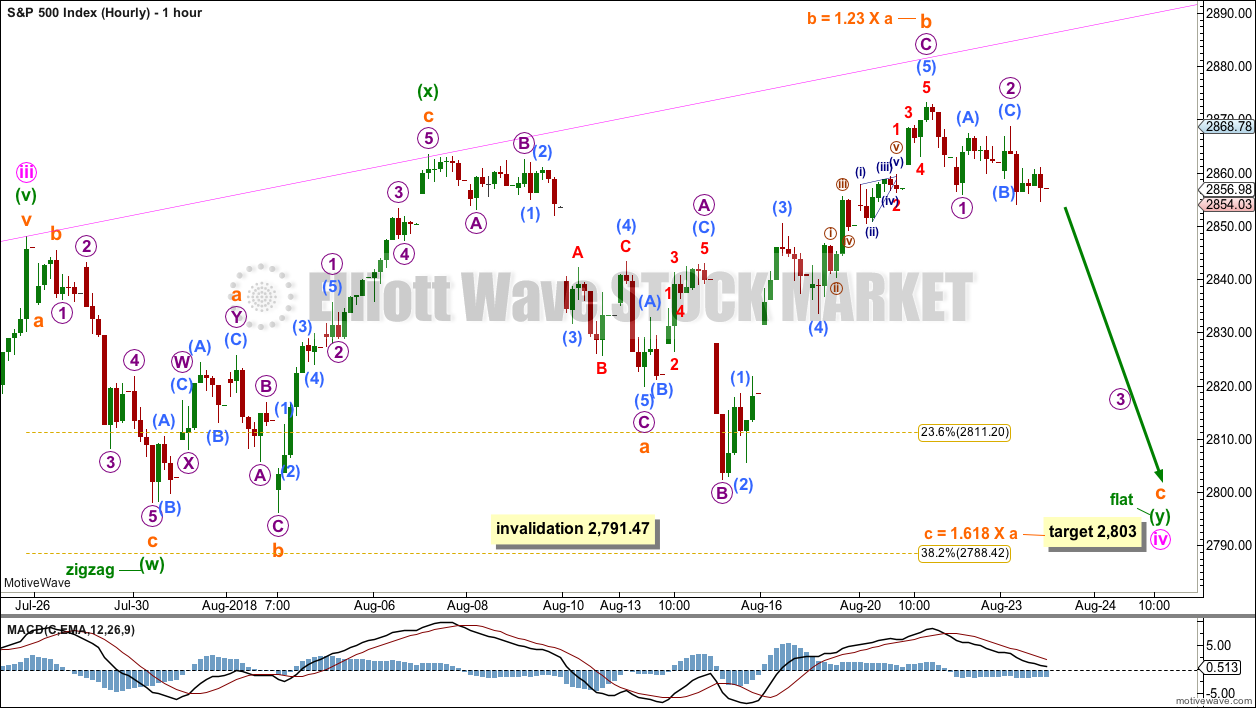
Summary: A Gravestone Doji at the last high, weak volume for upwards movement, and a bearish signal from On Balance Volume all give a warning that a pullback may unfold here. If it does, then the target for it to end is now at 2,803.
The bigger picture remains extremely bullish with recent new all time highs for both On Balance Volume and the AD line.
The mid to longer term target is at 2,922 (Elliott wave) or 3,045 (classic analysis). Another multi week to multi month correction is expected at one of these targets.
The final target for this bull market to end remains at 3,616.
Always practice good risk management. Always trade with stops and invest only 1-5% of equity on any one trade.
New updates to this analysis are in bold.
The biggest picture, Grand Super Cycle analysis, is here.
Last historic analysis with monthly charts is here, video is here.
ELLIOTT WAVE COUNT
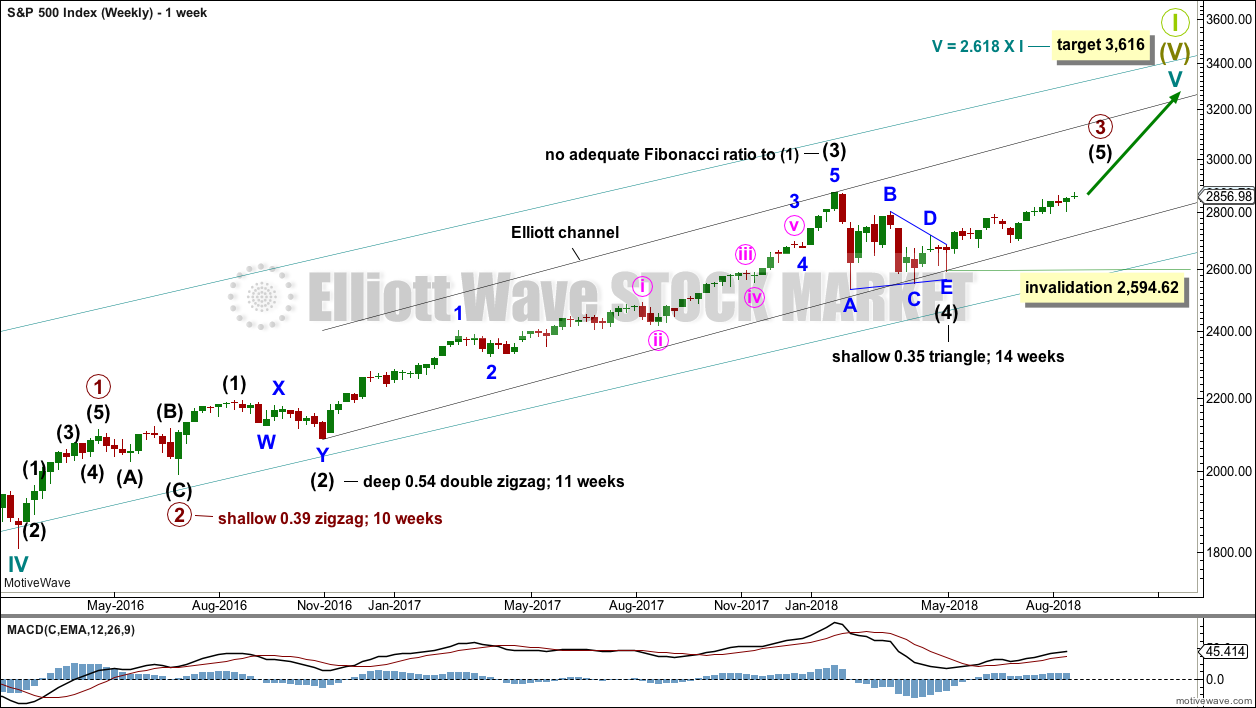
WEEKLY CHART
Cycle wave V must complete as a five structure, which should look clear at the weekly chart level and also now at the monthly chart level. It may only be an impulse or ending diagonal. At this stage, it is clear it is an impulse.
Within cycle wave V, the third waves at all degrees may only subdivide as impulses.
Intermediate wave (4) has breached an Elliott channel drawn using Elliott’s first technique. The channel is redrawn using Elliott’s second technique: the first trend line from the ends of intermediate waves (2) to (4), then a parallel copy on the end of intermediate wave (3). Intermediate wave (5) may end either midway within the channel, or about the upper edge.
Intermediate wave (4) may now be a complete regular contracting triangle lasting fourteen weeks, one longer than a Fibonacci thirteen. There is perfect alternation and excellent proportion between intermediate waves (2) and (4).
Within intermediate wave (5), no second wave correction may move beyond the start of its first wave below 2,594.62. However, the lower edge of the black Elliott channel drawn across the ends of intermediate degree waves should provide very strong support for any deeper pullbacks, holding price well above the invalidation point while intermediate wave (5) unfolds.
At this stage, the expectation is for the final target to me met in October 2019. If price gets up to this target and either the structure is incomplete or price keeps rising through it, then a new higher target would be calculated.
A multi week to multi month consolidation for primary wave 4 is expected on the way up to the final target.
The last bullish fifth wave of minor wave 5 to end intermediate wave (3) exhibited commodity like behaviour. It was strong and sustained. It is possible that the upcoming wave of minor wave 5 to end intermediate wave (5) to end primary wave 3 may exhibit similar behaviour, so we should be on the lookout for this possibility.
DAILY CHART
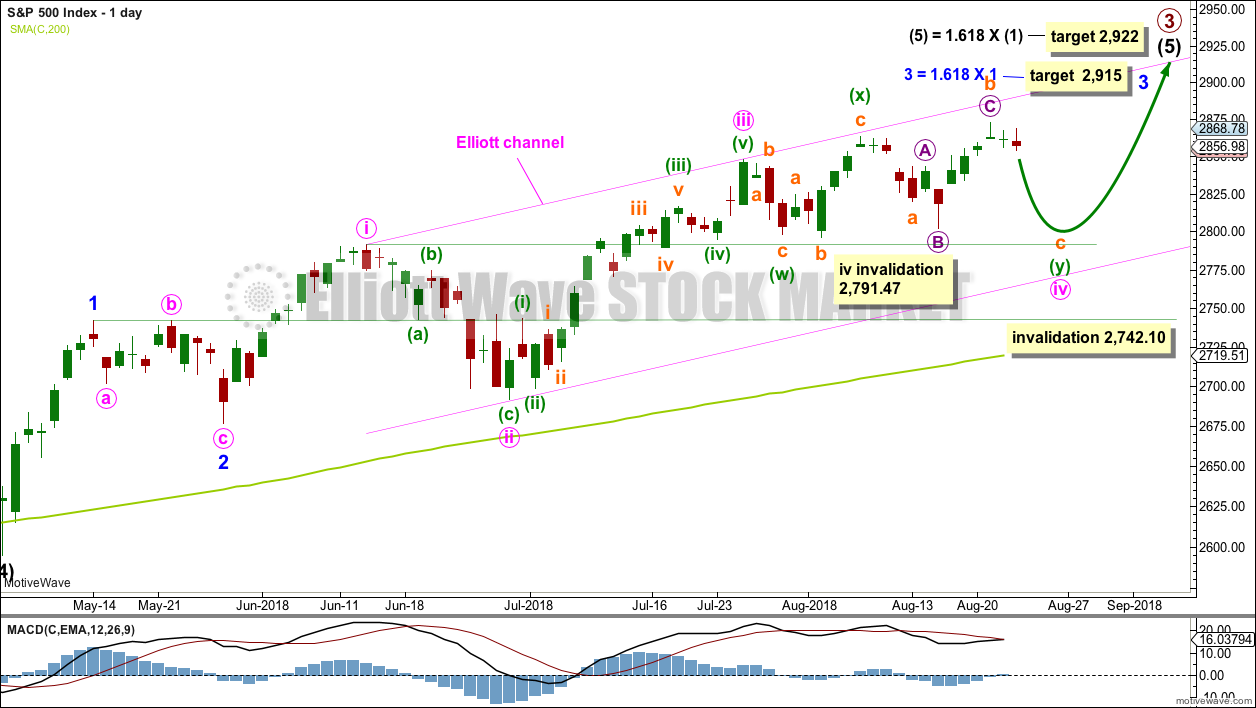
Intermediate wave (5) would be very likely to make at least a slight new high above the end of intermediate wave (3) at 2,872.87 to avoid a truncation.
Intermediate wave (3) exhibits no Fibonacci ratio to intermediate wave (1). It is more likely then that intermediate wave (5) may exhibit a Fibonacci ratio to either of intermediate waves (1) or (3). The most common Fibonacci ratio would be equality in length with intermediate wave (1), but in this instance that would expect a truncation. The next common Fibonacci ratio is used to calculate a target for intermediate wave (5) to end.
Intermediate wave (5) is unfolding as an impulse, and within it minor waves 1 and 2 are complete.
Minor wave 3 may only subdivide as an impulse. A target is calculated for minor wave 3 to end, which expects to see the most common Fibonacci ratio to minor wave 1. Minor wave 3 may last several weeks in total and should look like an impulse at the daily chart level. When it is complete, then minor wave 4 may last about one to two weeks in order for it to exhibit reasonable proportion to minor wave 2. Minor wave 4 may not move into minor wave 1 price territory below 2,742.10.
Within minor wave 3, minute waves i, ii and iii all look complete and minute wave iv may still be incomplete. If minute wave iv were to continue further, then it would have better proportion to minute wave ii and would exhibit alternation in structure. This idea also has support from classic technical analysis.
It still looks most likely that minute wave iv is incomplete. It may end now with a pullback to complete a double combination, which is a reasonably common structure.
It is also possible that minute wave iv was over at the last low and minor wave 3 was over at the last high. A new low below 2,791.47 could not be a continuation of minute wave iv, so the correction at that stage would be labelled minor wave 4.
The channel is drawn using Elliott’s first technique. The upper edge has provided resistance. This channel is copied over to hourly charts.
If price makes a new low below 2,791.47 and keeps on falling, then look for strong support about the lower edge of the Elliott channel on this daily chart; the pullback may end there.
MAIN HOURLY CHART – COMBINATION
The first structure in a possible double combination may be a completed zigzag labelled minuette wave (w).
The double may be joined by a completed three in the opposite direction, an expanded flat labelled minuette wave (x).
The second structure in a possible double combination would be very likely to be a flat correction; the most common two structures to make up a double combination are one zigzag and by a very wide margin one flat.
If minuette wave (y) unfolds as a flat correction, then within it subminuette wave b must retrace a minimum 0.9 length of subminuette wave a (this minimum was met and passed at 2,780.69). Subminuette wave b remains within the most common range for B waves of flats from 1 to 1.38 times the length of subminuette wave a.
The Gravestone doji at the high is a strong warning of weakness ahead. For this reason, this is the main wave count.
Minuette wave (y) would be most likely to end about the same level as minuette wave (w) at 2,798, so that the whole structure has a typical sideways look. The purpose of second structures in a combination is to take up time and move price sideways. Combinations are analogous to flag patterns in classic technical analysis. The target calculated would see minuette wave (y) end close to the end of minuette wave (w).
Within subminuette wave c, micro wave 3 downwards may show some increase in momentum over the next day or so.
This possible combination may take a few more days to complete. Support about 2,800 would be expected to hold.
ALTERNATE HOURLY CHART
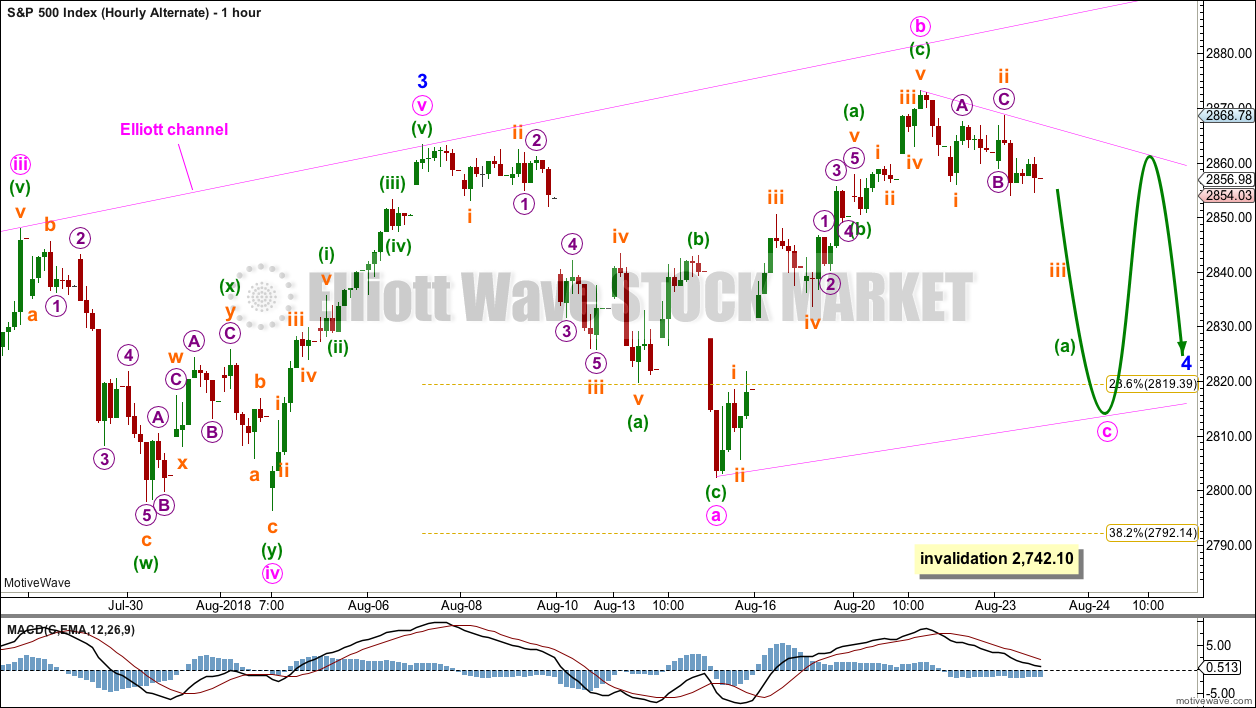
Here, the degree of labelling within minute wave iv is moved up one degree.
It is possible that minute wave iv could be over more quickly than was expected. If minute wave iv is over, then the possibility of an earlier than expected end to minute wave v must be considered.
Minor wave 3 may have been over at the last high. Minute wave v is seen as a five wave impulse in order for this wave count to work. This does not have as good a fit as the main wave count, which does see this wave as a zigzag.
Minor wave 4 may be an expanded flat, a combination or a running triangle. A triangle or combination would have better alternation with the expanded flat correction of minor wave 2. At this stage, minor wave 4 will be labelled as a possible triangle, but this labelling may change as it unfolds further.
Minor wave 4 may be reasonably expected to last at least about two weeks, and possibly up to about four weeks. It would most likely end somewhere within the fourth wave of one lesser degree; minute wave iv has its range from 2,843.03 to 2,796.34. If it does not end here, then it may end about the 0.382 Fibonacci ratio of minor wave 3 at 2,792.
SECOND ALTERNATE HOURLY CHART
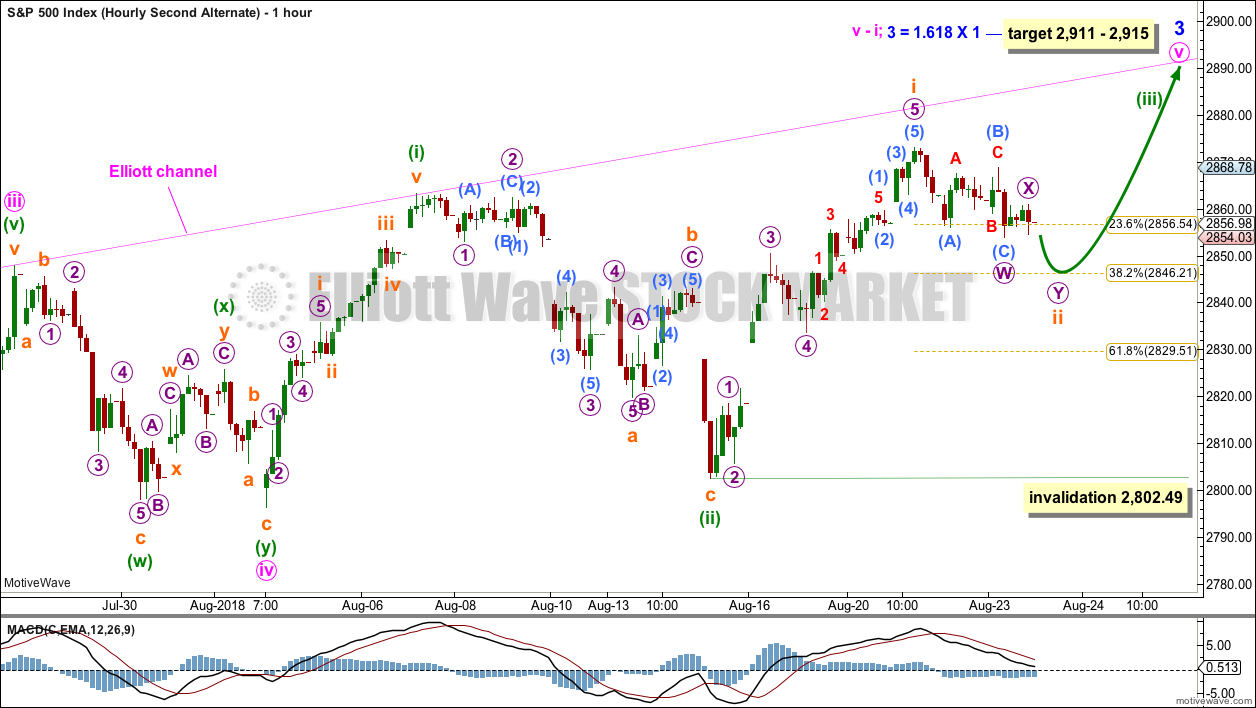
This second alternate wave count moves the degree of labelling within the last upwards wave down one degree. Minute wave v may be incomplete, and only minuette wave (i) within it may be complete.
Minuette wave (ii) is labelled as complete single zigzag.
This wave count expects an increase in upwards momentum as minuette wave (iii) moves higher.
Within minuette wave (iii), the correction for subminuette wave ii may not move beyond the start of subminuette wave i below 2,802.49.
Subminuette wave ii may be unfolding as a small double zigzag. It may end close to the 0.382 Fibonacci ratio of subminuette wave i. At this stage, there may be enough of a strong upwards pull to force subminuette wave ii to be more shallow than second wave corrections usually are.
TECHNICAL ANALYSIS
WEEKLY CHART
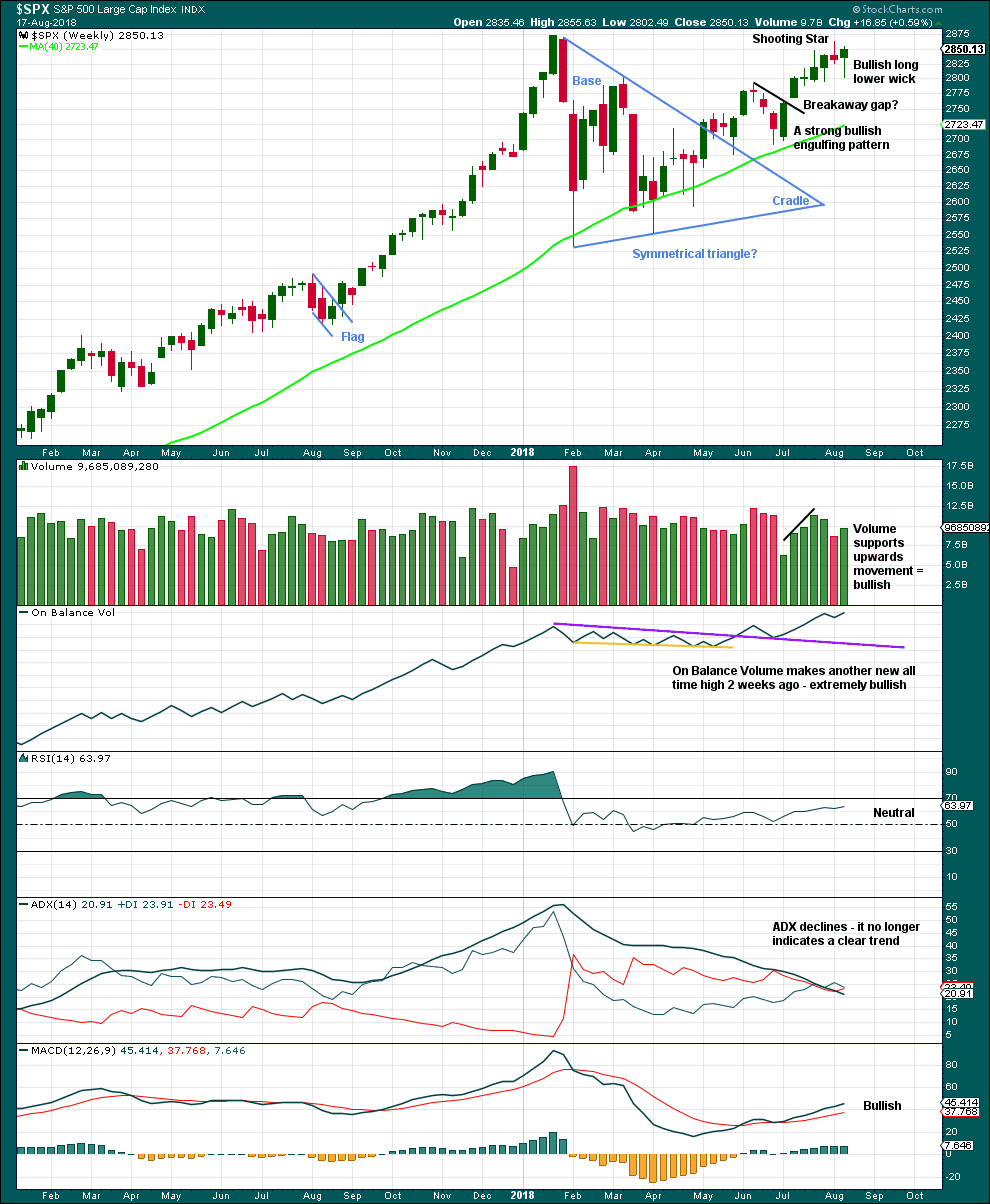
Click chart to enlarge. Chart courtesy of StockCharts.com.
The symmetrical triangle may now be complete. The base distance is 340.18. Added to the breakout point of 2,704.54 this gives a target at 3,044.72. This is above the Elliott wave target at 2,922, so the Elliott wave target may be inadequate.
The Shooting Star candlestick reversal pattern has been followed by a downwards week. It may yet be followed by more downwards movement, but the strength of this last weekly candlestick suggests it may not.
Price moved lower last week, but the balance of volume was upwards and the candlestick closed green. Upwards movement during the week has support from volume, but for clarity we should look inside the week at daily volume bars.
The long lower wick and a close very close to highs suggests a little more upwards movement this week.
DAILY CHART
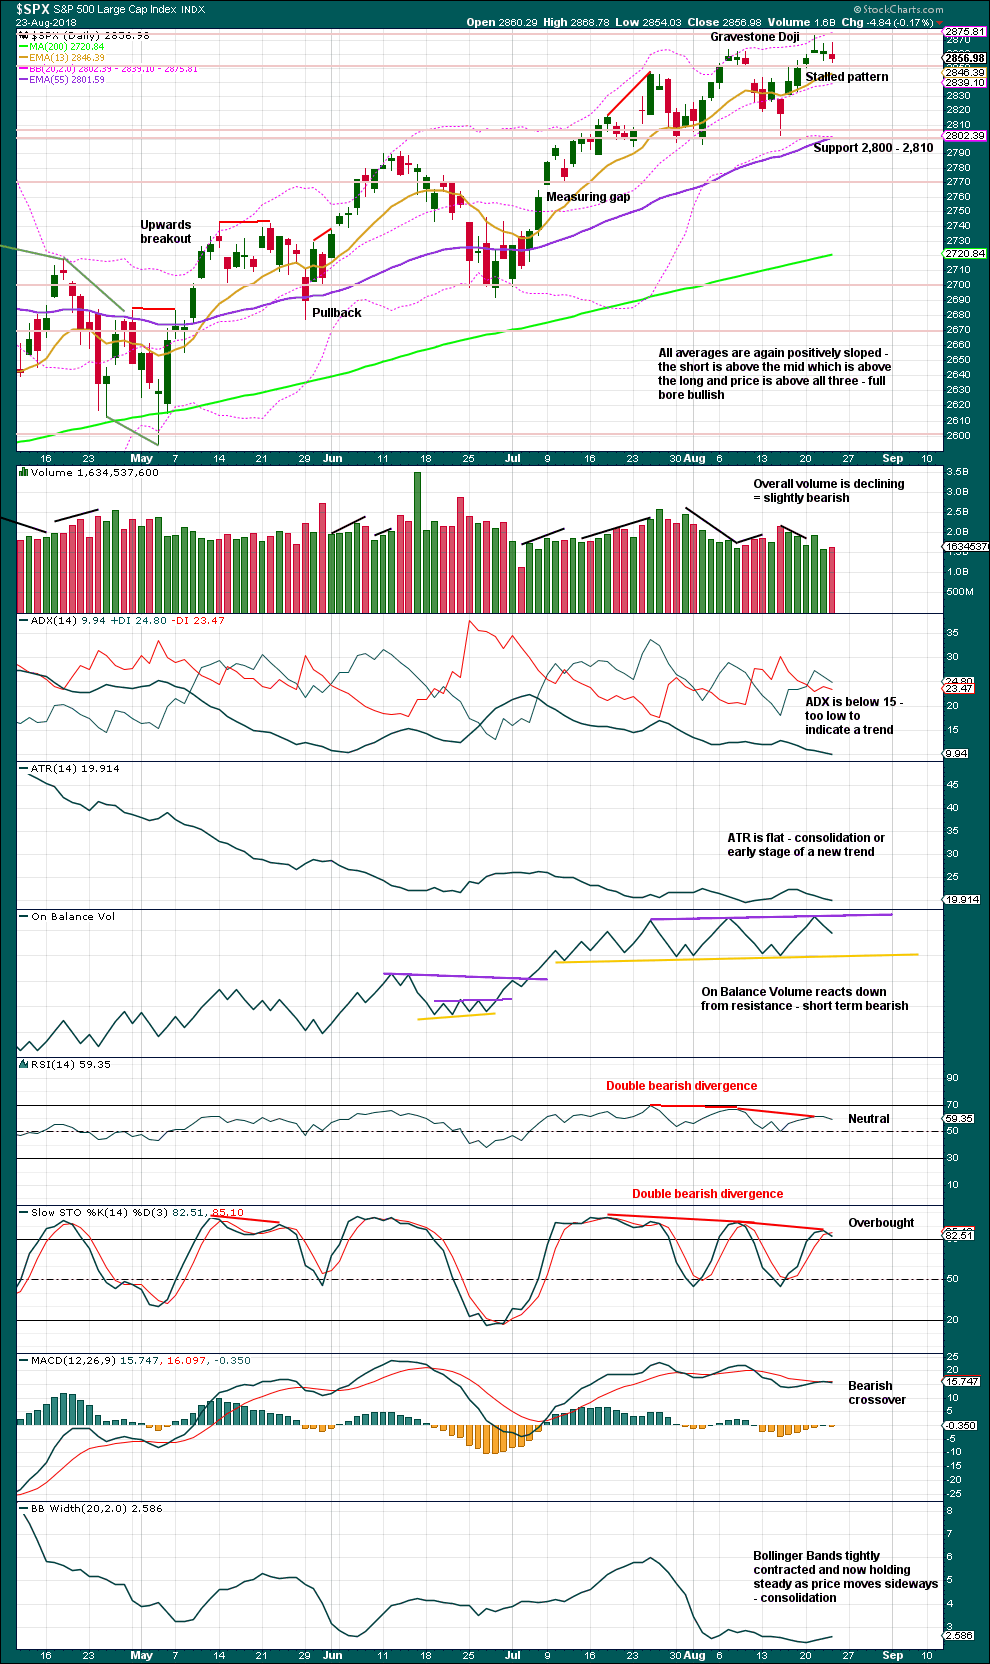
Click chart to enlarge. Chart courtesy of StockCharts.com.
Since the low on the 2nd of April, 2018, price has made a series of higher highs and higher lows. This is the definition of an upwards trend. But trends do not move in perfectly straight lines; there are pullbacks and bounces along the way.
Support about 2,800 remains very strong with three recent tests and no close below this point. Each test of this support area strengthens its technical significance.
Support at the yellow line for On Balance Volume has now been tested five times. This line now has very reasonable technical significance. On Balance Volume has a new range. A breakout would provide a signal.
It is noted for each of the last few reasonable pullbacks, On Balance Volume had made new highs on the day of the high or the day immediately prior: on the 18th of April, 14th of May, 12th of June, 25th of July, and the 7th of August. A new high on Friday may yet be followed by a pullback.
The Gravestone Doji in conjunction with declining volume at the last high and a bearish signal from On Balance Volume suggest that a pullback may continue here. Look for good support about 2,800.
A long upper wick and some support from volume today suggest a downwards day tomorrow.
There is bearish divergence here between price and both of Stochastics and RSI. Only a little weight is given to this divergence, because sometimes it just disappears.
VOLATILITY – INVERTED VIX CHART
WEEKLY CHART
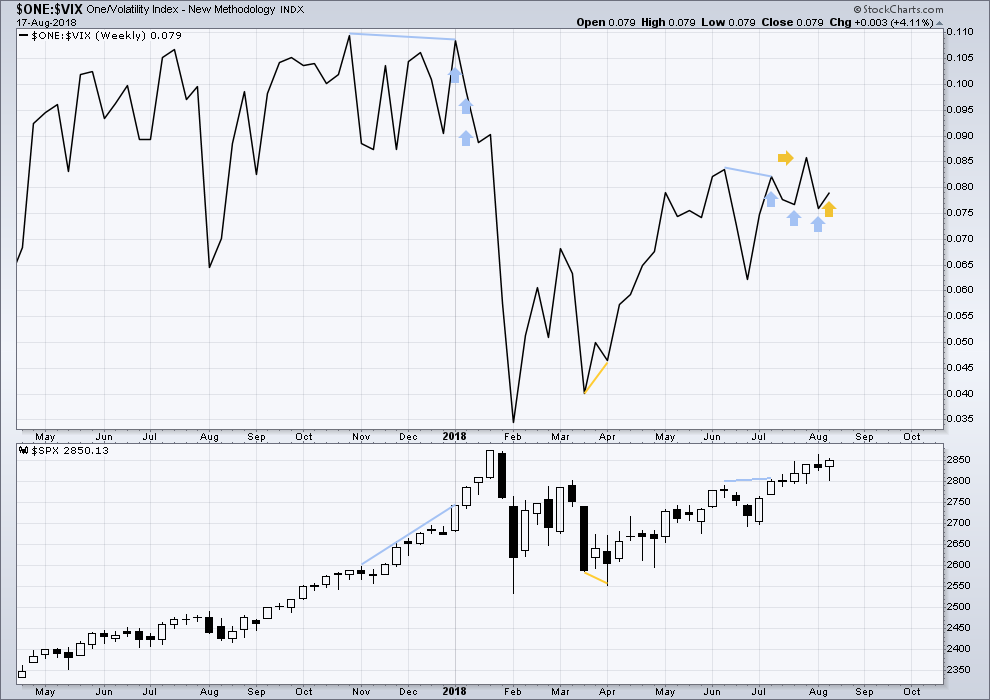
Click chart to enlarge. Chart courtesy of StockCharts.com. So that colour blind members are included, bearish signals
will be noted with blue and bullish signals with yellow.
To keep an eye on the all time high for inverted VIX a weekly chart is required at this time.
Notice how inverted VIX has very strong bearish signals four weeks in a row just before the start of the last large fall in price. At the weekly chart level, this indicator may be useful again in warning of the end of primary wave 3.
Some bearish divergence was noted two weeks ago. This has now been followed by a downwards week, so it may now be resolved.
Price moved lower for the last week, but inverted VIX moved higher. This divergence is bullish.
Inverted VIX is still some way off from making a new all time high.
DAILY CHART
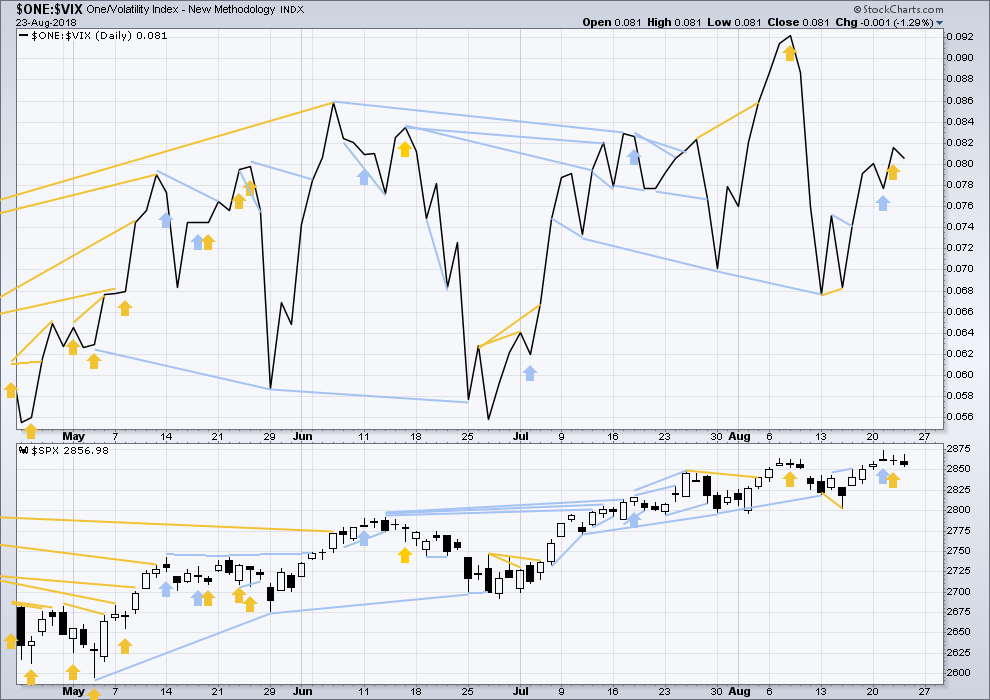
Click chart to enlarge. Chart courtesy of StockCharts.com. So that colour blind members are included, bearish signals
will be noted with blue and bullish signals with yellow.
Normally, volatility should decline as price moves higher and increase as price moves lower. This means that normally inverted VIX should move in the same direction as price.
Last noted mid term bearish divergence has not been followed yet by more downwards movement. It may still indicate downwards movement ahead as there is now a cluster of bearish signals from inverted VIX.
Bullish divergence noted in yesterday’s analysis has not yet been followed by any reasonable upwards movement and has been only followed by an outside day that closed red. There is no new divergence today.
BREADTH – AD LINE
WEEKLY CHART
Click chart to enlarge. Chart courtesy of StockCharts.com.
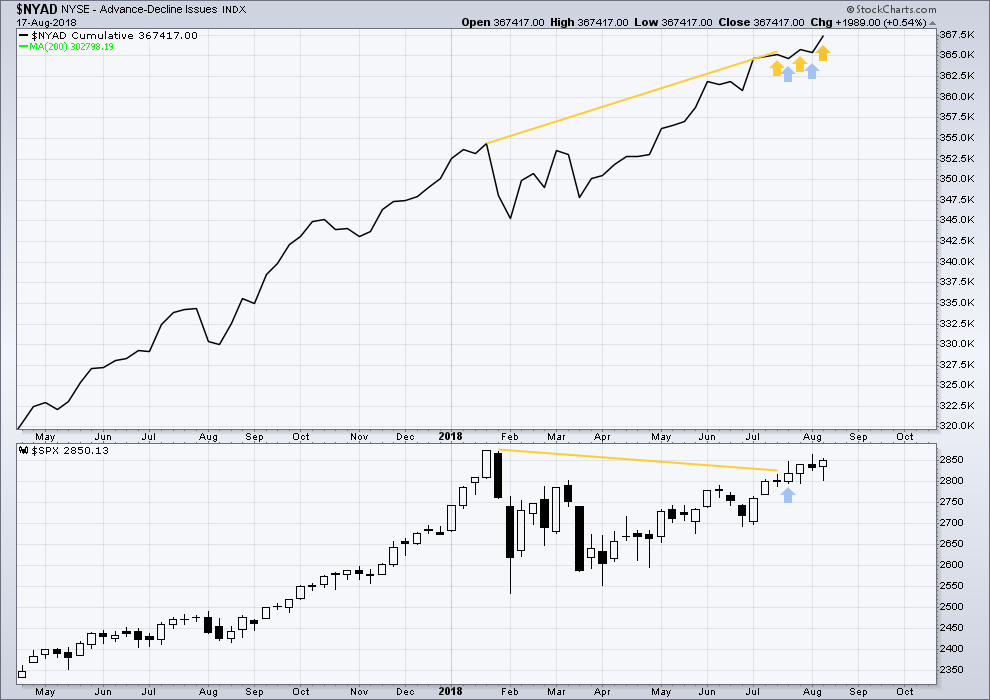
When primary wave 3 comes to an end, it may be valuable to watch the AD line at the weekly time frame as well as the daily.
At this stage, there is very strong bullish divergence between price and the AD line at the weekly time frame. With the AD line making new all time highs, expect price to follow through with new all time highs in coming weeks.
Another new all time high from the AD line last week is extremely bullish.
DAILY CHART
Click chart to enlarge. Chart courtesy of StockCharts.com.
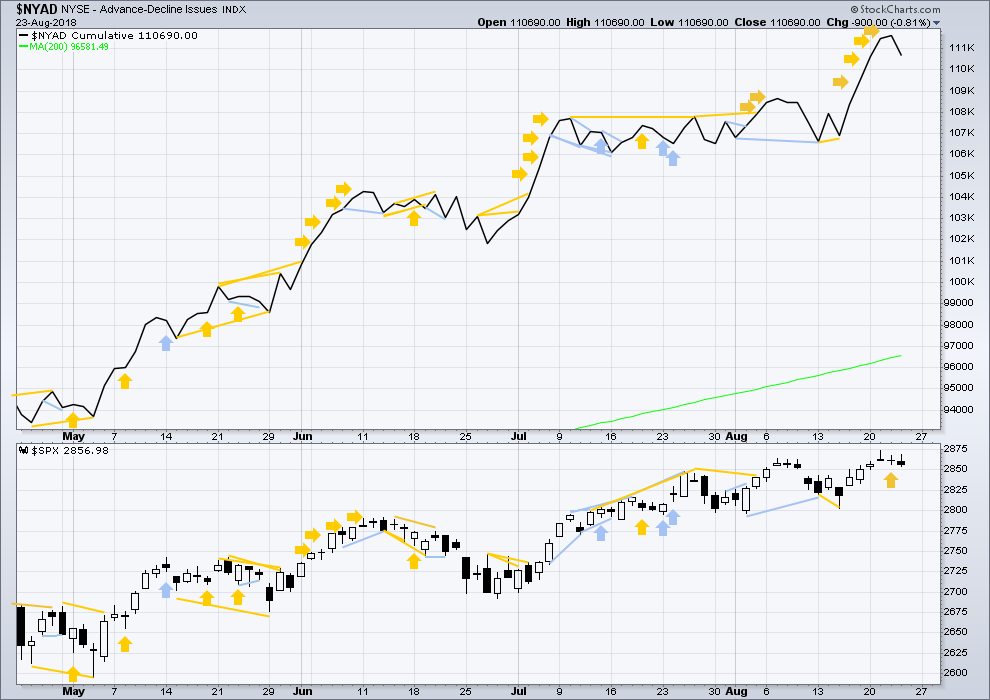
There is normally 4-6 months divergence between price and market breadth prior to a full fledged bear market. This has been so for all major bear markets within the last 90 odd years. With no longer term divergence yet at this point, any decline in price should be expected to be a pullback within an ongoing bull market and not necessarily the start of a bear market. New all time highs from the AD line means that any bear market may now be an absolute minimum of 4 months away. It may of course be a lot longer than that. My next expectation for the end of this bull market may now be October 2019.
Breadth should be read as a leading indicator.
Weak bullish divergence noted in yesterday’s analysis has not yet been followed by any reasonable upwards movement. Downwards movement within today’s session has good support from declining market breadth; this is bearish for the short term.
Both small and mid caps have made new all time highs on the 21st of August. Large caps do tend to lag towards the end of a bull market, so the current situation with large caps yet to make a new all time high absolutely should be expected towards the end of a mature and ageing bull market.
DOW THEORY
The following lows need to be exceeded for Dow Theory to confirm the end of the bull market and a change to a bear market:
DJIA: 23,360.29.
DJT: 9,806.79.
S&P500: 2,532.69.
Nasdaq: 6,630.67.
Nasdaq and DJT have both made recent new all time highs. For Dow Theory confirmation of the ongoing bull market, DJIA needs to make a new all time high.
Charts showing each prior major swing low used for Dow Theory may be seen at the end of this analysis here.
Published @ 08:07 p.m. EST.

Have a great weekend everybody!
If you don’t subscribe to Lara’s Gold analysis…now would be great time to dip a toe, (or two), in the water! 🙂 🙂 🙂
Is this good for me?
Are the number of smiles a hint?
The second alternate hourly will be the main count today.
I’ll take a look for alternates. One idea I have is it is possible also that minor 3 and 4 are over, and now minor 5 up is unfolding.
Now that we have a new all time high on the S&P I’ll expect it to move more strongly higher with support from volume. This may release some pent up energy. There’s unexplored territory above, little resistance.
don’t forget that there’s a 1.27 extension at 2881.8 that is quite likely to at least stall the market for a few hours, and could be a pivot high on the daily.
Here’s to the bull snorting. I hope no one here got caught the wrong way.
No guarantee of a repeat of Sep 17 – Jan 18. But right now…that’s what’s in play. Manage risk, and corrections are an opportunity to join(or add to!) this mega-trend, which you do want to join IMO. It’s no time to be timid in the market in my personal and humble opinion; the conditions are a ripe as they get at this time frame (weekly). There are times to be cautious and there are times to take advantage, and the chart tells me it’s the latter right now. This thing could ride that white 5 period ema line for weeks and weeks. Could. Your mileage may vary!!
“Don’t need no ticket! Just get on board!”.
per the 2nd alternate hourly SPX price is now in a subminuette iii of a minuette iii of a minute v of a minor iii. Momentum overall may be likely to increase here? “It should”, I believe. Next week ought to be strongly up, in general.
Hi Kevin
If what your saying is correct then we might hit Lar’s first target next week of
2910 – 2922 in the SPX?
That was my projection a week ago (the gray ellipse). Still may happen, but note that the recent narrow channel I’ve added here is pretty shallow, and if momentum doesn’t increase the bump against that target will be more like the end of the month. Some range expansion upward though wouldn’t surprise me. It’s been awhile since we’ve seen larger upward movement, it’s kind of overdue.
One of the things driving the upward movement today is a sell off in bonds. /ZB (10 year bond futures) cracked a significant up trend line on the hourly that’s been in play for a few weeks. Here’s a 15 minute view. I want to see price pull up (but not above recent highs!), then cut back below today’s low. Then I’ll add additional short positions.
instant push back up on /ZB to just under the highs from yesterday. Now what…I think it’s rolling over myself, but I’m short and sure to be a little biased!! Lol!!!
Earlier this morning to get a put debit spread of a single dollar in TLT the price was 0.85. That’s how skewed and high priced the puts were. I just laughed…now it’s “only” .68. Not a chance!!
You’ve been right Kevin all along about the SPX wave count. I closed my shorts on SPX earlier today when we gapped higher, which is not what I expected.
I’ve opened a short on TLT. It really does look overdone here. Let’s see where this goes… but the daily trend has been strong to the upside. I’m guessing a good stop would be 22.50?
22.50 has been a super key level Ari. So yea, just above there isn’t a bad approach.
I like a put debit spread, where your max acceptable risk (your effective stop) is the complete wipe out of the purchased put (all that expended cash lost). Then if price goes hard against you (TLT moves up strongly)…when the sold put value gets 70-80% of the way to zero, buy it back and take your profit on that side. Then you’ve reduced the amount of movement back (down in this case) to get back to a scratch trade, and you might even make more than the max allowed by the unaltered spread. I view this approach as in a sense “playing volatility with a slight directional bias”. Profit off the movement in one direction…or back and forth. But not in the wrong directly. 2 out of 3 possibilities is good odds!
You probably already know all this but perhaps to some others it’s new. I mostly learned this option play from Verne (though he likes to do it with bear call credit spreads and exit on 1/2 when it moves in his direction on a correction, then he holds the purchased side long for when the trend reestablishes itself, a very cool play).
It’s not a play for everyone. Some who are more “place a trade and walk away” should do just that with spreads. They work extremely nicely that way, similar to buying outright and putting in a OCA stop and limit sell.
Thanks for the info Kevin! Very helpful
The length in time of the minute iv in the main hour and alternate hourly compared to the minute ii is almost 2x now; that seeming less and less likely to me. I continue to think the 2nd alternate hourly will be the go forward model. The NDX looks supportive of that to me; it’s got a major up channel, and it’s low in it; there’s not much room for NDX to go but up. And RUT is possibly ready to break to new highs as well. But I’m being cautious; price action will inform us shortly.
Hey Kevin, i do agree that rut/iwm favors upside to me. Wats your current count or target for rut? Im away from laptop but will try to post mine too over weekend
the next fibo extension I have on RUT is 1726.75, a 1.618. After that, a cluster in the 1728 area.
Only that price is probably in a v wave up off the 8/15 bottom right now. So taking profits on this push up to new highs (or incrementally peeling off as it goes) might be a good play. The heart of my bullish outlook is the trend at the monthly, weekly, and daily are up, and it was in a long daily squeeze and has popped out upward. I don’t have higher TF counts, sorry. Nor targets per se: only potential turn points based on fibo extensions. Next one is at 1724.30
I’d say 1739-41 is a pretty reasonable target. Though it may certainly turn lower…or high. v waves up are unpredictable!
Initial action strongly supportive of the 2nd alternate. Now it depends on how the rest of the day plays out. Indications are we’re going to get a trending day upward. A/D ratios are very bullish at the moment. However…there is a real possibility this thrust up reverses and there’s hard selling later in the day. Be ready for anything…
Bulls appear in reasonable control here! Buying pressure moderately strong and not slacking off.
CAN SPX BUST THE ATH ON THIS 2ND TRY? I suspect it just might.
On try #3….THROUGH!!!! Thank you Lara for guiding us here; so many pundits said this wouldn’t happen, but your call has been STEADY and right on.
Thanks Kevin.
I was wrong for the short term pullback though. I did expect that to happen. I think my mistake there was giving too much weight to rising price on declining volume, forgetting that happens so often in current market conditions.
I gave too much weight to the Gravestone doji.
But yeah, a new ATH within the next very few weeks was something I was extremely confident on.
Thx Kevin! Im out camping and missed the action but was already positioned so i might peel of some iwm Monday. For spx, will wait for Lara count .