
A small range upwards day completes a significant candlestick pattern. This is analysed today in context with signals from On Balance Volume and the AD line.
Summary: A Gravestone Doji today is a strong warning that a pullback may begin here. If it does, then the target for it to end is now at 2,803.
The bigger picture remains extremely bullish with new all time highs again today for both On Balance Volume and the AD line.
The mid to longer term target is at 2,922 (Elliott wave) or 3,045 (classic analysis). Another multi week to multi month correction is expected at one of these targets.
The final target for this bull market to end remains at 3,616.
Always practice good risk management. Always trade with stops and invest only 1-5% of equity on any one trade.
New updates to this analysis are in bold.
The biggest picture, Grand Super Cycle analysis, is here.
Last historic analysis with monthly charts is here, video is here.
ELLIOTT WAVE COUNT
WEEKLY CHART
Click chart to enlarge.
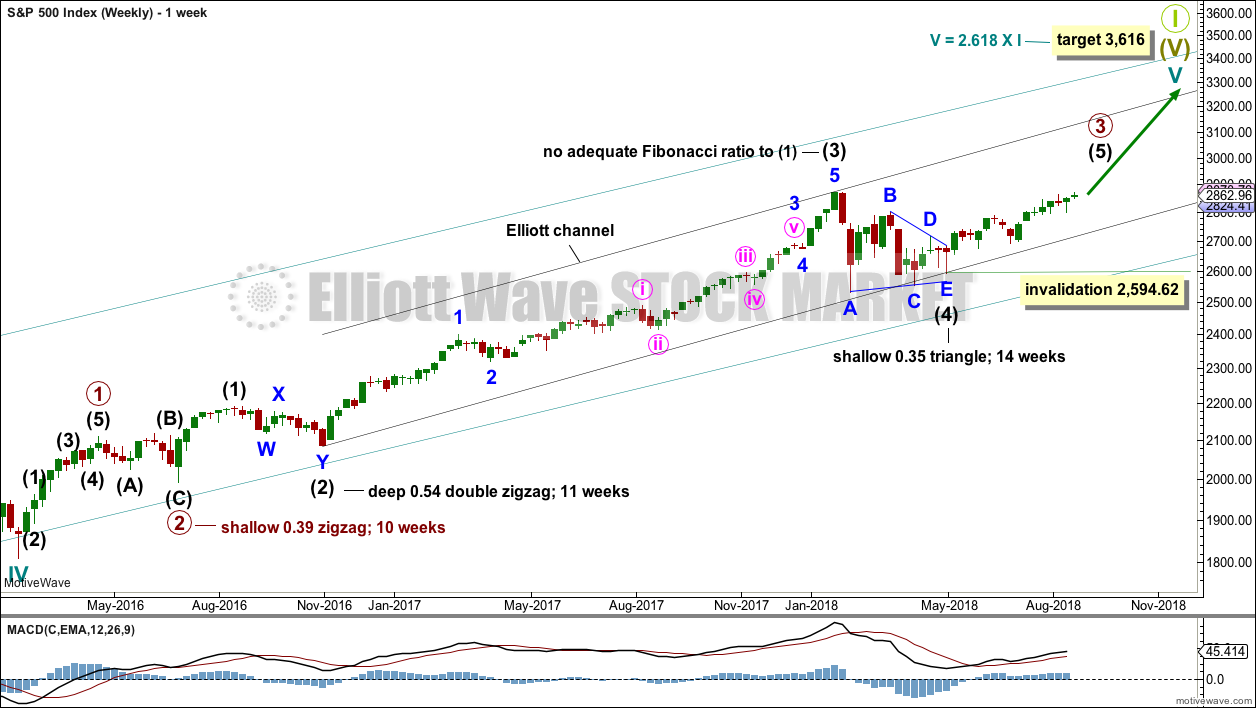
Cycle wave V must complete as a five structure, which should look clear at the weekly chart level and also now at the monthly chart level. It may only be an impulse or ending diagonal. At this stage, it is clear it is an impulse.
Within cycle wave V, the third waves at all degrees may only subdivide as impulses.
Intermediate wave (4) has breached an Elliott channel drawn using Elliott’s first technique. The channel is redrawn using Elliott’s second technique: the first trend line from the ends of intermediate waves (2) to (4), then a parallel copy on the end of intermediate wave (3). Intermediate wave (5) may end either midway within the channel, or about the upper edge.
Intermediate wave (4) may now be a complete regular contracting triangle lasting fourteen weeks, one longer than a Fibonacci thirteen. There is perfect alternation and excellent proportion between intermediate waves (2) and (4).
Within intermediate wave (5), no second wave correction may move beyond the start of its first wave below 2,594.62. However, the lower edge of the black Elliott channel drawn across the ends of intermediate degree waves should provide very strong support for any deeper pullbacks, holding price well above the invalidation point while intermediate wave (5) unfolds.
At this stage, the expectation is for the final target to me met in October 2019. If price gets up to this target and either the structure is incomplete or price keeps rising through it, then a new higher target would be calculated.
A multi week to multi month consolidation for primary wave 4 is expected on the way up to the final target.
The last bullish fifth wave of minor wave 5 to end intermediate wave (3) exhibited commodity like behaviour. It was strong and sustained. It is possible that the upcoming wave of minor wave 5 to end intermediate wave (5) to end primary wave 3 may exhibit similar behaviour, so we should be on the lookout for this possibility.
DAILY CHART
Click chart to enlarge.
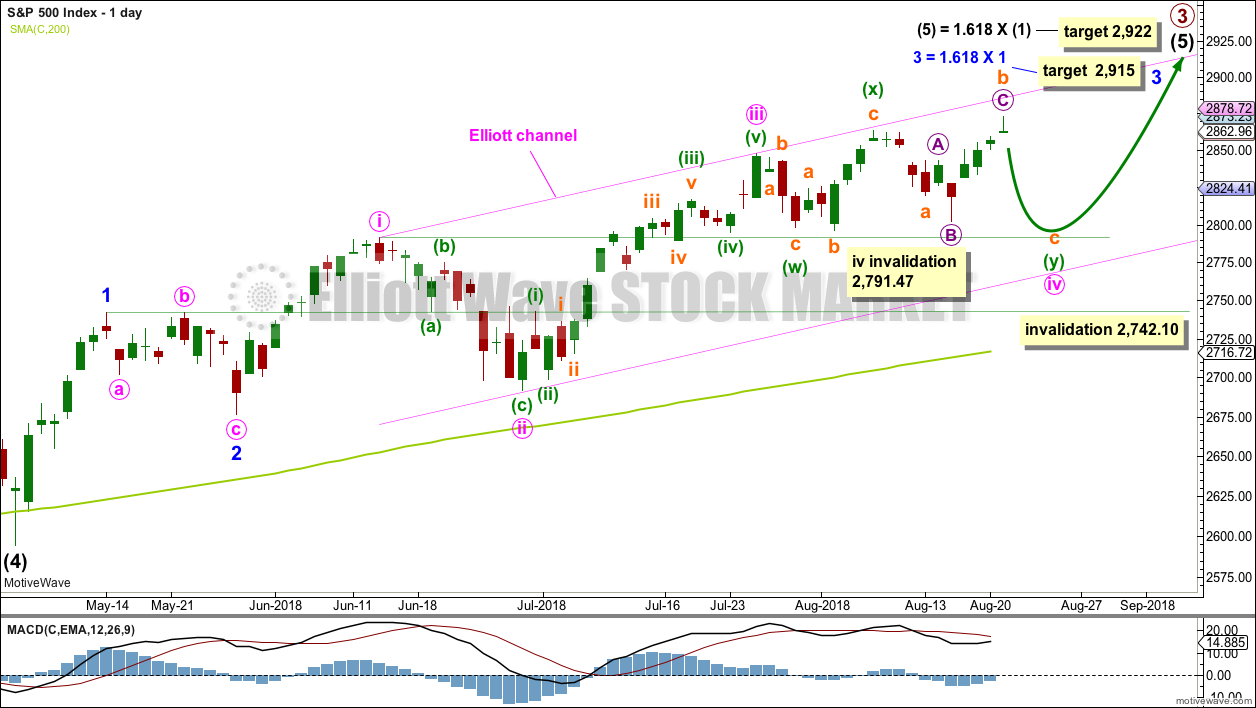
Intermediate wave (5) would be very likely to make at least a slight new high above the end of intermediate wave (3) at 2,872.87 to avoid a truncation.
Intermediate wave (3) exhibits no Fibonacci ratio to intermediate wave (1). It is more likely then that intermediate wave (5) may exhibit a Fibonacci ratio to either of intermediate waves (1) or (3). The most common Fibonacci ratio would be equality in length with intermediate wave (1), but in this instance that would expect a truncation. The next common Fibonacci ratio is used to calculate a target for intermediate wave (5) to end.
Intermediate wave (5) is unfolding as an impulse, and within it minor waves 1 and 2 are complete.
Minor wave 3 may only subdivide as an impulse. A target is calculated for minor wave 3 to end, which expects to see the most common Fibonacci ratio to minor wave 1. Minor wave 3 may last several weeks in total and should look like an impulse at the daily chart level. When it is complete, then minor wave 4 may last about one to two weeks in order for it to exhibit reasonable proportion to minor wave 2. Minor wave 4 may not move into minor wave 1 price territory below 2,742.10.
Within minor wave 3, minute waves i, ii and iii all look complete and minute wave iv may still be incomplete. If minute wave iv were to continue further, then it would have better proportion to minute wave ii and would exhibit alternation in structure. This idea also has support from classic technical analysis.
The new high today has invalidated a triangle for minute wave iv. When a triangle is invalidated, most often a double combination is what the correction turns out to be.
It still looks most likely that minute wave iv is incomplete. It may end now with a pullback to complete a double combination, which is a reasonably common structure.
It is also possible that minute wave iv was over at the last low and minor wave 3 was over at the last high. A new low below 2,791.47 could not be a continuation of minute wave iv, so the correction at that stage would be labelled minor wave 4.
The channel is drawn using Elliott’s first technique. The upper edge has provided resistance. This channel is copied over to hourly charts.
If price makes a new low below 2,791.47 and keeps on falling, then look for strong support about the lower edge of the Elliott channel on this daily chart; the pullback may end there.
MAIN HOURLY CHART – COMBINATION
Click chart to enlarge.
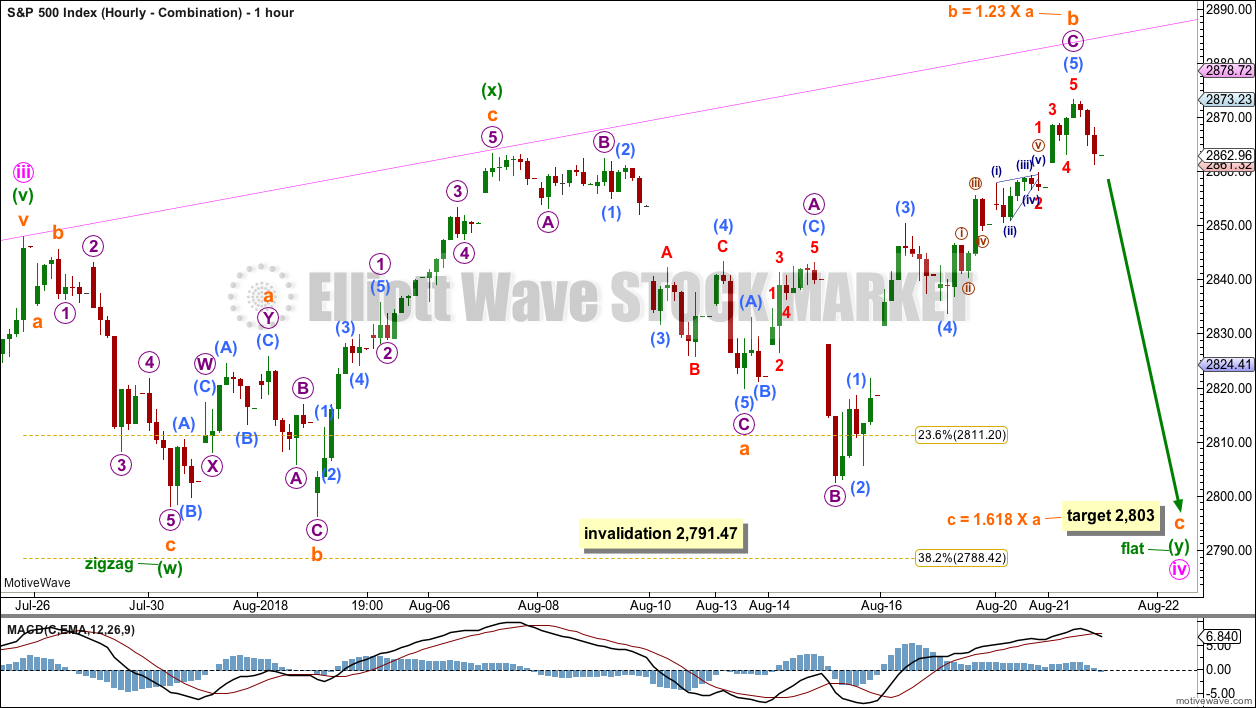
The first structure in a possible double combination may be a completed zigzag labelled minuette wave (w).
The double may be joined by a completed three in the opposite direction, an expanded flat labelled minuette wave (x).
The second structure in a possible double combination would be very likely to be a flat correction; the most common two structures to make up a double combination are one zigzag and by a very wide margin one flat.
If minuette wave (y) unfolds as a flat correction, then within it subminuette wave b must retrace a minimum 0.9 length of subminuette wave a (this minimum was met and passed at 2,780.69). Subminuette wave b may make a new high above the start of subminuette wave a as in an expanded flat correction. Subminuette wave b remains within the most common range for B waves of flats from 1 to 1.38 times the length of subminuette wave a.
The Gravestone doji for today’s candlestick is a strong warning of weakness ahead. For this reason, this is the main wave count.
Minuette wave (y) would be most likely to end about the same level as minuette wave (w) at 2,798, so that the whole structure has a typical sideways look. The purpose of second structures in a combination is to take up time and move price sideways. Combinations are analogous to flag patterns in classic technical analysis.
This possible combination may take a few more days to complete. Support about 2,800 would be expected to hold.
ALTERNATE HOURLY CHART
Click chart to enlarge.
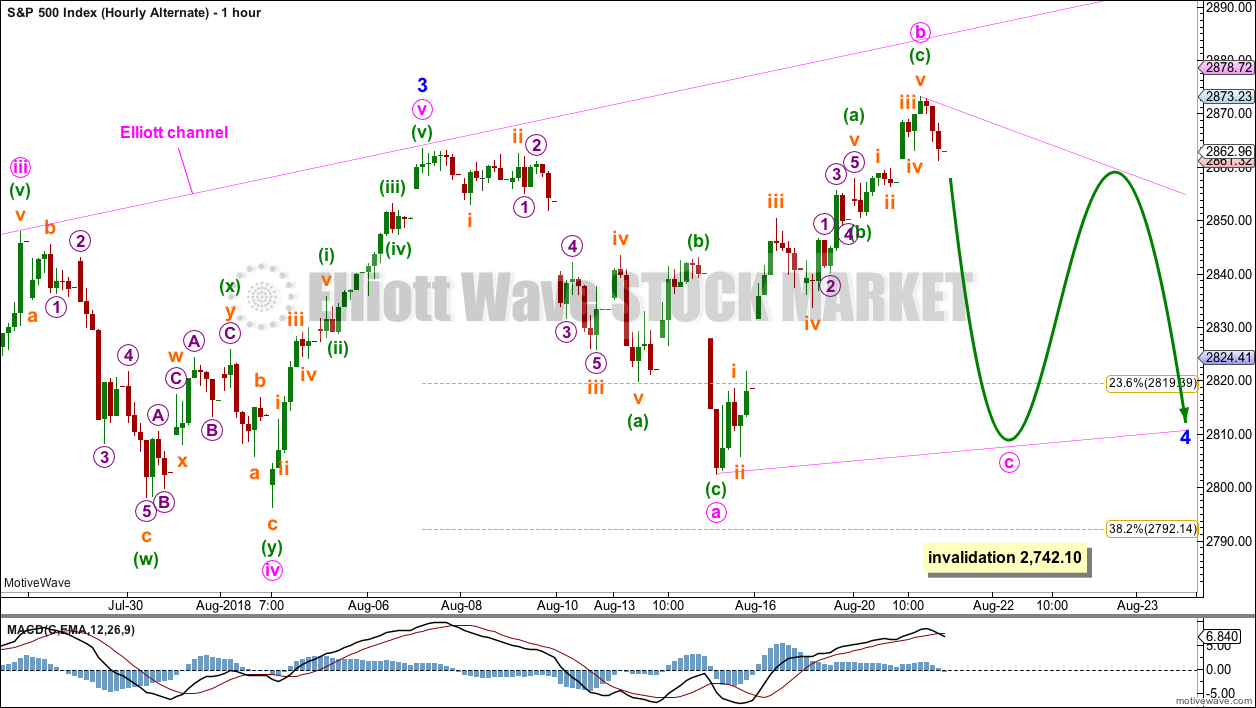
Here, the degree of labelling within minute wave iv is moved up one degree.
It is possible that minute wave iv could be over more quickly than was expected. If minute wave iv is over, then the possibility of an earlier than expected end to minute wave v must be considered.
Minor wave 3 may have been over at the last high. Minute wave v is seen as a five wave impulse in order for this wave count to work. This does not have as good a fit as the main wave count, which does see this wave as a zigzag.
Minor wave 4 may be an expanded flat, a combination or a running triangle. A triangle or combination would have better alternation with the expanded flat correction of minor wave 2. At this stage, minor wave 4 will be labelled as a possible triangle, but this labelling may change as it unfolds further.
Minor wave 4 may be reasonably expected to last at least about two weeks, and possibly up to about four weeks. It would most likely end somewhere within the fourth wave of one lesser degree; minute wave iv has its range from 2,843.03 to 2,796.34. If it does not end here, then it may end about the 0.382 Fibonacci ratio of minor wave 3 at 2,792.
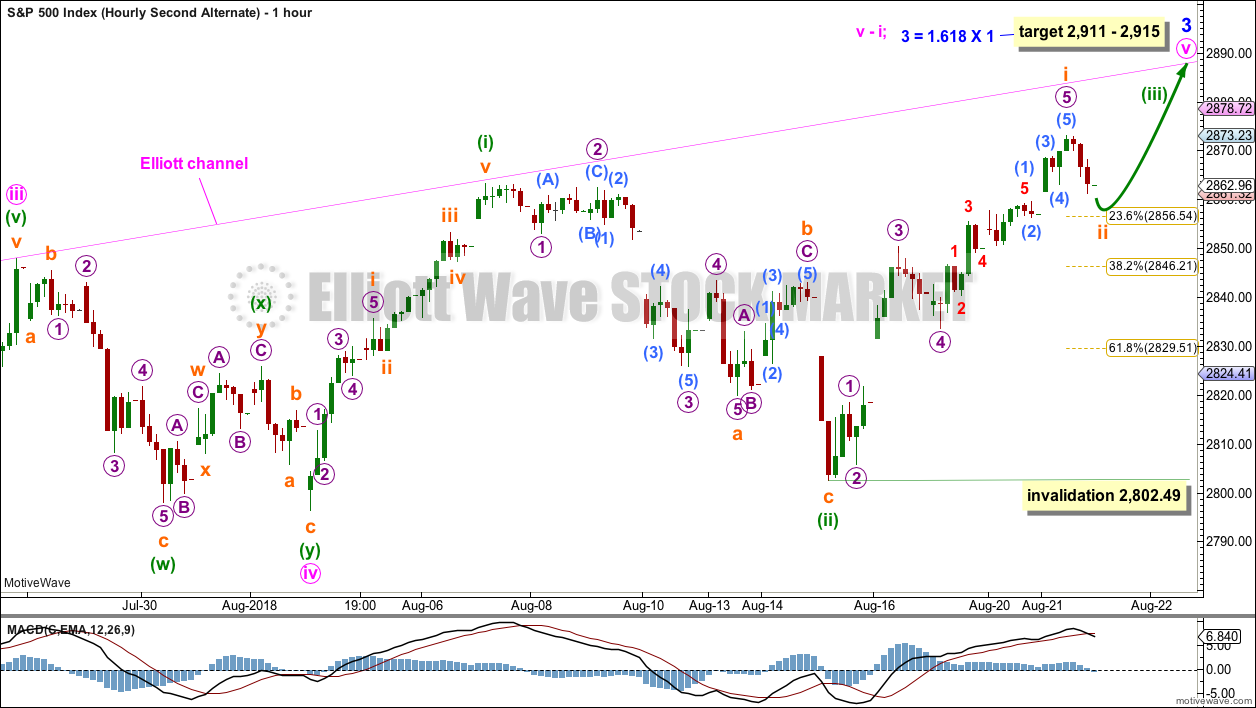
SECOND ALTERNATE HOURLY CHART
Click chart to enlarge.
This second alternate wave count moves the degree of labelling within the last upwards wave down one degree. Minute wave v may be incomplete, and only minuette wave (i) within it may be complete.
Minuette wave (ii) is labelled as complete single zigzag.
This wave count expects an increase in upwards momentum as minuette wave (iii) moves higher.
Within minuette wave (iii), the correction for subminuette wave ii may not move beyond the start of subminuette wave i below 2,802.49.
Price today has made a new high, but it comes with a Gravestone doji candlestick pattern. This indicates reasonable bearishness, so this chart will not be switched to the main wave count at this time.
TECHNICAL ANALYSIS
WEEKLY CHART
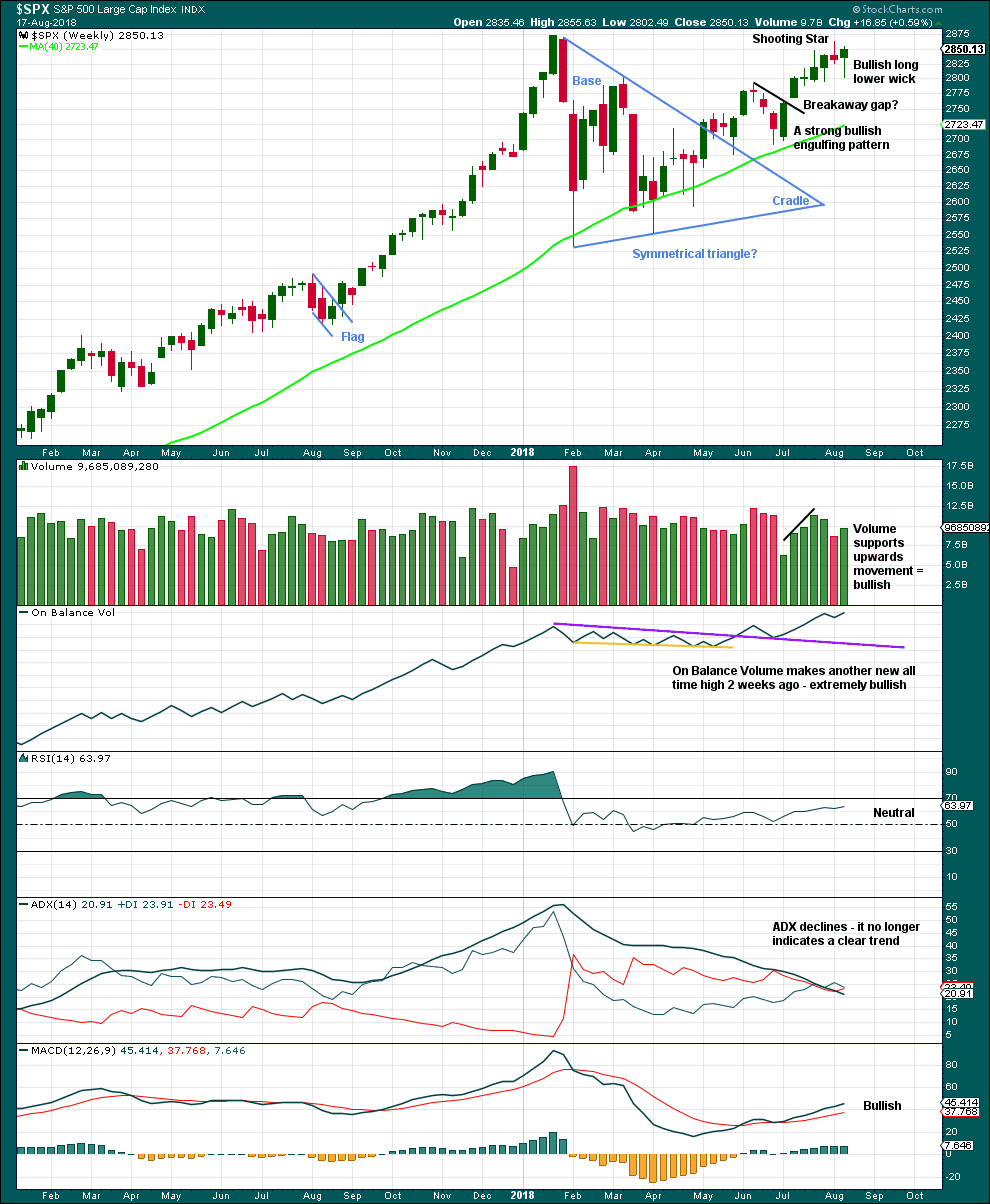
Click chart to enlarge. Chart courtesy of StockCharts.com.
The symmetrical triangle may now be complete. The base distance is 340.18. Added to the breakout point of 2,704.54 this gives a target at 3,044.72. This is above the Elliott wave target at 2,922, so the Elliott wave target may be inadequate.
The Shooting Star candlestick reversal pattern has been followed by a downwards week. It may yet be followed by more downwards movement, but the strength of this last weekly candlestick suggests it may not.
Price moved lower last week, but the balance of volume was upwards and the candlestick closed green. Upwards movement during the week has support from volume, but for clarity we should look inside the week at daily volume bars.
The long lower wick and a close very close to highs suggests a little more upwards movement this week.
DAILY CHART
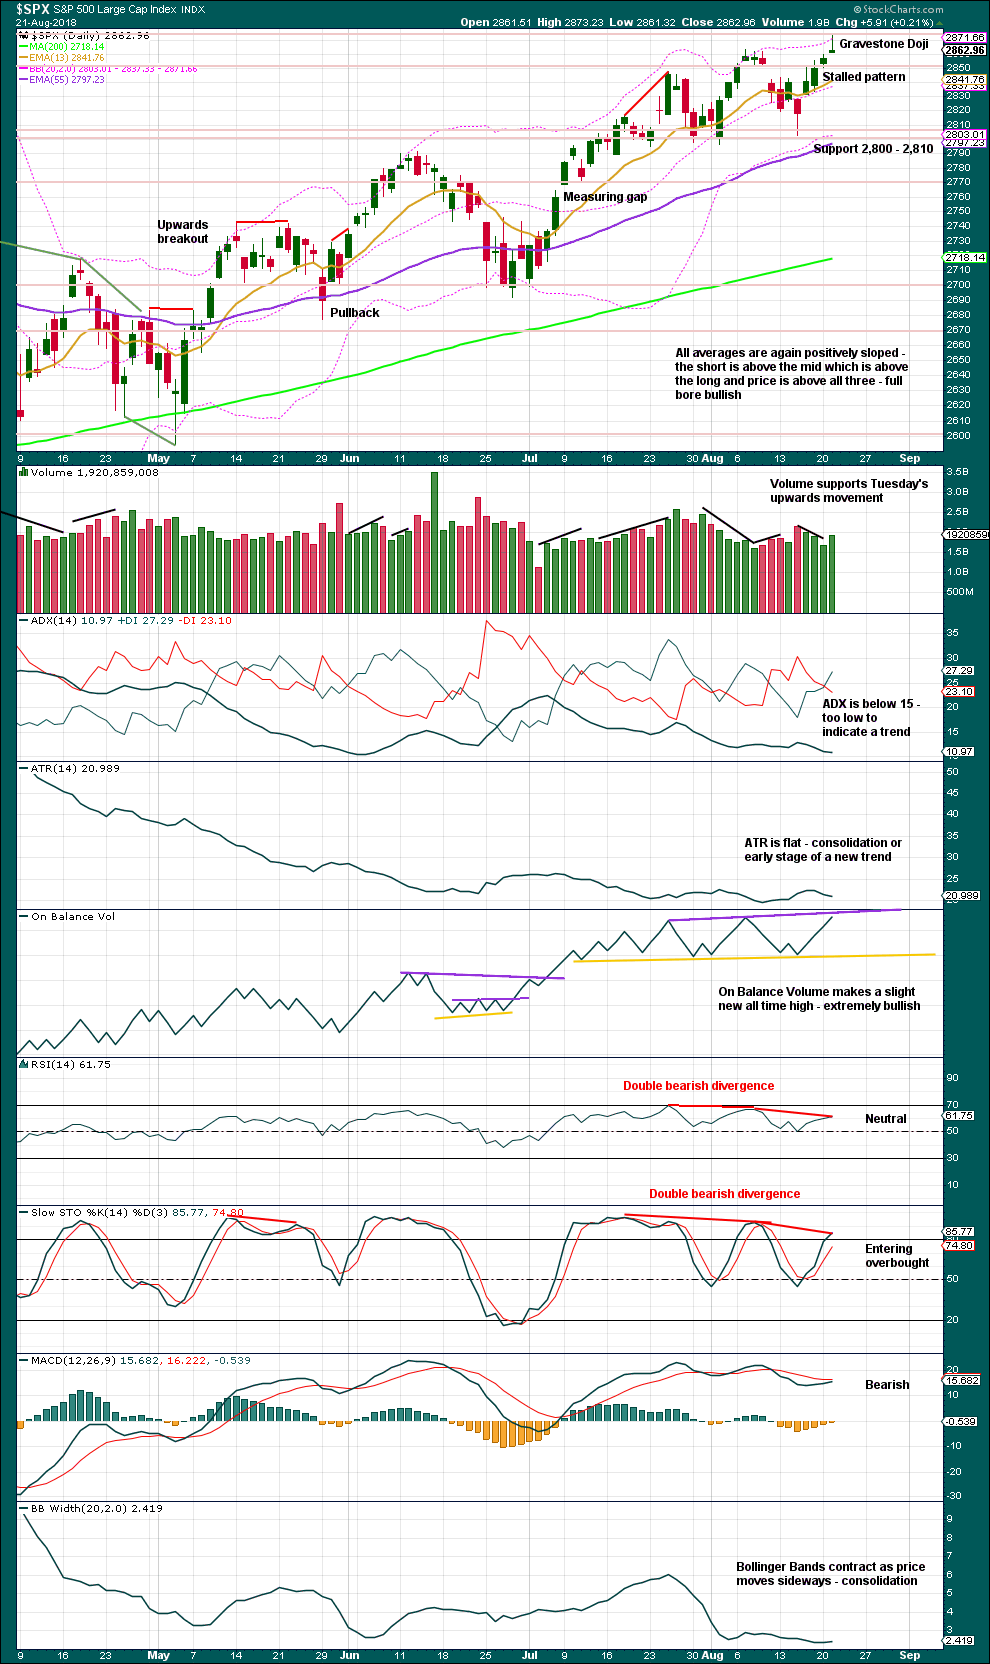
Click chart to enlarge. Chart courtesy of StockCharts.com.
Since the low on the 2nd of April, 2018, price has made a series of higher highs and higher lows. This is the definition of an upwards trend. But trends do not move in perfectly straight lines; there are pullbacks and bounces along the way.
Support about 2,800 remains very strong with three recent tests and no close below this point. Each test of this support area strengthens its technical significance.
Support at the first yellow line for On Balance Volume has now been tested five times. This line now has very reasonable technical significance. A new resistance line is drawn for On Balance Volume. This may halt the rise in price and initiate a pullback.
It is noted for each of the last few reasonable pullbacks, On Balance Volume had made new highs on the day of the high or the day immediately prior: on the 18th of April, 14th of May, 12th of June, 25th of July, and the 7th of August. A new all time here today may yet be followed by a pullback.
The Gravestone Doji forte is in calling market tops. It is a reasonably bearish candlestick when it comes after a rise. It is a strong warning of a possible pullback here. Look for support about 2,800.
There is bearish divergence here between price and both of Stochastics and RSI. Only a little weight is given to this divergence, because sometimes it just disappears.
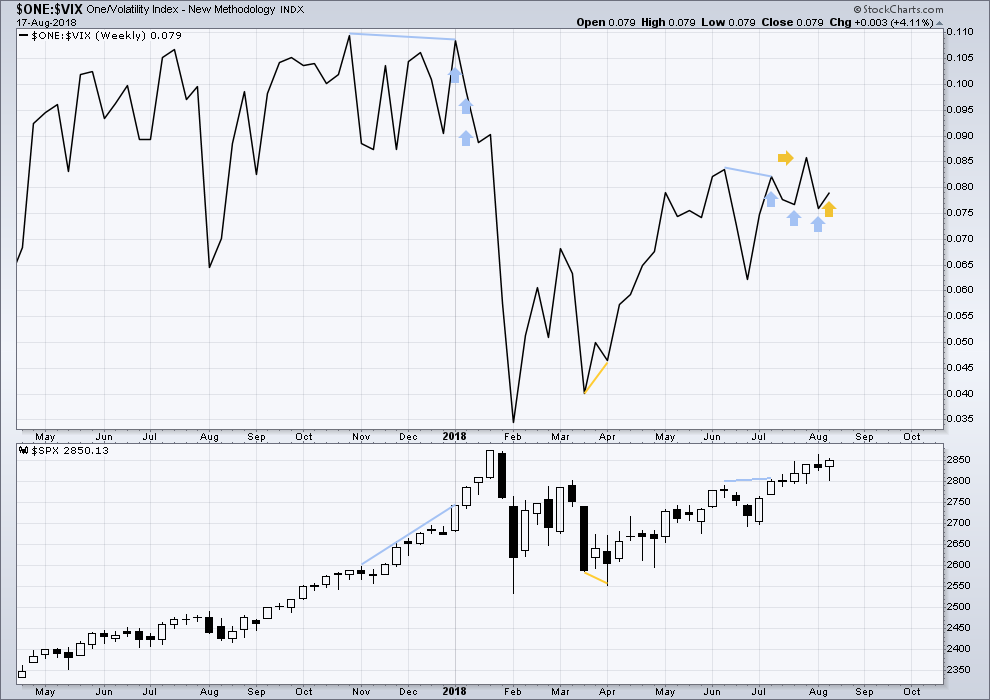
VOLATILITY – INVERTED VIX CHART
WEEKLY CHART
Click chart to enlarge. Chart courtesy of StockCharts.com. So that colour blind members are included, bearish signals
will be noted with blue and bullish signals with yellow.
To keep an eye on the all time high for inverted VIX a weekly chart is required at this time.
Notice how inverted VIX has very strong bearish signals four weeks in a row just before the start of the last large fall in price. At the weekly chart level, this indicator may be useful again in warning of the end of primary wave 3.
Some bearish divergence was noted two weeks ago. This has now been followed by a downwards week, so it may now be resolved.
Price moved lower for the last week, but inverted VIX moved higher. This divergence is bullish.
Inverted VIX is still some way off from making a new all time high.
DAILY CHART
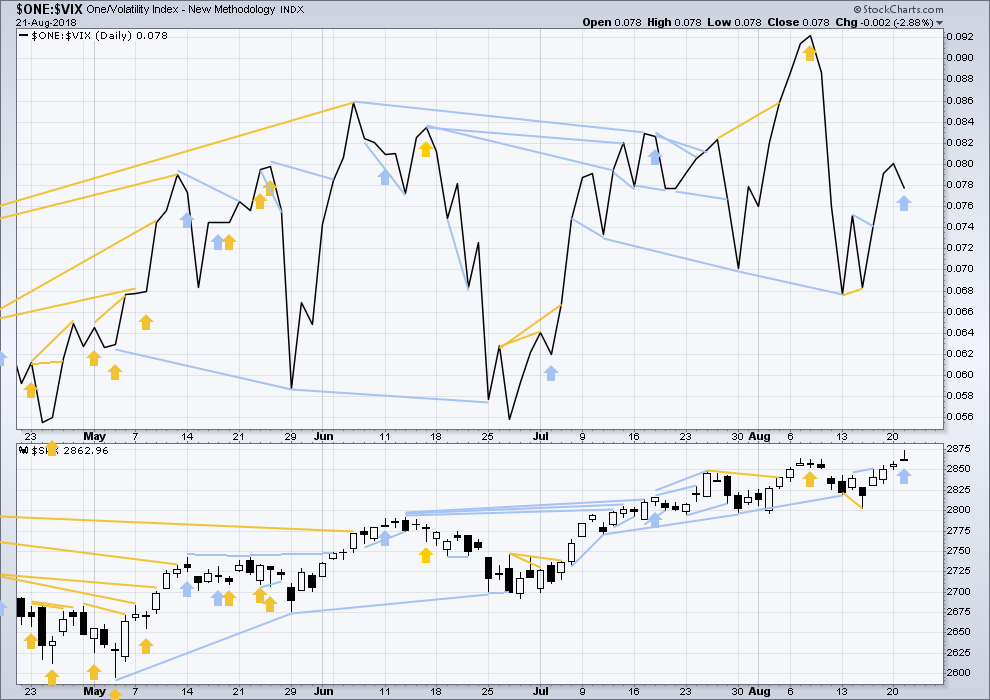
Click chart to enlarge. Chart courtesy of StockCharts.com. So that colour blind members are included, bearish signals
will be noted with blue and bullish signals with yellow.
Normally, volatility should decline as price moves higher and increase as price moves lower. This means that normally inverted VIX should move in the same direction as price.
Last noted mid term bearish divergence has not been followed yet by more downwards movement. It may still indicate downwards movement ahead as there is now a cluster of bearish signals from inverted VIX.
Price today moved higher, but inverted VIX moved lower. This short term divergence is bearish.
BREADTH – AD LINE
WEEKLY CHART
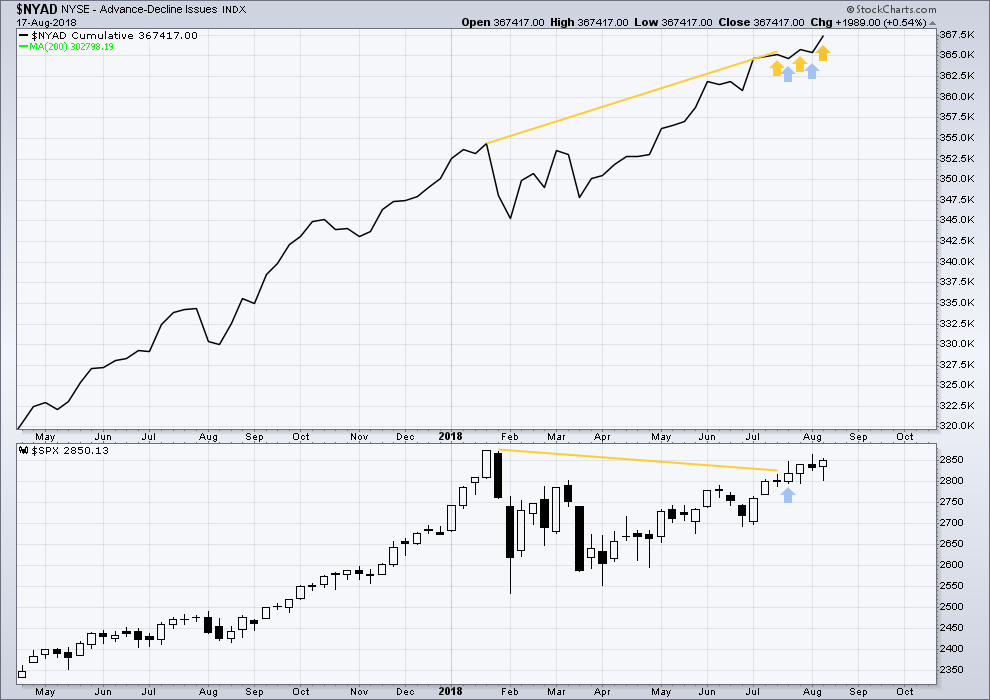
Click chart to enlarge. Chart courtesy of StockCharts.com.
When primary wave 3 comes to an end, it may be valuable to watch the AD line at the weekly time frame as well as the daily.
At this stage, there is very strong bullish divergence between price and the AD line at the weekly time frame. With the AD line making new all time highs, expect price to follow through with new all time highs in coming weeks.
Another new all time high from the AD line last week is extremely bullish.
DAILY CHART
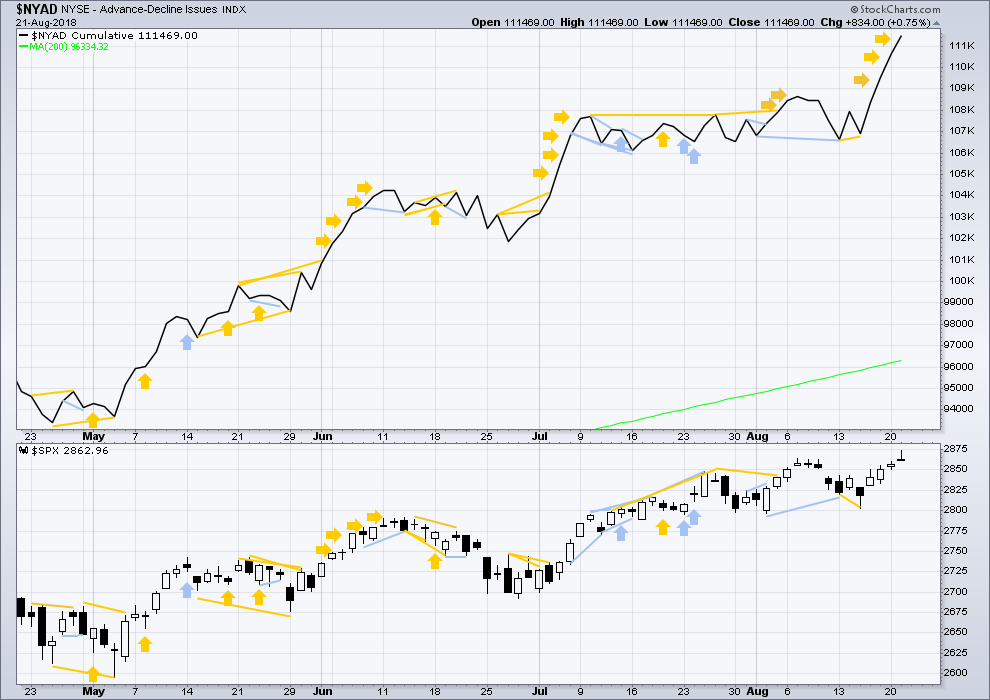
Click chart to enlarge. Chart courtesy of StockCharts.com.
There is normally 4-6 months divergence between price and market breadth prior to a full fledged bear market. This has been so for all major bear markets within the last 90 odd years. With no longer term divergence yet at this point, any decline in price should be expected to be a pullback within an ongoing bull market and not necessarily the start of a bear market. New all time highs from the AD line means that any bear market may now be an absolute minimum of 4 months away. It may of course be a lot longer than that. My next expectation for the end of this bull market may now be October 2019.
Breadth should be read as a leading indicator.
The AD line has made another new all time high at the daily chart level. This is extremely bullish. It does not preclude a pullback here though. Each of the last four pullbacks on this chart were also immediately preceded by new all time highs from the AD line.
New all time highs here from the AD line is extremely bullish for the mid term.
Both small and mid caps have made new all time highs today. Large caps do tend to lag towards the end of a bull market, so the current situation with large caps yet to make a new all time high absolutely should be expected towards the end of a mature and ageing bull market.
DOW THEORY
The following lows need to be exceeded for Dow Theory to confirm the end of the bull market and a change to a bear market:
DJIA: 23,360.29.
DJT: 9,806.79.
S&P500: 2,532.69.
Nasdaq: 6,630.67.
Only Nasdaq at this stage is making new all time highs, with another new all time high on the 25th of July. DJIA and DJT need to make new all time highs for the ongoing bull market to be confirmed.
Charts showing each prior major swing low used for Dow Theory may be seen at the end of this analysis here.
Published @ 10:14 p.m. EST.
hourly combination chart updated:
subminuette c needs to be a five wave structure.
Bond futures (/ZB) have consolidated up in its very large range to an overlapped 100% and 78.6%, and I’m watching very closely for a trend line break and polarity inversion. It’s coming back down sooner or later…and it may very well start very soon indeed.
UUP has been in a corrective decline for about a week or two in a weekly/monthly bull market. It’s just hit at 61.8% retrace fibo of the last daily/weekly TF swing up, and executed a reversal type candle right on top of it on the hourly. I’m watching carefully for signs of a turn…vs. signs of continuing down another notch to the 78.6% (derived) fibo. Hanging in the balance now.
the white lines, including the one right on top of the 61.8% blue fibo line, are significant pivot highs from weeks to months ago. The perfect overlay on the 61.8% is IMO significant, but still…may not hold. One of the others might then, or the 78.6% price.
I suppose this could be one of those “process tops” and the real decline is ahead of us, tomorrow/Friday. Or…this inability to sell off when “expected” is yet more indication of buying pressure that will regain control shortly.
We’ll see tomorrow! Or maybe even in the last 1/2 hour today…
I have 1724.3 as the next potential turn spot in RUT, a 1.61 and a 1.27 almost on top of each other.
looks like it turned
Turn here to me is breaking the trend line and coming under the prior pivot low on the hourly at 1716.
Oil (/CL) busting right up and through the down trend lines. XLE as a result, same story.
Close to perfect hit and bounce off the 23% retrace fibo at 2857. A little higher than I expected and much higher than some expected. The bull force is strong with this market.
I’m suspicious that this pullback is a small iv of a 5 wave move up off the lows from 8/15, and there’s a v wave up launched here, which will push to a new ATH off one of those higher fibos (2881 most likely), THEN a ii down fires up.
The following is from Bulkowski’s Candlestick Patterns
“Many people look at a gravestone doji with alarm, especially during an uptrend. They believe that it signals a bearish reversal. It does, but only 51% of the time. I call that random. The trend after the reversal does not amount to much, placing the performance rank at 77 out of 103 candles where a rank of 1 represents a trend that really moves. There are exceptions, of course, and a gravestone doji can signal a lasting trend change.
Once price breaks out, the performance is lousy, ranking 77 — near the bottom of the list. That means price does not trend far after a breakout.”
Thanks for that Rodney. I’ll add that while Bulkowski did fine work, statistics doesn’t really back up his conclusions for the simple reason that the confidence levels of his results given his very low # of samples are huge. We in the poker world don’t accept any “expected value” measurement (i.e., an average level of profitability) with anything less than 20,000 hands…and even this is looked at as merely “indicative” of performance, because actual continuing results show even that number isn’t stable in the face of another 20,000 hands!!! Poker isn’t candlesticks and what happens thereafter…but I believe the principles are the same.
Awesome Analysis! Thanks Lara.
Hi Verne! Thank you very much.
A gravestone doji with a high right at the ATH. Classic! Now we get a pullback to 2850 ish, everyone yammers “double top!” and “bear market confirmation”, and the big EW pundits who call the Jan high the bull market top will be breathing a sigh of relief. And then…oops, back up and through! Looking forward to this drama playing out.
Well… that’s what I’m expecting here.
New ATH’s from both OBV and the AD line do make me reasonably confident that price will follow on through.
Combine the candlestick today with the fact that we closed up at least 0.2% in all markets, yet with a modestly higher VIX and UVXY…
Add to that a freakishly news bomb that will in no doubt add many layers of questions and uncerainty about top US political office; giving rise to legitimate impeachment concerns…
Today had the feel of a big time reversal. How ironic that this comes on the day of not only ATH in price, but also ATH in length.
The bull will be let loose soon, but for the next several days volatility will give the bears something to growl about.
I don’t share that feeling. While I expect a pullback here, I don’t expect it to go much below 2846. It certainly may per the main, but I put the 2nd alternate as the most likely still at this point. I’m particularly influenced by the OBV and the AD advances. The bearish candle certainly flashes a likely pivot high, but it doesn’t imply a major swing back down. While the political circus will cause ripples (and probably is the culprit in today’s latter day sell off and the resulting gravestone doji), I don’t think what happens there significantly impacts the market.
The 2nd alt may very well be in play. The end of the wave 2 down, as you pointed out on yesterday’s analysis, is the question mark for this count. I’ll probably take 1/2 of my shorts off the table at the 38% retrace at 2846. But I have a feeling it may find the 62% given the TA and candlestick pattern. The gap close will also be an interesting target open from last week’s daily chart. Just a hunch and definitely not trading advice.
It will be an interesting next 48-72 hours 🙂 looking forward to everyone’s input