
A very small upwards day fits short term expectations exactly.
The main Elliott wave count remains the same and has support from the short term volume profile.
Summary: Look for a final small pullback that may take one to three days to unfold and may end about 2,824. Thereafter, the upwards trend should resume to new all time highs, which may be made this week or next.
The bigger picture remains extremely bullish.
The mid to longer term target is at 2,922 (Elliott wave) or 3,045 (classic analysis). Another multi week to multi month correction is expected at one of these targets.
The final target for this bull market to end remains at 3,616.
Always practice good risk management. Always trade with stops and invest only 1-5% of equity on any one trade.
New updates to this analysis are in bold.
The biggest picture, Grand Super Cycle analysis, is here.
Last historic analysis with monthly charts is here, video is here.
ELLIOTT WAVE COUNT
WEEKLY CHART
Click chart to enlarge.
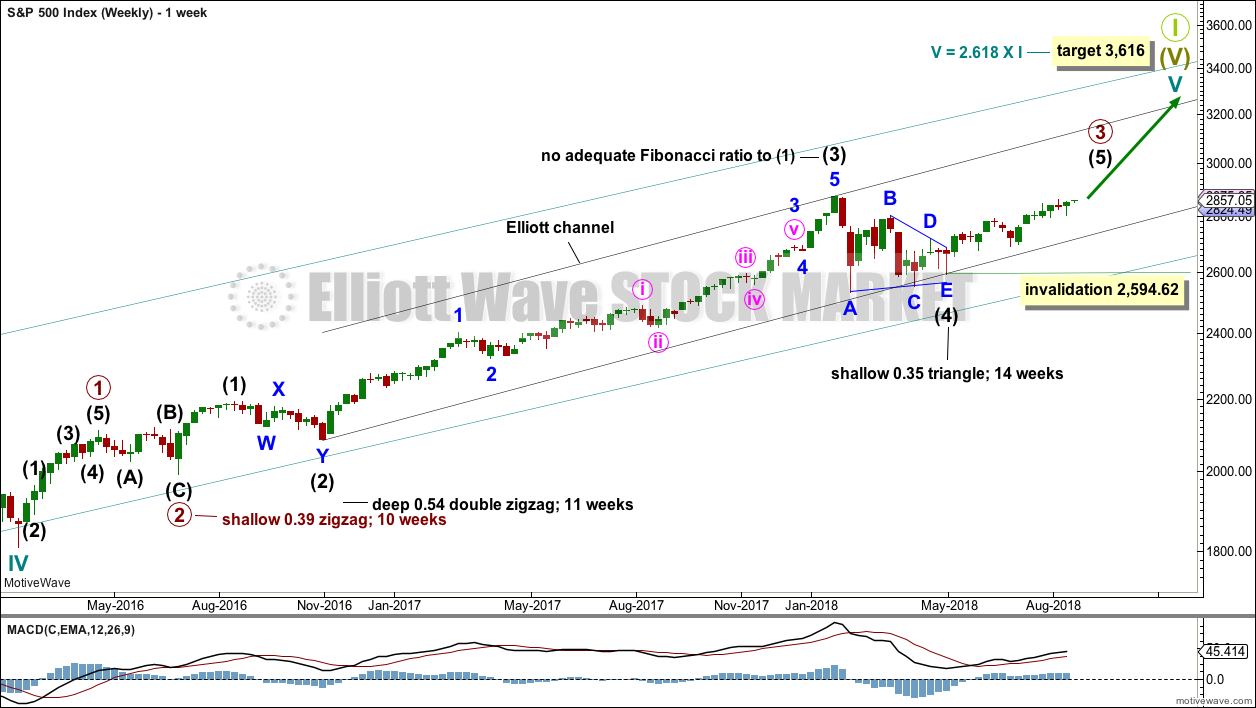
Cycle wave V must complete as a five structure, which should look clear at the weekly chart level and also now at the monthly chart level. It may only be an impulse or ending diagonal. At this stage, it is clear it is an impulse.
Within cycle wave V, the third waves at all degrees may only subdivide as impulses.
Intermediate wave (4) has breached an Elliott channel drawn using Elliott’s first technique. The channel is redrawn using Elliott’s second technique: the first trend line from the ends of intermediate waves (2) to (4), then a parallel copy on the end of intermediate wave (3). Intermediate wave (5) may end either midway within the channel, or about the upper edge.
Intermediate wave (4) may now be a complete regular contracting triangle lasting fourteen weeks, one longer than a Fibonacci thirteen. There is perfect alternation and excellent proportion between intermediate waves (2) and (4).
Within intermediate wave (5), no second wave correction may move beyond the start of its first wave below 2,594.62. However, the lower edge of the black Elliott channel drawn across the ends of intermediate degree waves should provide very strong support for any deeper pullbacks, holding price well above the invalidation point while intermediate wave (5) unfolds.
At this stage, the expectation is for the final target to me met in October 2019. If price gets up to this target and either the structure is incomplete or price keeps rising through it, then a new higher target would be calculated.
A multi week to multi month consolidation for primary wave 4 is expected on the way up to the final target.
The last bullish fifth wave of minor wave 5 to end intermediate wave (3) exhibited commodity like behaviour. It was strong and sustained. It is possible that the upcoming wave of minor wave 5 to end intermediate wave (5) to end primary wave 3 may exhibit similar behaviour, so we should be on the lookout for this possibility.
DAILY CHART
Click chart to enlarge.
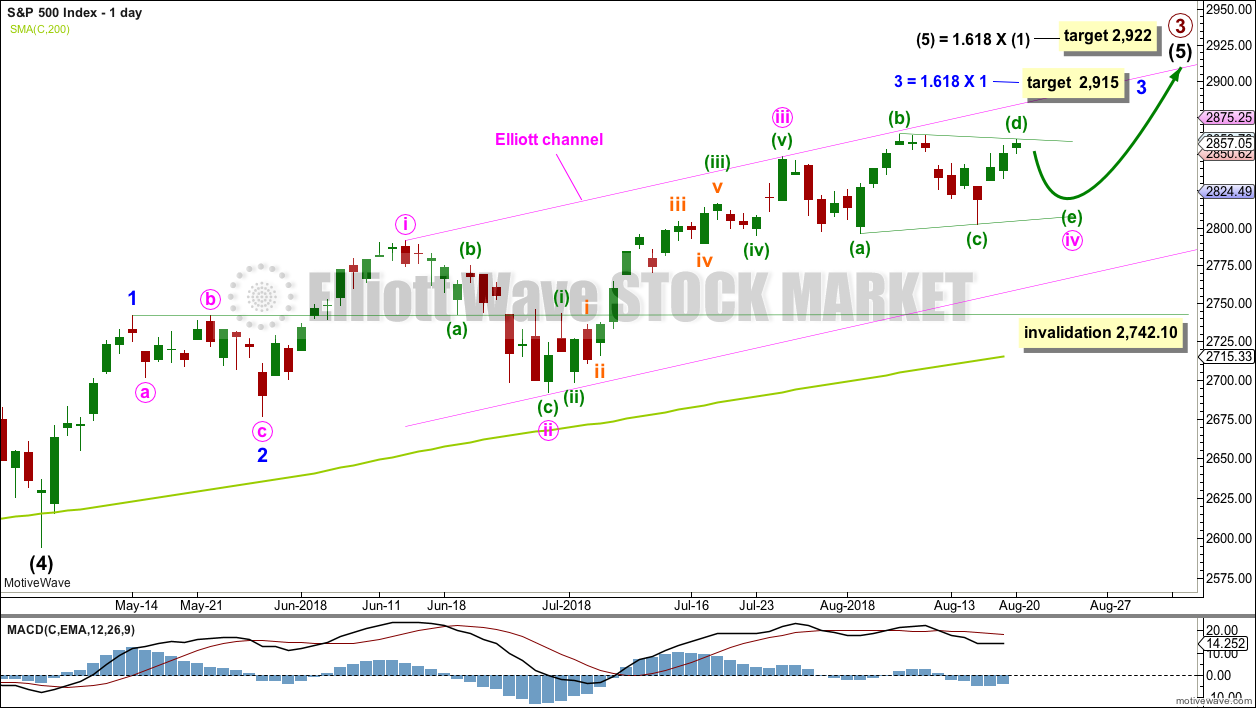
Intermediate wave (5) would be very likely to make at least a slight new high above the end of intermediate wave (3) at 2,872.87 to avoid a truncation.
Intermediate wave (3) exhibits no Fibonacci ratio to intermediate wave (1). It is more likely then that intermediate wave (5) may exhibit a Fibonacci ratio to either of intermediate waves (1) or (3). The most common Fibonacci ratio would be equality in length with intermediate wave (1), but in this instance that would expect a truncation. The next common Fibonacci ratio is used to calculate a target for intermediate wave (5) to end.
Intermediate wave (5) is unfolding as an impulse, and within it minor waves 1 and 2 are complete.
Minor wave 3 may only subdivide as an impulse. A target is calculated for minor wave 3 to end, which expects to see the most common Fibonacci ratio to minor wave 1. Minor wave 3 may last several weeks in total and should look like an impulse at the daily chart level. When it is complete, then minor wave 4 may last about one to two weeks in order for it to exhibit reasonable proportion to minor wave 2. Minor wave 4 may not move into minor wave 1 price territory below 2,742.10.
Within minor wave 3, minute waves i, ii and iii all look complete and minute wave iv may still be incomplete. If minute wave iv were to continue further, then it would have better proportion to minute wave ii and would exhibit alternation in structure. This idea also has support from classic technical analysis.
It looks most likely now minute wave iv may be a running contracting triangle that may be almost complete. Minuette wave (e) of the triangle may fall reasonably short of the (a)-(c) trend line with a small pullback early this week; this is the most common look for E waves of triangles.
It is also possible that minute wave iv was over at the last low and minor wave 3 was over at the last high. A new low below 2,791.47 could not be a continuation of minute wave iv, so the correction at that stage would be labelled minor wave 4.
The channel is drawn using Elliott’s first technique. The upper edge has provided resistance. This channel is copied over to hourly charts.
If price makes a new low below 2,791.47 and keeps on falling, then look for strong support about the lower edge of the Elliott channel on this daily chart; the pullback may end there.
MAIN HOURLY CHART – TRIANGLE
Click chart to enlarge.
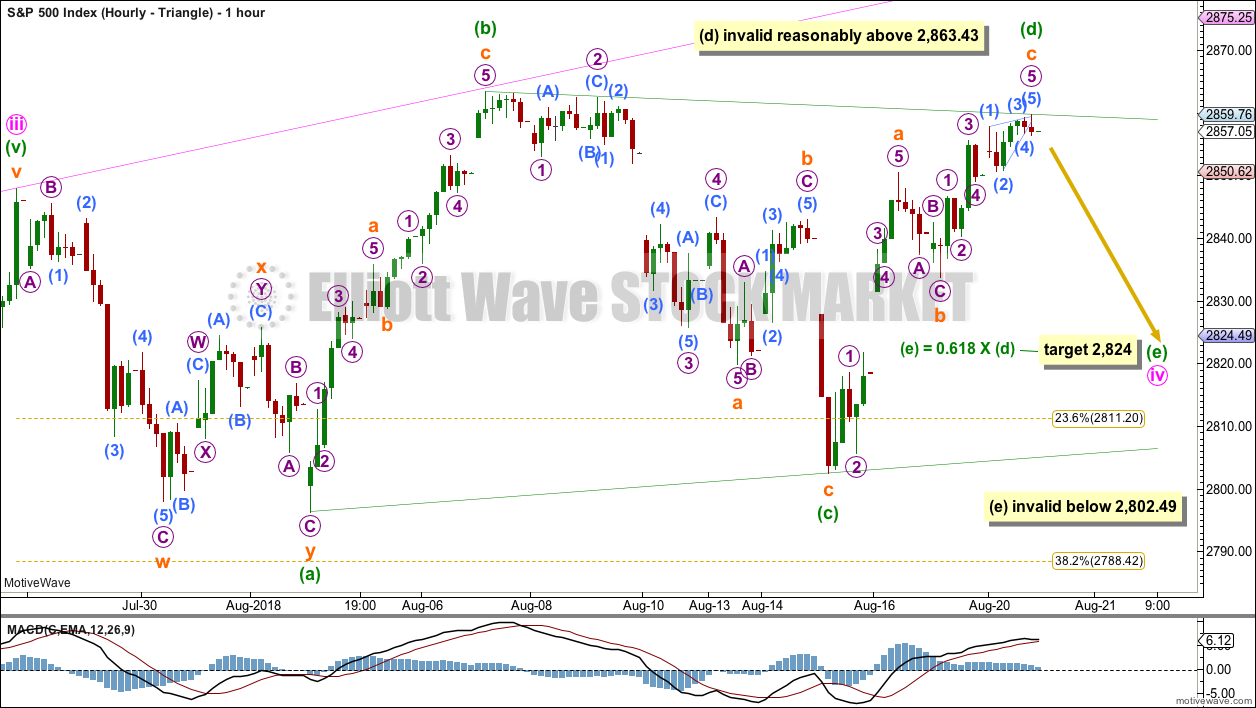
Only one sub-wave within a triangle may subdivide as a multiple and all remaining triangle sub-waves must be single corrective structures. In this example, minuette wave (a) fits best as a double zigzag.
Within a contracting triangle, minuette wave (d) may not move beyond the end of minuette wave (b) above 2,863.43. Contracting triangles are the most common type. Minuette wave (d) for a contracting triangle may end at resistance at the (b)-(d) trend line as it is drawn here, which sits across the highs within the start of minuette wave (c). Triangles normally adhere very well to their trend lines, and the trend lines are often tested within triangle sub-waves.
The structure of minuette wave (d) today can be seen as complete on the five minute chart. It may be over now at today’s high.
Within a barrier triangle, minuette wave (d) may end about the same level as minuette wave (b) in order for the (b)-(d) trend line to remain essentially flat. Minuette wave (d) may end slightly above minuette wave (b) and the triangle would remain valid; the upper invalidation point is not black and white. Barrier triangles are not the most common type, but they are still reasonably common.
For both a barrier and contracting triangle, minuette wave (e) may not move beyond the end of minuette wave (c) below 2,802.49. It would most likely fall short of the (a)-(c) trend line. A target is now calculated for it to end.
When Elliott wave triangles complete, the resulting movement out of them usually begins with strength.
MAIN HOURLY CHART – COMBINATION
Click chart to enlarge.
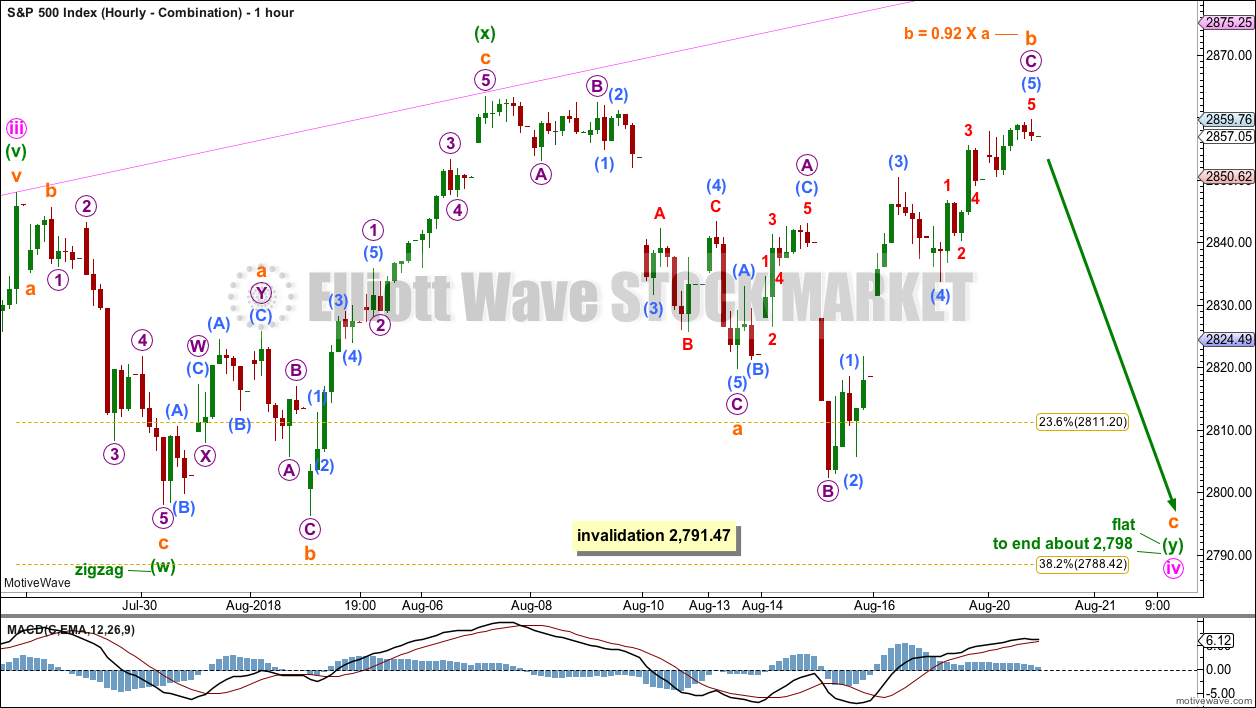
If the triangle is invalidated, then at this stage it looks most likely that minute wave iv may morph into a combination.
The first structure in a possible double combination may be a completed zigzag labelled minuette wave (w).
The double may be joined by a completed three in the opposite direction, an expanded flat labelled minuette wave (x).
The second structure in a possible double combination would be very likely to be a flat correction; the most common two structures to make up a double combination are one zigzag and by a very wide margin one flat.
Within the flat correction of minuette wave (y), subminuette wave b has met the minimum requirement of 0.9 the length of subminuette wave a. If subminuette wave b continues higher, it may move beyond the start of subminuette wave a at 2,863.43 as in an expanded flat.
If subminuette wave b does make a new high above the start of subminuette wave a, then it should exhibit clear weakness. A new high with any reasonable signs of strength would see this wave count discarded.
Minuette wave (y) would be most likely to end about the same level as minuette wave (w) at 2,798, so that the whole structure has a typical sideways look. The purpose of second structures in a combination is to take up time and move price sideways. Combinations are analogous to flag patterns in classic technical analysis.
This possible combination may take a few more days to complete. Support about 2,800 would be expected to hold.
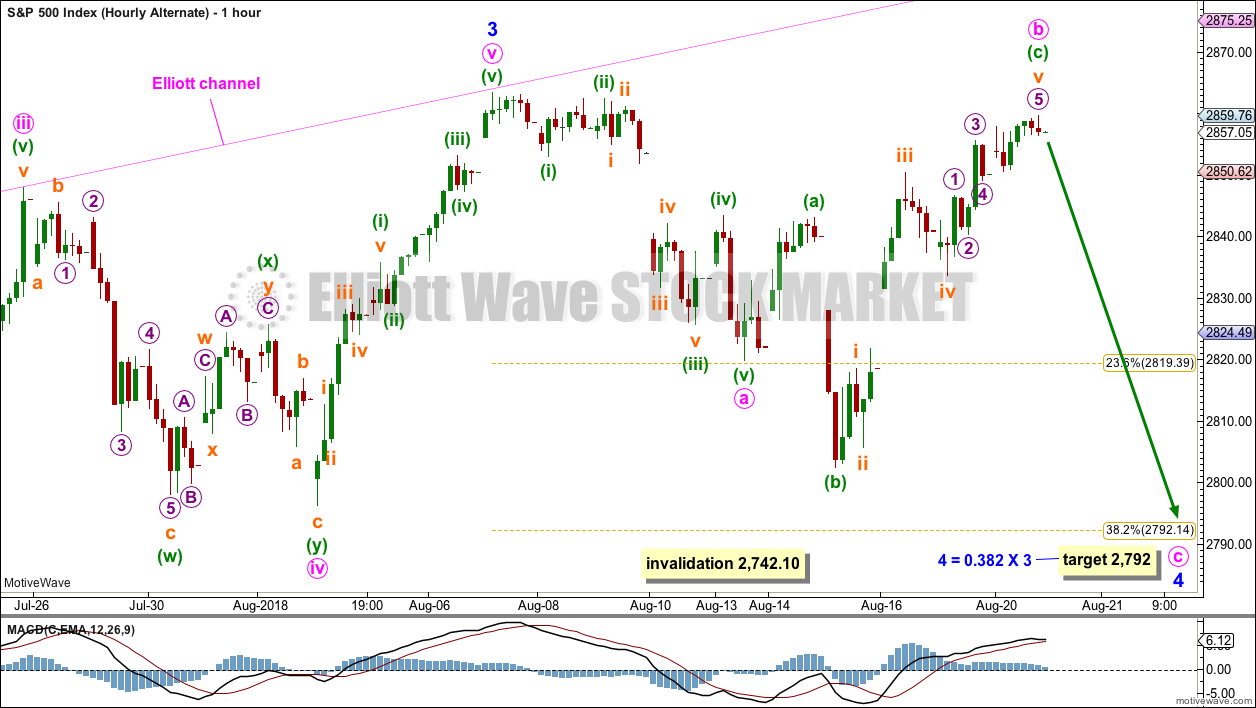
ALTERNATE HOURLY CHART
Click chart to enlarge.
Here, the degree of labelling within minute wave iv is moved up one degree.
It is possible that minute wave iv could be over more quickly than was expected. If minute wave iv is over, then the possibility of an earlier than expected end to minute wave v must be considered.
Minor wave 3 may have been over at the last high. Minute wave v is seen as a five wave impulse in order for this wave count to work. This does not have as good a fit as the main wave count, which does see this wave as a zigzag.
Minor wave 4 may be a single zigzag. Within the single zigzag, minute wave a may be a complete impulse, minute wave b may now be a complete expanded flat, and minute wave c would be most likely to end at least below the end of minute wave a at 2,819.88 to avoid a truncation. The target remains the same.
When a zigzag may be complete, then that may be minor wave 4 in its entirety, or the degree of labelling may be moved down one degree and only minute wave a of a flat or triangle may be complete. The degree of labelling would be decided at that point based upon the look on the daily chart in terms of proportion to minor wave 2.
Minor wave 4 may be reasonably expected to last at least about two weeks, and possibly up to about four weeks. It would most likely end somewhere within the fourth wave of one lesser degree; minute wave iv has its range from 2,843.03 to 2,796.34. If it does not end here, then it may end about the 0.382 Fibonacci ratio of minor wave 3 at 2,792.
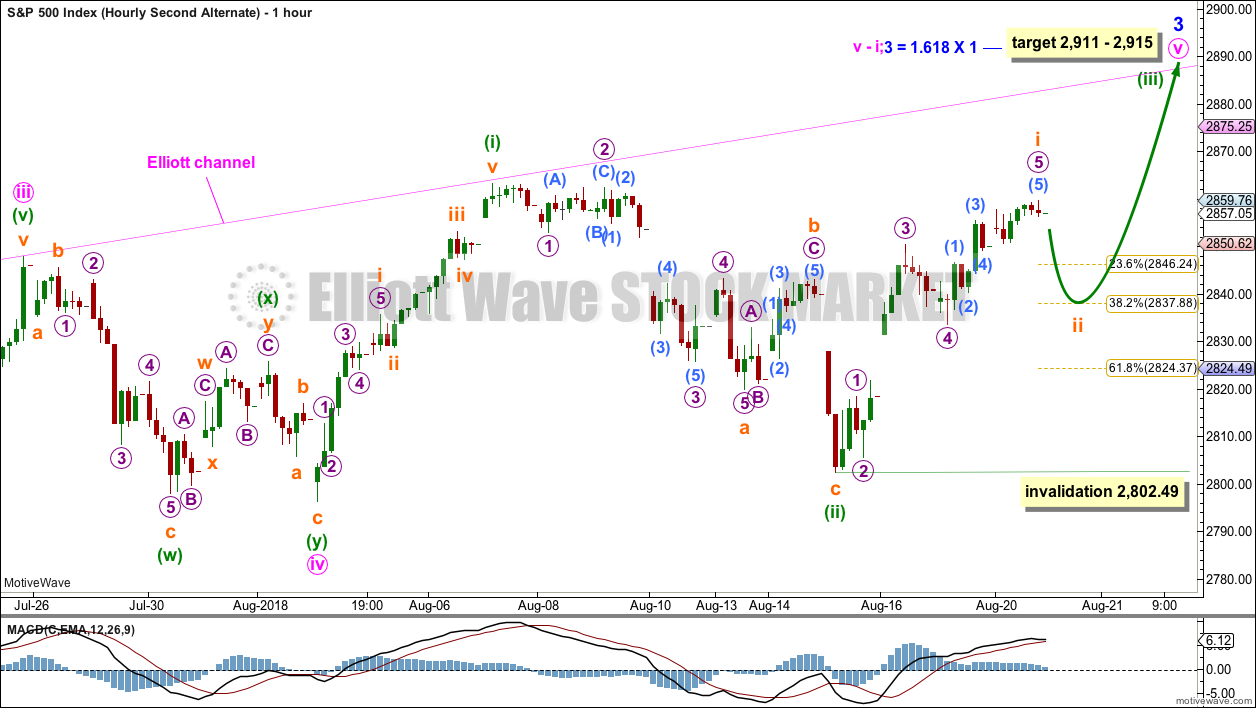
SECOND ALTERNATE HOURLY CHART
Click chart to enlarge.
This second alternate wave count moves the degree of labelling within the last upwards wave down one degree. Minute wave v may be incomplete, and only minuette wave (i) within it may be complete.
Minuette wave (ii) is labelled as complete single zigzag.
This wave count expects an increase in upwards momentum as minuette wave (iii) moves higher.
Within minuette wave (iii), the correction for subminuette wave ii may not move beyond the start of subminuette wave i below 2,802.49.
If price makes a new high with strength, then this may be the main wave count.
TECHNICAL ANALYSIS
WEEKLY CHART
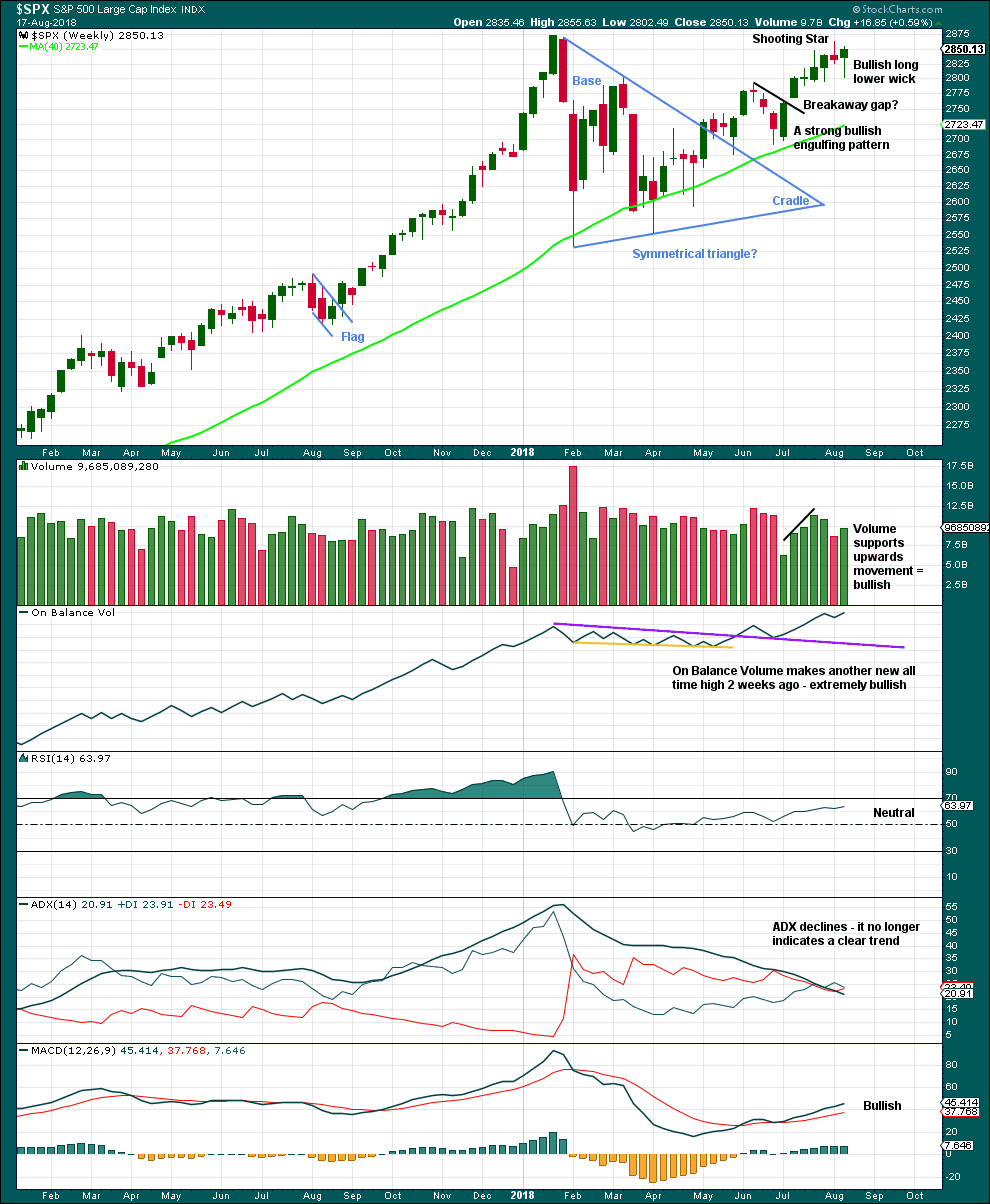
Click chart to enlarge. Chart courtesy of StockCharts.com.
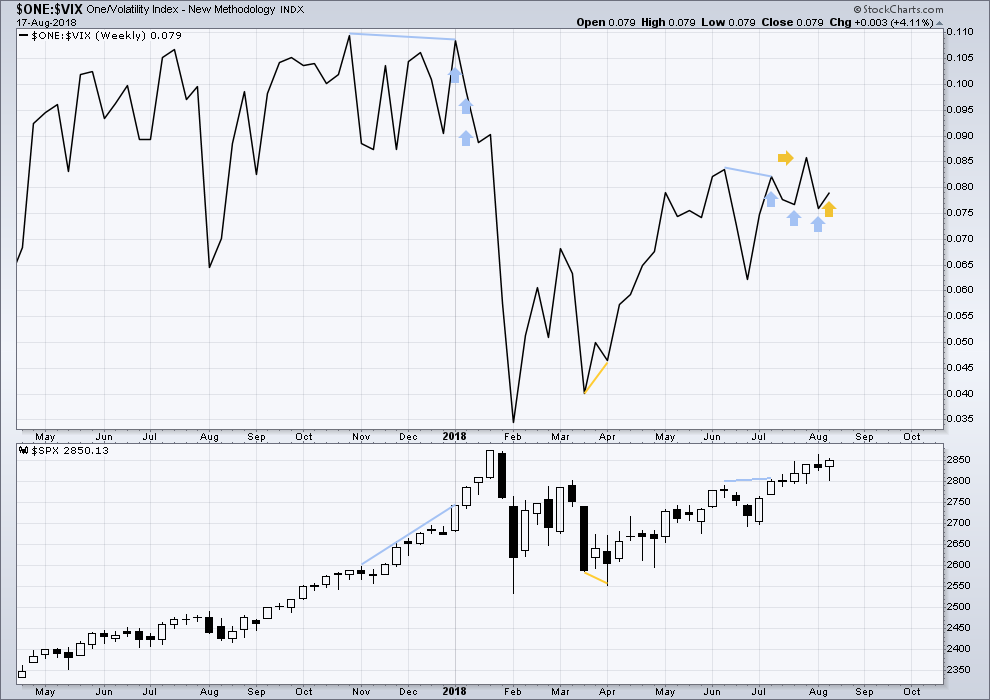
The Shooting Star candlestick reversal pattern has been followed by a downwards week. It may yet be followed by more downwards movement, but the strength of this last weekly candlestick suggests it may not.
Price moved lower last week, but the balance of volume was upwards and the candlestick closed green. Upwards movement during the week has support from volume, but for clarity we should look inside the week at daily volume bars.
The long lower wick and a close very close to highs suggests a little more upwards movement this week.
DAILY CHART
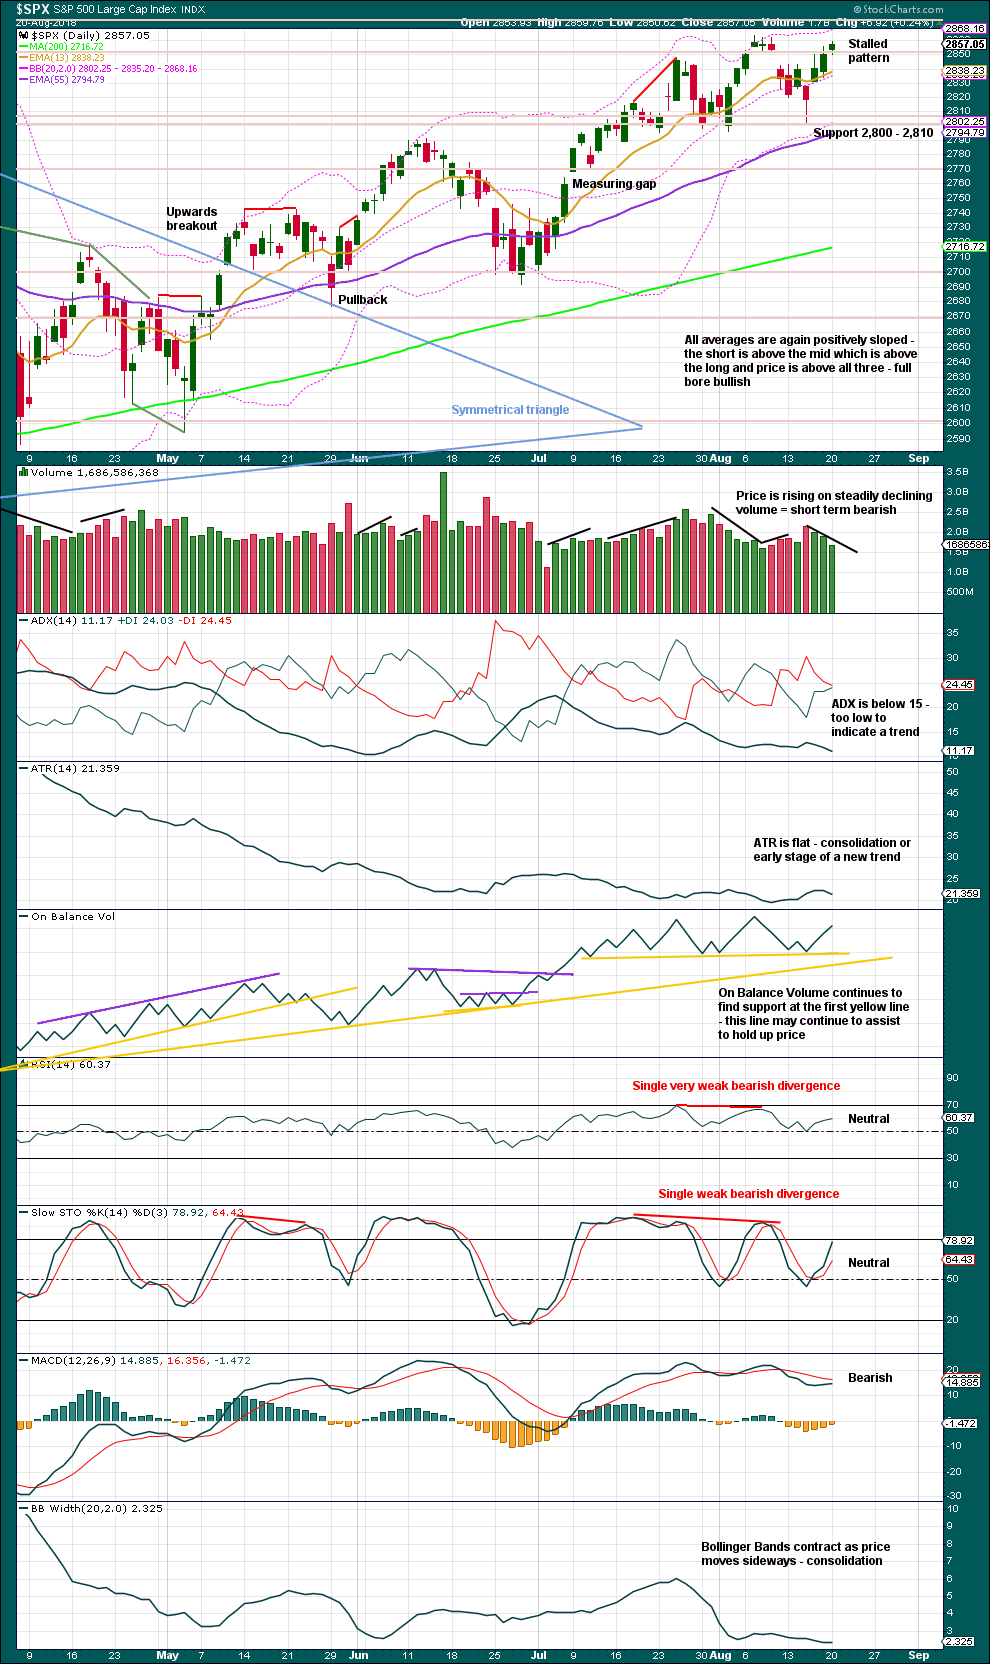
Click chart to enlarge. Chart courtesy of StockCharts.com.
The symmetrical triangle may now be complete. The base distance is 340.18. Added to the breakout point of 2,704.54 this gives a target at 3,044.72. This is above the Elliott wave target at 2,922, so the Elliott wave target may be inadequate.
Since the low on the 2nd of April, 2018, price has made a series of higher highs and higher lows. This is the definition of an upwards trend. But trends do not move in perfectly straight lines; there are pullbacks and bounces along the way.
Support about 2,800 remains very strong with three recent tests and no close below this point. Each test of this support area strengthens its technical significance.
Support at the first yellow line for On Balance Volume has now been tested five times. This line now has very reasonable technical significance. It looks like a small consolidation may complete. Expect support at 2,800 is very likely now to hold.
The bigger picture remains extremely bullish with another new all time high from On Balance Volume as recently as the 7th of August.
The short term picture looks a little bearish with a Stalled candlestick pattern and weak volume.
VOLATILITY – INVERTED VIX CHART
WEEKLY CHART
Click chart to enlarge. Chart courtesy of StockCharts.com. So that colour blind members are included, bearish signals
will be noted with blue and bullish signals with yellow.
To keep an eye on the all time high for inverted VIX a weekly chart is required at this time.
Notice how inverted VIX has very strong bearish signals four weeks in a row just before the start of the last large fall in price. At the weekly chart level, this indicator may be useful again in warning of the end of primary wave 3.
Some bearish divergence was noted two weeks ago. This has now been followed by a downwards week, so it may now be resolved.
Price moved lower for the last week, but inverted VIX moved higher. This divergence is bullish.
Inverted VIX is still some way off from making a new all time high.
DAILY CHART
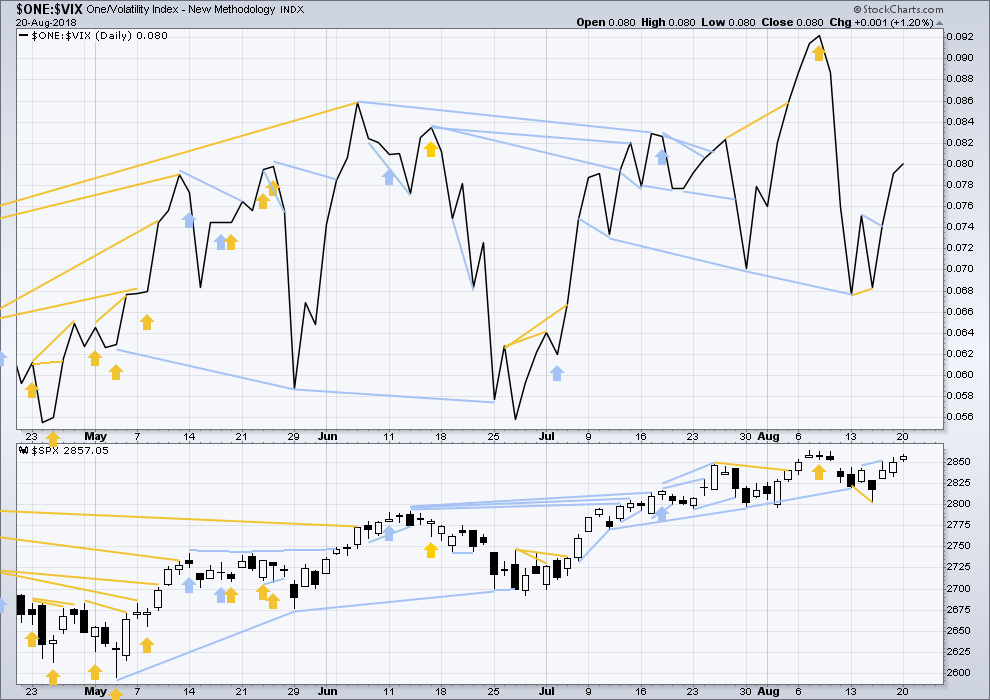
Click chart to enlarge. Chart courtesy of StockCharts.com. So that colour blind members are included, bearish signals
will be noted with blue and bullish signals with yellow.
Normally, volatility should decline as price moves higher and increase as price moves lower. This means that normally inverted VIX should move in the same direction as price.
Last noted mid term bearish divergence has not been followed yet by more downwards movement. It may still indicate downwards movement ahead as there is now a cluster of bearish signals from inverted VIX.
Short term bearish divergence noted in last analysis has been followed by upwards movement, so it is considered to have failed. There is no new divergence.
BREADTH – AD LINE
WEEKLY CHART
Click chart to enlarge. Chart courtesy of StockCharts.com.
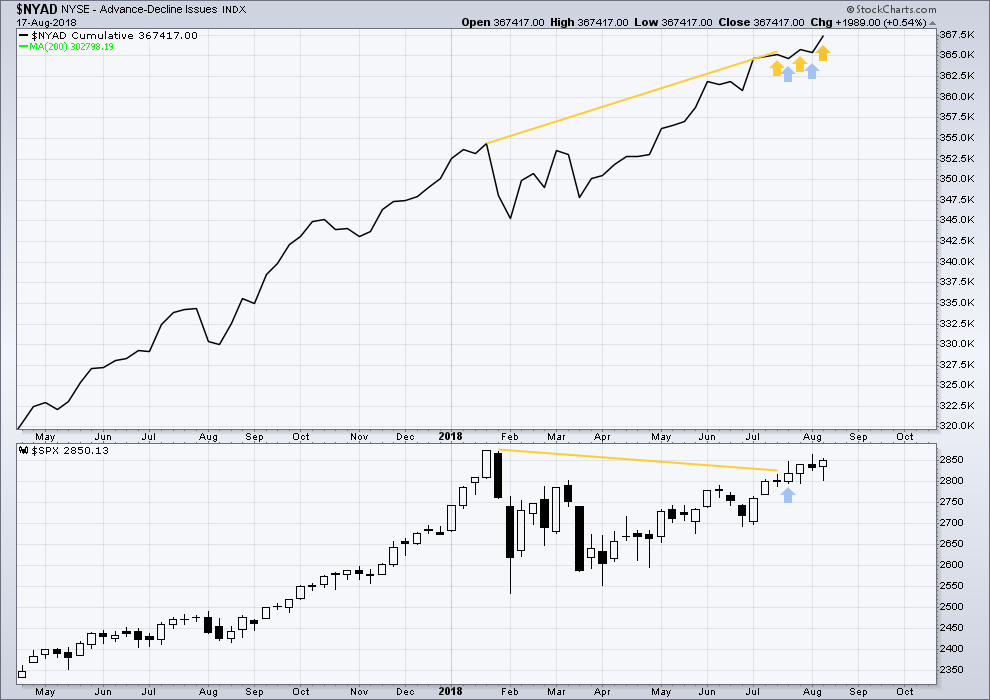
When primary wave 3 comes to an end, it may be valuable to watch the AD line at the weekly time frame as well as the daily.
At this stage, there is very strong bullish divergence between price and the AD line at the weekly time frame. With the AD line making new all time highs, expect price to follow through with new all time highs in coming weeks.
Another new all time high from the AD line last week is extremely bullish.
DAILY CHART
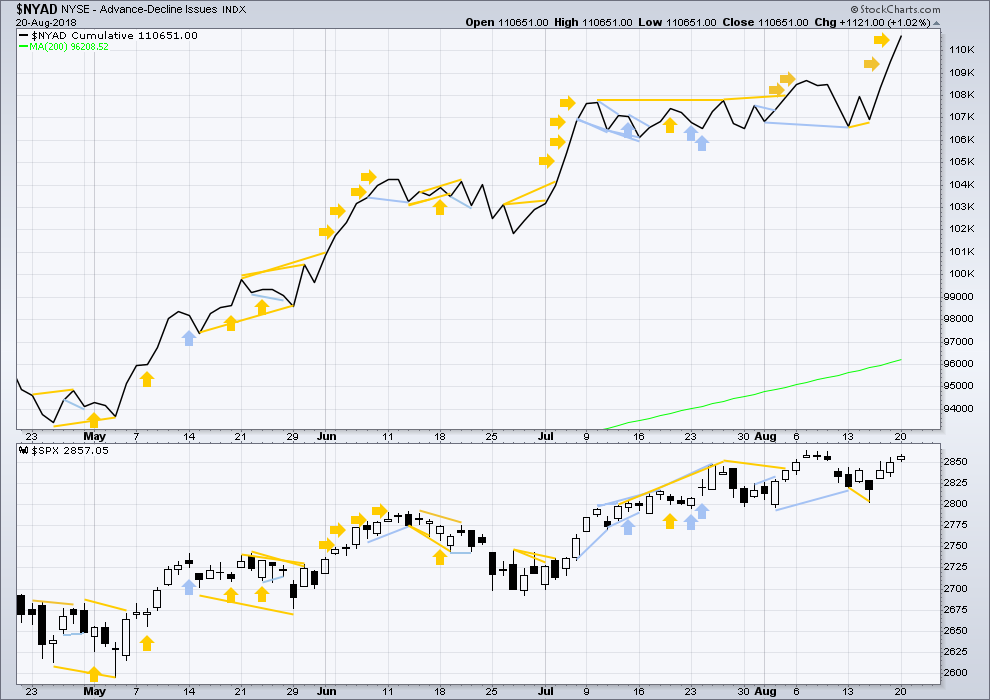
Click chart to enlarge. Chart courtesy of StockCharts.com.
There is normally 4-6 months divergence between price and market breadth prior to a full fledged bear market. This has been so for all major bear markets within the last 90 odd years. With no longer term divergence yet at this point, any decline in price should be expected to be a pullback within an ongoing bull market and not necessarily the start of a bear market. New all time highs from the AD line means that any bear market may now be an absolute minimum of 4 months away. It may of course be a lot longer than that. My next expectation for the end of this bull market may now be October 2019.
Breadth should be read as a leading indicator.
The AD line has made another new all time high at the daily chart level. This is extremely bullish.
Small caps made another new all time high today. Mid caps have made new all time highs on the 7th of August. Only large caps have to follow through; they do usually lag in the latter stages of a bull market.
Both small and mid caps have Stalled candlestick patterns today, which looks bearish for the very short term at least. This is not a major reversal pattern, but it does indicate short term weakness from bulls.
DOW THEORY
The following lows need to be exceeded for Dow Theory to confirm the end of the bull market and a change to a bear market:
DJIA: 23,360.29.
DJT: 9,806.79.
S&P500: 2,532.69.
Nasdaq: 6,630.67.
Only Nasdaq at this stage is making new all time highs, with another new all time high on the 25th of July. DJIA and DJT need to make new all time highs for the ongoing bull market to be confirmed.
Charts showing each prior major swing low used for Dow Theory may be seen at the end of this analysis here.
Published @ 10:11 p.m. EST.
Wow JPMorgan Chase offering 100 free trades first year (any account size) and 100 free a year thereafter with accounts > $15k. Going deep discount to suck up the low end retail trade $$ and customers. Ameritrade drops 7%! Now let’s see about my AMTD position….oh, snap! I just happened to oh so inappropriately take my smaller than target profits yesterday. Bloody nice. Never hurts to be reminded in a positive way that more time in market means MORE RISK!
PFE has gone exponential and is showing a very bearish candle at the top on the weekly now. I’ve purchased super cheap (0.13) puts for Sept 21 at 40 (PFE at 42.2 now). Not a recommendation, that’s for sure. But I still like the trade. Lots of potential for a dip in prices over the next few weeks.
While at the daily chart level this upwards trend is choppy, with lots of reasonable sized pullbacks lasting days to weeks, we do again now have another higher high and higher low.
And so depending upon strength or weakness, this might become the main wave count today.
The other idea of a combination remains valid.
The triangle is invalidated today.
Makes sense that a ii down would form here, the move up is a near perfect hit on the ATH. The prior iv zone lies right on top of the 38% retrace at 2846.5, and there a 78% just above it from another swing at 2849. So I’m right there w/Rodney’s call of 2850 as a likely turn spot.
2963 might provide support here though. Hard to know for absolute certain that the extended v wave up is really over, until some hourly pivot lows get broken. Though the daily candle is now looking very bearish and pivot high-ish!
Lara has continually stated in her commentaries something like, Triangles quite often look like a good count until they morph into something else. It is quite common. Today we have the busted triangle count as a present example to remember.
That said, now the important question is, “Where is the next correction and of what degree?” As of now I am thinking it is not too far away (days perhaps) and will take us to the 2850 level or below when it comes.
Have a great day. All my accounts are ringing ‘green’.
Yep. That’s exactly why I had a combination wave count. Because that’s almost always what it turns out to be when a triangle is invalidated.
The SPX hourly MACD is about the make a bearish cross. Take heed.
If SPX closses red, I think this would be a strong signal that another correction has begun.
This pretty much sums up why I think higher time frame squeezes are often money. RUT daily.
that was a very good call Kevin, just like most of your other calls 🙂 I really value your input on this forum. But RUT is also close to its fibo clusters you talked about yesterday. So looking for a small turn soon…
Certainly look for a small turn, and off a cluster is more significant.
It is VERY common that that kind of squeeze when blown out of is followed by 5+ bars of solid up. Not every time…but enough that I will remain very bullish here in RUT and attempt to continue to capitalize, by taking the pullbacks and turns back up.
“Careful with that axe, Eugene”
A good day to not be long volatility. Though a great VIX long set up will be upcoming in a few days.
I always thought the second alternate hourly seemed more likely. Another leg down as required by the combo etc. just didn’t feel right to me at all, particularly with the set ups in the other markets indicating upward range expansion coming shortly.
The thoroughness in Lara’s work that gives us the potential alternatives is extremely valuable to me! I make my own calls in the end…but having A, B and C to choose from where ONE of them is almost CERTAINLY correct is dynamite.
I agree, Kevin. Triangle looks busted for sure, but this move up seems to be weak. I could be wrong. Waiting for better clarity.
I think those days of frequent 1-2% moves are over for now. “Strong” in the environment today is exactly like this, up 0.5%-ish. Not to say we won’t have stronger moves occasionally, but the daily average true range is dropping fast. The action in the 6 months following Jan 28 drove it way up. To me, today is plenty strong across the board, and I’ve done particularly well in RUT and NDX (options on IWM and QQQ).
The b wave up that lara highlighted Aug 17 had a range of about 1863-79, right where we are at. I think it is peculiar that the VIX really isn’t diving that quickly right here. It may go down quite a bit more as you say but you never know if this b wave is over then we could have a spike in volativity.
just an observation: Dow Inustrials right now on second day above its BB, with an overbought slow stochastic. It doesn’t have much room if any to keep going higher at current price. Looks like a wave 2 correction should be happening about now, or very soon…
Looking for a reversal here resulting in long upper wick to signal a pullback.
We’ll see…
Trading short on an up trend day can be hazardous to your account balance, if that’s what you are thinking. Overall there’s lots of room for DJX to keep moving up (though I agree it’s extended at the moment). If I was trading it (I’m not), I wouldn’t remotely consider a short here. I’d be all about proper conditions to get long and in line with the dominant trend.
oil concerns are up a lot today and indicating trend change…but oil itself (/CL, hourly chart) while up, isn’t up so much and has not yet broken it’s more aggressive down trend line, though it has swing polarity inverted to “up”. I’ve used this opportunity to get out of a few oil related positions with very small profits; “always assume a trend continues”. Adding to the evidence in that regard is the fact that the current low is in no-man’s land (dead between fibo levels). A drop down to the 61.8% is possible if not likely.
The top of this SPX move will be….
2881. In a day or three. Then a multi-day consolidation or swing back down.
2873 could turn it. But I’m thinking it pushes past there. 2881 is the 1.272% extension of the 8/2 to 8/7 upswing.
Though…the highlighted area at the junction of the 1.618 extension and the upper major trend line is a very likely target/turn zone. 2905 mid to late this week.
So 2873, then 2881, then 2905, as key areas to watch for stalls/turns.
here’s the NDX breakout
Nice breakaway gap.
I prefer breakouts from more horizontal trend lines, more significant. But that looks good so far.
Expanded Flat?
Is Kevin the only one allowed to make comments?
The very first comment a member makes automatically goes into moderation. Now that you have a comment approved, all your future comments will be automatically published unless they have more than 2 links and unless you edit a comment with a link or attachment.
SPX Triangle appears to be in severe trouble if not under the gravestone yet. Second alternate hourly, whaddeyesaynow!!!!! Range expansion upward in RUT, upward trend line break in NDX, SPX pushing up past recent highs and resistance, the bulls are having a little party here.
The RUT daily is now finally showing a daily bar without a squeeze. Breakout to the upside…could run for days.
And SPX pops up above it’s recent highs and resistance!! Well well well…