
An upwards day that remains within the current small consolidation zone fits expectations for the main short term Elliott wave count, which expected more sideways movement.
Summary: It still looks most likely that price may continue sideways for another two to few days to complete a small triangle. Thereafter, the upwards trend should resume.
If the triangle is invalidated, then a combination may be unfolding sideways. This would expect strong support to remain about 2,800.
The bigger picture remains extremely bullish.
The mid to longer term target is at 2,922 (Elliott wave) or 3,045 (classic analysis). Another multi week to multi month correction is expected at one of these targets.
The final target for this bull market to end remains at 3,616.
Always practice good risk management. Always trade with stops and invest only 1-5% of equity on any one trade.
New updates to this analysis are in bold.
The biggest picture, Grand Super Cycle analysis, is here.
Last historic analysis with monthly charts is here, video is here.
ELLIOTT WAVE COUNT
WEEKLY CHART
Click chart to enlarge.
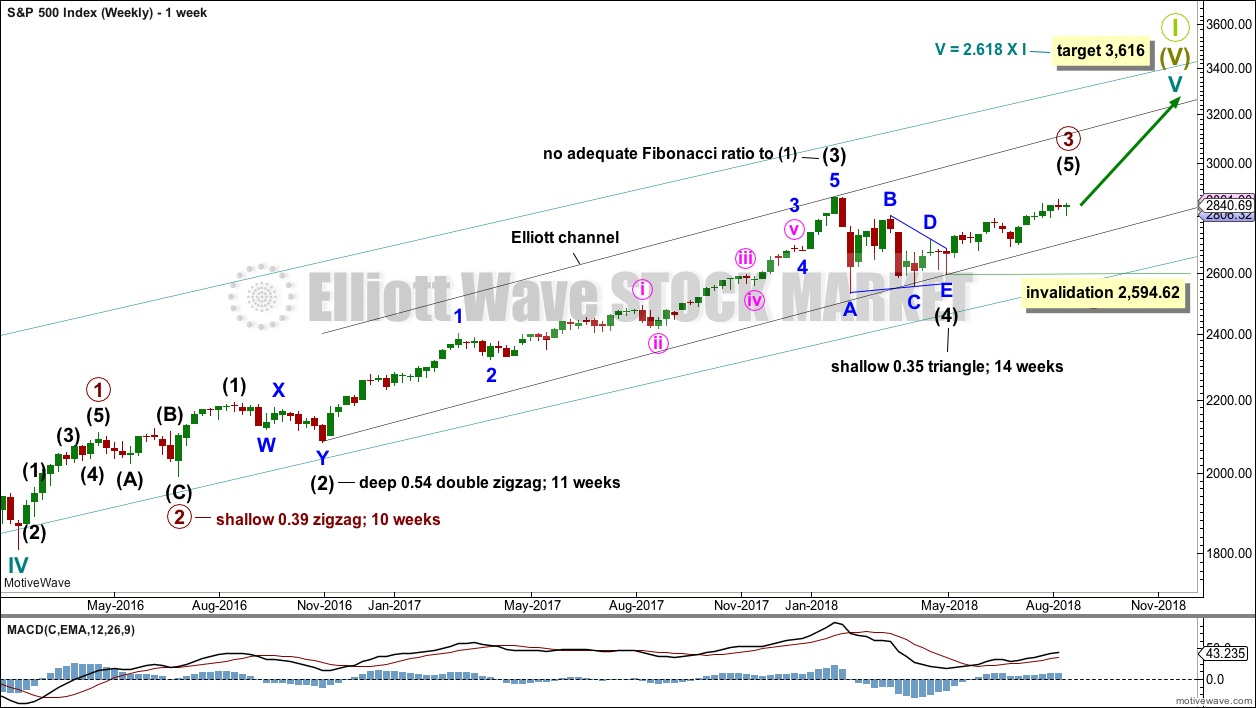
Cycle wave V must complete as a five structure, which should look clear at the weekly chart level and also now at the monthly chart level. It may only be an impulse or ending diagonal. At this stage, it is clear it is an impulse.
Within cycle wave V, the third waves at all degrees may only subdivide as impulses.
Intermediate wave (4) has breached an Elliott channel drawn using Elliott’s first technique. The channel is redrawn using Elliott’s second technique: the first trend line from the ends of intermediate waves (2) to (4), then a parallel copy on the end of intermediate wave (3). Intermediate wave (5) may end either midway within the channel, or about the upper edge.
Intermediate wave (4) may now be a complete regular contracting triangle lasting fourteen weeks, one longer than a Fibonacci thirteen. There is perfect alternation and excellent proportion between intermediate waves (2) and (4).
Within intermediate wave (5), no second wave correction may move beyond the start of its first wave below 2,594.62. However, the lower edge of the black Elliott channel drawn across the ends of intermediate degree waves should provide very strong support for any deeper pullbacks, holding price well above the invalidation point while intermediate wave (5) unfolds.
At this stage, the expectation is for the final target to me met in October 2019. If price gets up to this target and either the structure is incomplete or price keeps rising through it, then a new higher target would be calculated.
A multi week to multi month consolidation for primary wave 4 is expected on the way up to the final target.
The last bullish fifth wave of minor wave 5 to end intermediate wave (3) exhibited commodity like behaviour. It was strong and sustained. It is possible that the upcoming wave of minor wave 5 to end intermediate wave (5) to end primary wave 3 may exhibit similar behaviour, so we should be on the lookout for this possibility.
DAILY CHART
Click chart to enlarge.
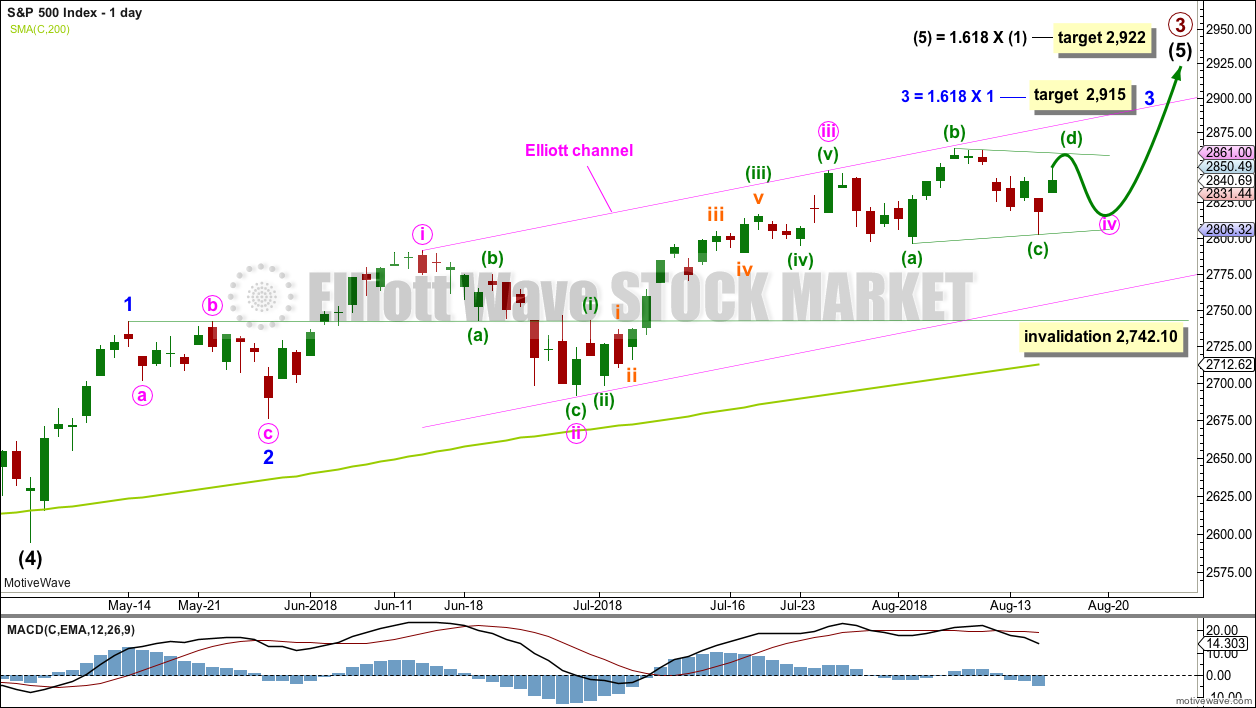
Intermediate wave (5) would be very likely to make at least a slight new high above the end of intermediate wave (3) at 2,872.87 to avoid a truncation.
Intermediate wave (3) exhibits no Fibonacci ratio to intermediate wave (1). It is more likely then that intermediate wave (5) may exhibit a Fibonacci ratio to either of intermediate waves (1) or (3). The most common Fibonacci ratio would be equality in length with intermediate wave (1), but in this instance that would expect a truncation. The next common Fibonacci ratio is used to calculate a target for intermediate wave (5) to end.
Intermediate wave (5) is unfolding as an impulse, and within it minor waves 1 and 2 are complete.
Minor wave 3 may only subdivide as an impulse. A target is calculated for minor wave 3 to end, which expects to see the most common Fibonacci ratio to minor wave 1. Minor wave 3 may last several weeks in total and should look like an impulse at the daily chart level. When it is complete, then minor wave 4 may last about one to two weeks in order for it to exhibit reasonable proportion to minor wave 2. Minor wave 4 may not move into minor wave 1 price territory below 2,742.10.
Within minor wave 3, minute waves i, ii and iii all look complete and minute wave iv may still be incomplete. If minute wave iv were to continue further, then it would have better proportion to minute wave ii and would exhibit alternation in structure. This idea also has support from classic technical analysis.
It is also possible that minute wave iv was over at the last low and minor wave 3 was over at the last high. A new low below 2,791.47 could not be a continuation of minute wave iv, so the correction at that stage would be labelled minor wave 4.
The channel is drawn using Elliott’s first technique. The upper edge has provided resistance. This channel is copied over to hourly charts.
If the main hourly wave count below is invalidated with a new low below 2,791.47 and price keeps on falling, then look for strong support about the lower edge of the Elliott channel on this daily chart; the pullback may end there.
MAIN HOURLY CHART – TRIANGLE
Click chart to enlarge.
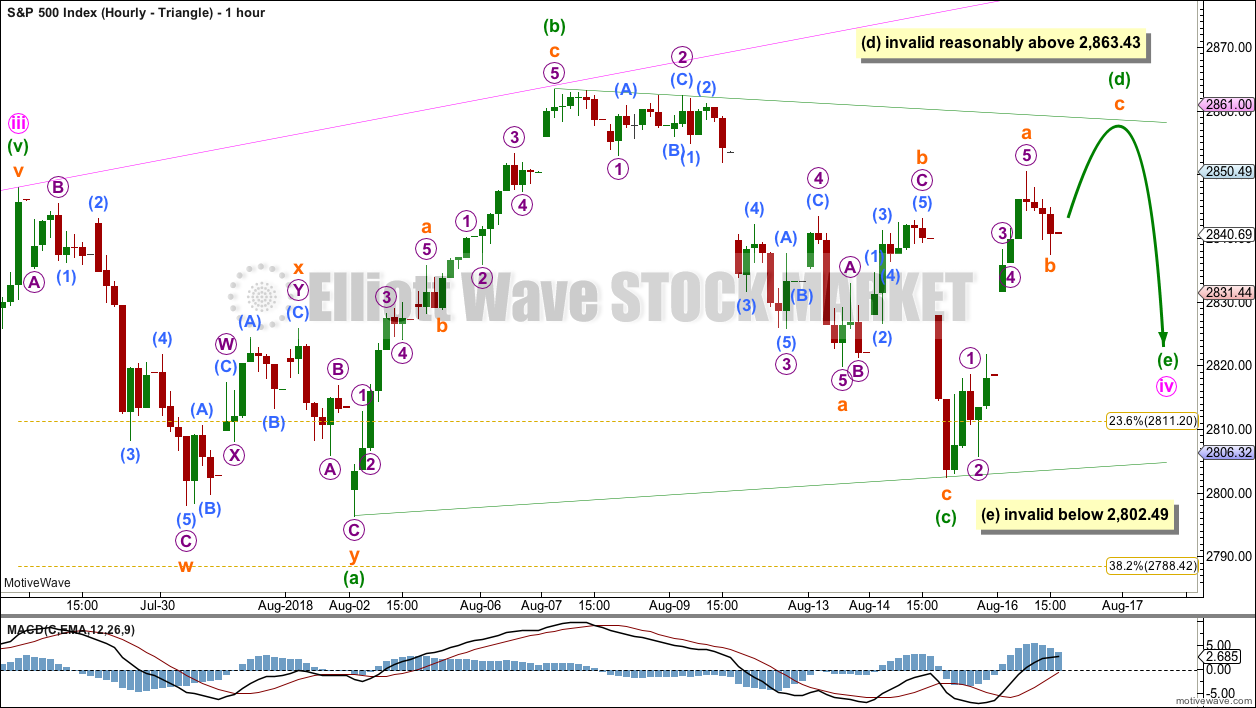
Only one sub-wave within a triangle may subdivide as a multiple and all remaining triangle sub-waves must be single corrective structures. In this example, minuette wave (a) fits best as a double zigzag.
Within a contracting triangle, minuette wave (d) may not move beyond the end of minuette wave (b) above 2,863.43. Contracting triangles are the most common type. Minuette wave (d) for a contracting triangle may end at resistance at the (b)-(d) trend line as it is drawn here, which sits across the highs within the start of minuette wave (c). Triangles normally adhere very well to their trend lines, and the trend lines are often tested within triangle sub-waves.
Within a barrier triangle, minuette wave (d) may end about the same level as minuette wave (b) in order for the (b)-(d) trend line to remain essentially flat. Minuette wave (d) may end slightly above minuette wave (b) and the triangle would remain valid; the upper invalidation point is not black and white. Barrier triangles are not the most common type, but they are still reasonably common.
For both a barrier and contracting triangle, minuette wave (e) may not move beyond the end of minuette wave (c) below 2,802.49. It would most likely fall short of the (a)-(c) trend line.
When Elliott wave triangles complete, the resulting movement out of them usually begins with strength.
MAIN HOURLY CHART – COMBINATION
Click chart to enlarge.
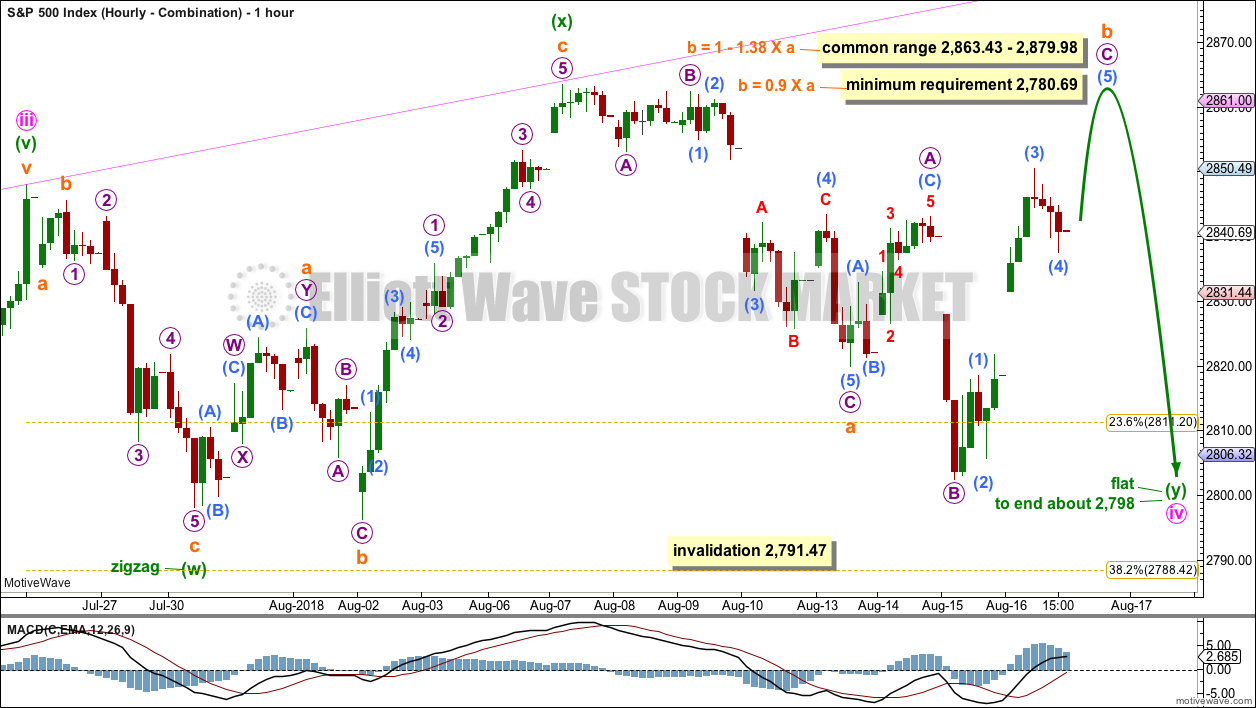
If the triangle is invalidated, then at this stage it looks most likely that minute wave iv may morph into a combination.
The first structure in a possible double combination may be a completed zigzag labelled minuette wave (w).
The double may be joined by a completed three in the opposite direction, an expanded flat labelled minuette wave (x).
The second structure in a possible double combination would be very likely to be a flat correction; the most common two structures to make up a double combination are one zigzag and by a very wide margin one flat.
If minuette wave (y) unfolds as a flat correction, then within it subminuette wave b must retrace a minimum 0.9 length of subminuette wave a. Subminuette wave b may make a new high above the start of subminuette wave a as in an expanded flat correction.
If subminuette wave b does make a new high above the start of subminuette wave a, then it should exhibit clear weakness. A new high with any reasonable signs of strength would see this wave count discarded.
Minuette wave (y) would be most likely to end about the same level as minuette wave (w) at 2,798, so that the whole structure has a typical sideways look. The purpose of second structures in a combination is to take up time and move price sideways. Combinations are analogous to flag patterns in classic technical analysis.
This possible combination may take a few more days to complete. Support about 2,800 would be expected to hold.
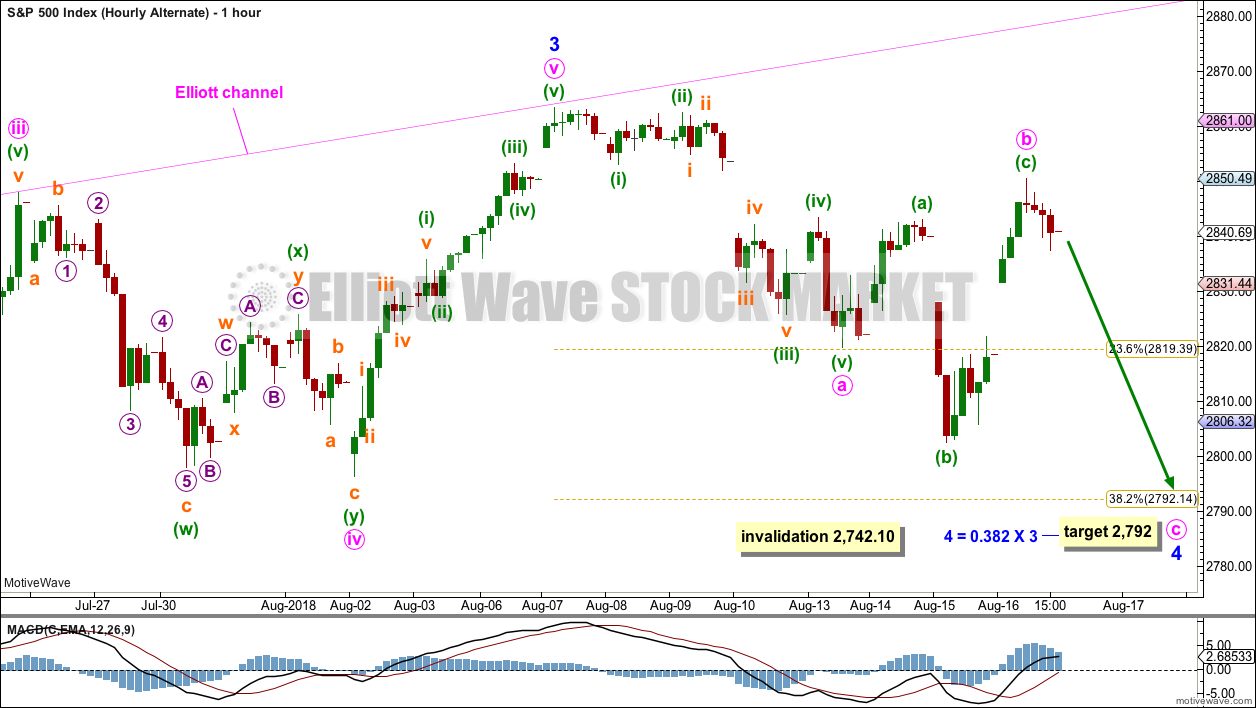
ALTERNATE HOURLY CHART
Click chart to enlarge.
Here, the degree of labelling within minute wave iv is moved up one degree.
It is possible that minute wave iv could be over more quickly than was expected. If minute wave iv is over, then the possibility of an earlier than expected end to minute wave v must be considered.
Minor wave 3 may have been over at the last high. Minute wave v is seen as a five wave impulse in order for this wave count to work. This does not have as good a fit as the main wave count, which does see this wave as a zigzag.
The structure of minor wave 4 is changed again today to consider a single zigzag. Within the single zigzag, minute wave a may be a complete impulse, minute wave b may now be a complete expanded flat, and minute wave c would be most likely to end at least below the end of minute wave a at 2,819.88 to avoid a truncation. The target remains mostly the same.
When a zigzag may be complete, then that may be minor wave 4 in its entirety, or the degree of labelling may be moved down one degree and only minute wave a of a flat or triangle may be complete. The degree of labelling would be decided at that point based upon the look on the daily chart in terms of proportion to minor wave 2.
Minor wave 4 may be reasonably expected to last at least about two weeks, and possibly up to about four weeks. It would most likely end somewhere within the fourth wave of one lesser degree; minute wave iv has its range from 2,843.03 to 2,796.34. If it does not end here, then it may end about the 0.382 Fibonacci ratio of minor wave 3 at 2,792.
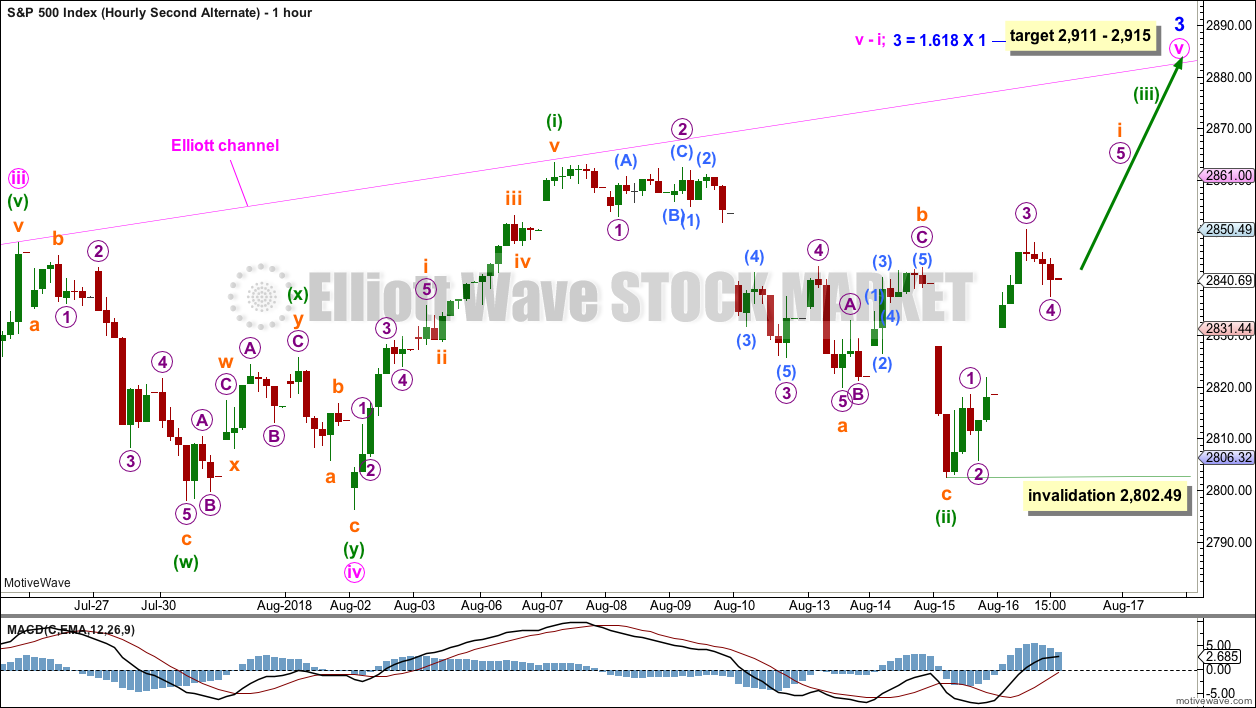
SECOND ALTERNATE HOURLY CHART
Click chart to enlarge.
This second alternate wave count moves the degree of labelling within the last upwards wave down one degree. Minute wave v may be incomplete, and only minuette wave (i) within it may be complete.
Minuette wave (ii) is labelled as complete single zigzag.
This wave count expects an increase in upwards momentum as minuette wave (iii) moves higher.
Within minuette wave (iii), the correction for subminuette wave ii may not move beyond the start of subminuette wave i below 2,802.49.
TECHNICAL ANALYSIS
WEEKLY CHART
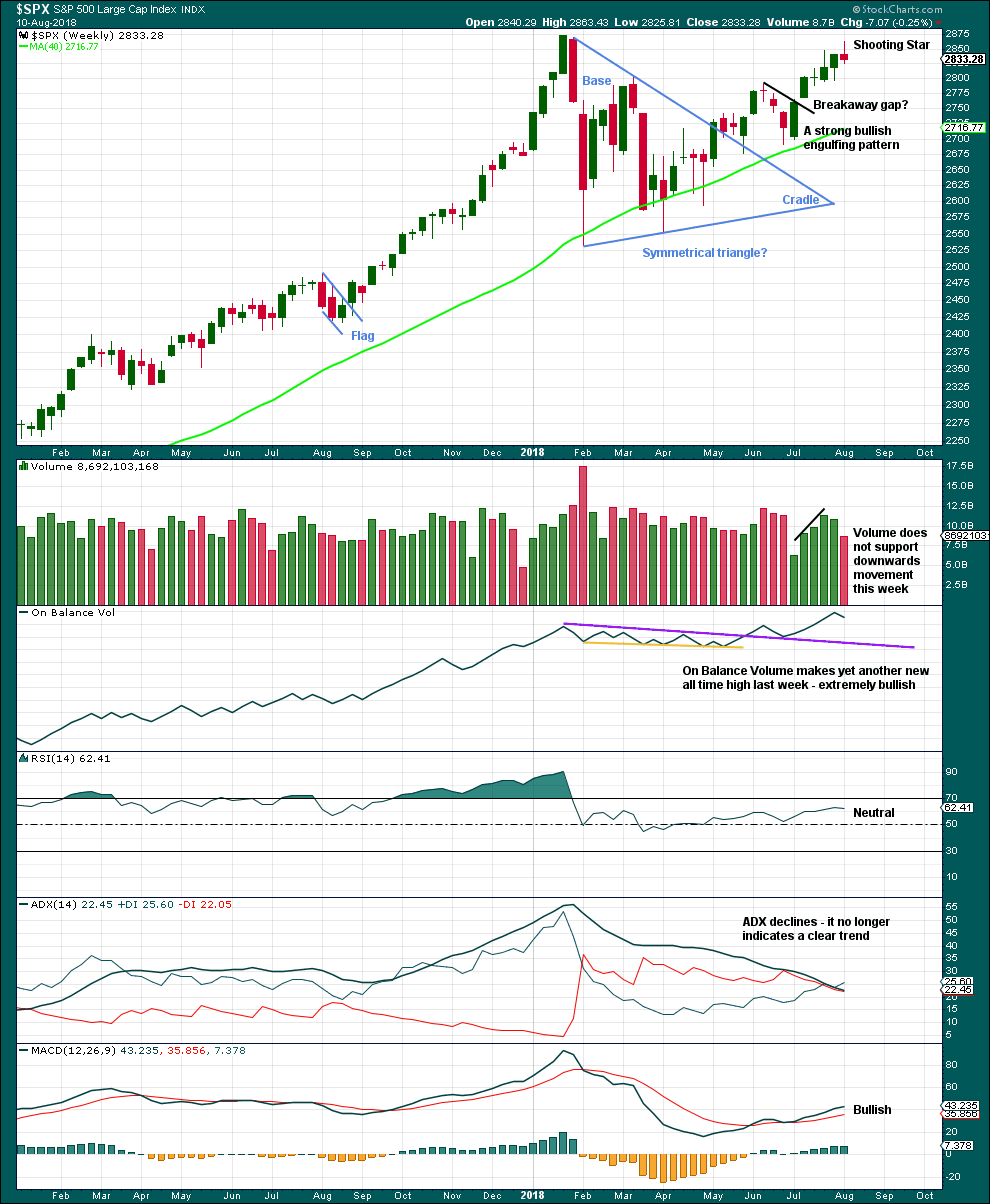
Click chart to enlarge. Chart courtesy of StockCharts.com.
Another new high for On Balance Volume last week remains very bullish indeed, but that does not preclude another small pullback within this developing upwards trend. It is still expected that price is very likely to make new all time highs, but it will not move in a straight line.
Last week’s candlestick is a Shooting Star pattern. This is a bearish reversal pattern when it comes after an upwards trend. Look for a downwards week this week.
DAILY CHART
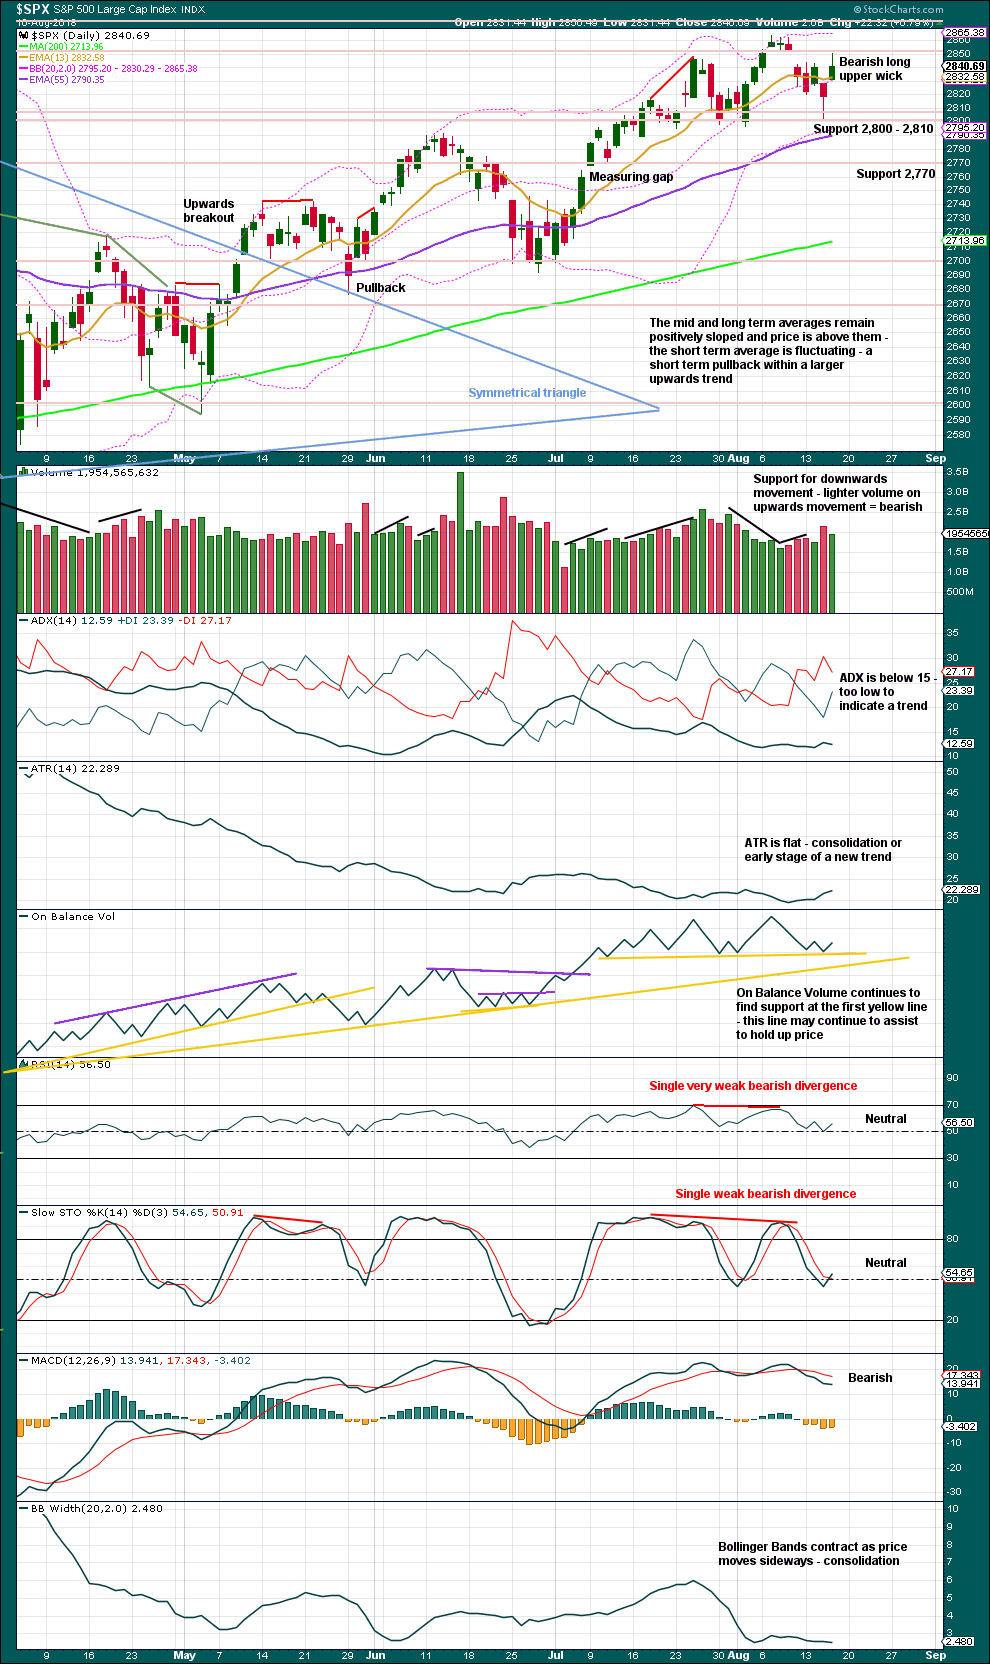
Click chart to enlarge. Chart courtesy of StockCharts.com.
The symmetrical triangle may now be complete. The base distance is 340.18. Added to the breakout point of 2,704.54 this gives a target at 3,044.72. This is above the Elliott wave target at 2,922, so the Elliott wave target may be inadequate.
Since the low on the 2nd of April, 2018, price has made a series of higher highs and higher lows. This is the definition of an upwards trend. But trends do not move in perfectly straight lines; there are pullbacks and bounces along the way.
Support about 2,800 remains very strong with three recent tests and no close below this point. Each test of this support area strengthens its technical significance.
Support at the first yellow line for On Balance Volume has now been tested five times. This line now has very reasonable technical significance. It looks like a small consolidation may complete. Expect support at 2,800 is very likely now to hold.
For the very short term, a long upper wick today looks like a downwards day may result tomorrow.
The bigger picture remains extremely bullish with another new all time high from On Balance Volume as recently as the 7th of August.
If On Balance Volume breaks below first support, there is a new support line which may allow for another one or two days of downwards movement. Both support lines have reasonable technical significance.
VOLATILITY – INVERTED VIX CHART
WEEKLY CHART
Click chart to enlarge. Chart courtesy of StockCharts.com. So that colour blind members are included, bearish signals
will be noted with blue and bullish signals with yellow.
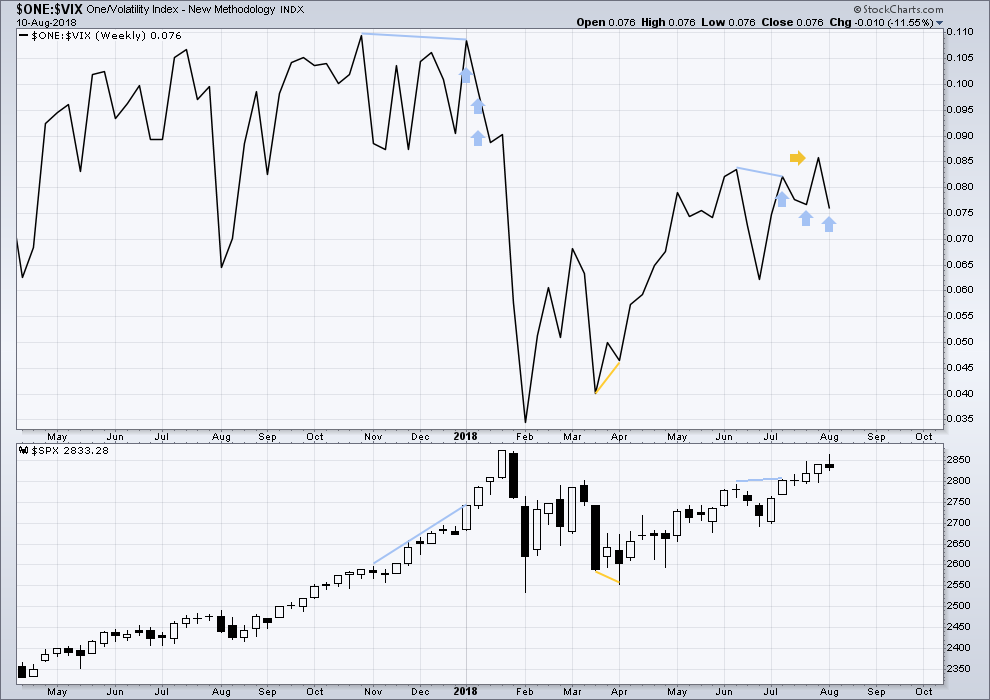
To keep an eye on the all time high for inverted VIX a weekly chart is required at this time.
Notice how inverted VIX has very strong bearish signals four weeks in a row just before the start of the last large fall in price. At the weekly chart level, this indicator may be useful again in warning of the end of primary wave 3.
Last week completes an upwards week with a higher high and a higher low.
While price moved higher, inverted VIX moved lower. Downwards movement during last week does not have support from increasing market volatility. This divergence is bearish.
Inverted VIX is still some way off from making a new all time high.
DAILY CHART
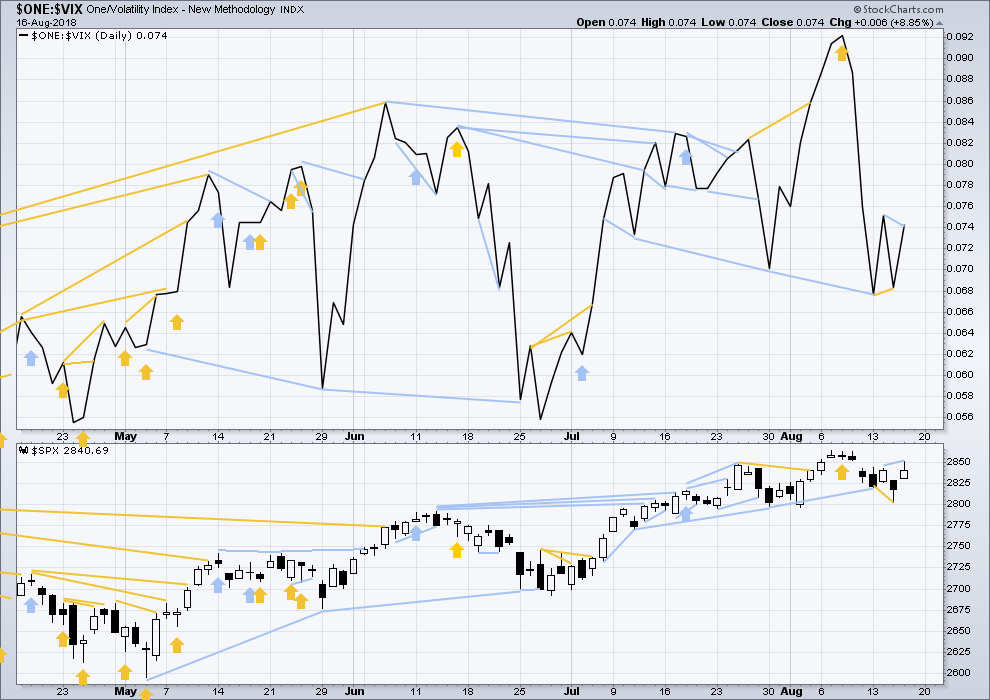
Click chart to enlarge. Chart courtesy of StockCharts.com. So that colour blind members are included, bearish signals
will be noted with blue and bullish signals with yellow.
Normally, volatility should decline as price moves higher and increase as price moves lower. This means that normally inverted VIX should move in the same direction as price.
Last noted mid term bearish divergence has not been followed yet by more downwards movement. It may still indicate downwards movement ahead as there is now a cluster of bearish signals from inverted VIX.
Short term bullish divergence noted yesterday has now been followed by an upwards day. It may now be resolved.
Price today has made a new high above the high two sessions prior, but inverted VIX has failed to make a corresponding new high. Upwards movement today does not have support from a corresponding decline in market volatility. This short term divergence is bearish.
BREADTH – AD LINE
WEEKLY CHART
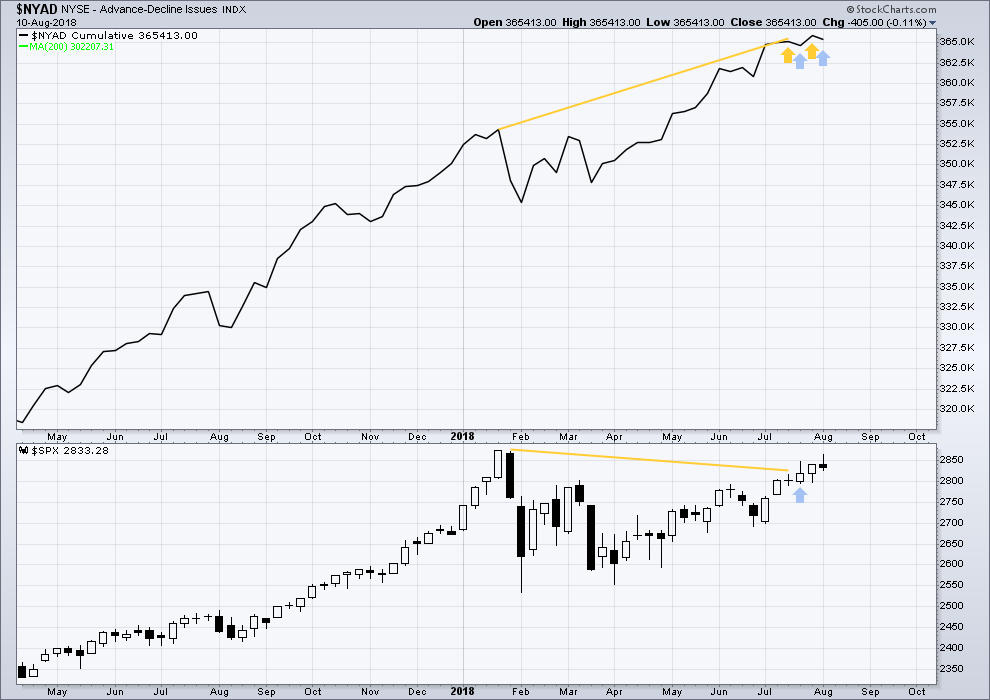
Click chart to enlarge. Chart courtesy of StockCharts.com.
When primary wave 3 comes to an end, it may be valuable to watch the AD line at the weekly time frame as well as the daily.
At this stage, there is very strong bullish divergence between price and the AD line at the weekly time frame. With the AD line making new all time highs, expect price to follow through with new all time highs in coming weeks.
Price last week has moved higher, but the AD line has moved lower.
Upwards movement within this last week does not have support from rising market breadth. This divergence is bearish for the short term.
DAILY CHART
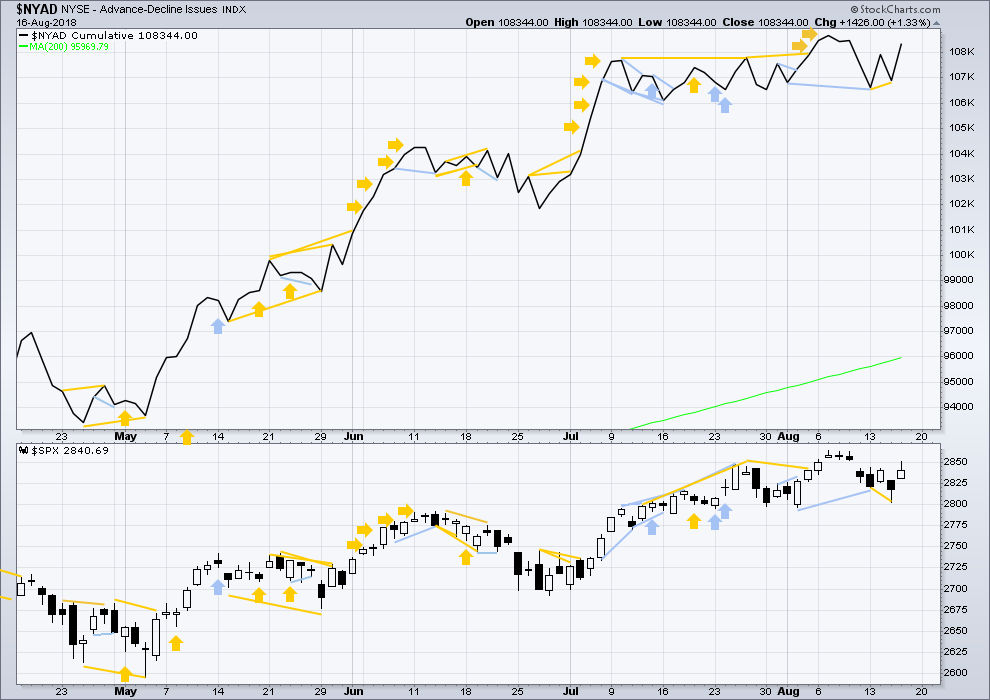
Click chart to enlarge. Chart courtesy of StockCharts.com.
There is normally 4-6 months divergence between price and market breadth prior to a full fledged bear market. This has been so for all major bear markets within the last 90 odd years. With no longer term divergence yet at this point, any decline in price should be expected to be a pullback within an ongoing bull market and not necessarily the start of a bear market. New all time highs from the AD line means that any bear market may now be an absolute minimum of 4 months away. It may of course be a lot longer than that. My next expectation for the end of this bull market may now be October 2019.
Breadth should be read as a leading indicator.
Short term bullish divergence noted in last analysis has now been followed by an upwards day, so it may now be resolved.
Both price and the AD line moved higher today, both making new highs above the high two sessions prior. Upwards movement today has support from rising market breadth. There is no divergence today, and this is bullish.
Small caps made another new all time high on the 14th of August. Mid caps have made new all time highs on the 7th of August. Only large caps have to follow through; they do usually lag in the latter stages of a bull market.
DOW THEORY
The following lows need to be exceeded for Dow Theory to confirm the end of the bull market and a change to a bear market:
DJIA: 23,360.29.
DJT: 9,806.79.
S&P500: 2,532.69.
Nasdaq: 6,630.67.
Only Nasdaq at this stage is making new all time highs, with another new all time high on the 25th of July. DJIA and DJT need to make new all time highs for the ongoing bull market to be confirmed.
Charts showing each prior major swing low used for Dow Theory may be seen at the end of this analysis here.
Published @ 07:40 p.m. EST.
Hourly triangle chart updated:
Just one slight new high may complete a five wave impulse for subminuette c, that could complete minuette wave (d) of the triangle.
The (b)-(d) trend line looks pretty good there.
And then next week a very small pullback for minuette wave (e) to fall well short of the (a)-(c) trend line could complete a running contracting triangle.
Because within subminuette c the small correction of micro wave 4 may not move into micro wave 1 price territory, a new low short term below 2,846.72 would tell us that it cannot be micro wave 4, that micro waves 4 and 5 should be over and so minuette (d) should then be over.
At that stage expect minuette (e) downwards is underway.
Hi Lara
Can you please provide the link to your most recent USD index analysis?
Sure, it’s here.
You can find lots of my public analysis on Elliott Wave Gold. From the main header menu, choose Analysis > Public
Once in there, you can refine the search by using the Categories menu on the RH sidebar. It’s a drop down menu.
I’m doing around about one a week of either USD Index, BitCoin or EURUSD.
TLT has reach a cusp, running into an established medium term (8+ months) trend line, right at a couple of retrace fibo levels. The daily trend is strong up. A turn here would be significant, and if it comes, I may add to my TLT shorts. I see 116 beckoning down there.
Or is it (e) time?
Maybe close today’s gap?
Could be. Eventually the v up kicks off and these levels will be in play.
If this is a triangle, it’s got awfully shallow top and bottom trend lines. But yea, it is a triangle still, and I suspect an E probably is coming. Let’s get this iv over with!
The lay of the over head fibo’s/derived fibo’s.
I particularly note the area (price and time) where fibo’s cross the upper trend line. The 8/22-23 date at the SPX 2805 (a 1.618 fibo) really stands out to me, as a likely target and likely pivot high.
Everything looking strong at the weekly tf. Price ascending cleanly in a long running channel. Trend now in week 2 of “strongly up”. A fantastic bounce this week off multiple overlapped levels: a major derived fibo (78% of entire Jan-Feb decline) and the 21 period ema (bright blue line) which was also a roundie level (2800) and a major pivot high back in March! Bam bam bam bam, that’s significant in my book.
I think up around 2954 at the 1.618 extension, around late Sept where the upper trend line is going to intersect it, is a rational target here. Though along the way, price is going to continue to slop around inside this channel.
Giddyup!!!!
The more market data justifying the “second alternate hourly” the happier I am today!
I’ll say it one more time: I see substantial evidence that RUT is going to go off like a rocket soon. YMMV and trade your plan; not advice. I’m long it myself.
In the interests of reducing my personal carbon emissions, and the interests of health, but more importantly in the interest of just having FUN…I got myself an electric bike (hey man, I ain’t Mr. Athlete and it’s hilly in SF!!). Pick it up this afternoon…oh boy!! My intention is to change my short afternoon drive to the pool hall to a bit longer afternoon ride, with no emissions. “Think global, act local” they say. I’m also getting a solar install on the roof of my house, the wheels are turning on that. Gotta do what we can to keep things cool.
last year put up solar and got a tesla…… love it
a friend got the 3 a week ago…. also very cool
hope Musk gets himself together
Musk has made enemies on the wall street that we are all aware off, as if that was not enough now going around and suing governments for cancelling the rebates …latest is Ontario, Canada. It hurts tesla the most given the pricing on the Tesla Cars… In the interest of Tesla shareholders, he should be removed from the control that he has and should focus on visionary aspects only…
sweet! I’m working the angles to get a massive rebate ($10k!) from the city for being “low income” (I live cheap), then there’s the fact I need to re-roof the tar and gravel side before putting down the solar and that gets included in the overall cost of the solar install which is deducted off federal taxes at 30% I believe. The end result? I get complete payback from my investment in 2 years!!! (Nominal is 7 years I believe.) Lol!!! And of course every $$ spent goes right into the value of the house. It’s a winning investment for me in every way.
Rebate is huge
Sure looks live a wave v launching after a complete i-ii-iii-iv on the SPX hourly after the Wednesday morning low. Look most consistent with the bullish second alternate hourly to me. It’s friday I got bulls eyes. It’ll probably turn around and morph into move minute iv muck. I will say it: I’m TIRED of this iv!!!
Lara,
Even though Olga’s subscription expired yesterday, I am hoping you will be able to send our best wishes (as listed below) to her. Thank you.
Now, it is time to turn my attention to getting another long position in my short term account. Long term account still remains fully long and enjoying the green!
OT – Wonderful news in my neck of the woods. We have received rain! The last rain was at the end of April 2018. Four months of sun and high temps can dry out the land. The rain clears the air of all the smoke from wildfires in Canada and California.
Rodney,
I know how dry and desolate your part of the country can be. Two years ago, in July, my wife and I came through Pasco/Kennewick on a road trip with our small pop-up camper trailer. We spent one miserably hot night at the KOA campground in Paso.
But despite the heat, we really enjoyed the beautiful landscape in that area near you. So wonderfully different from what we’re used to here in Minnesota.
We followed the Columbia River down to Vancouver, WA and then crossed over into Oregon, ending up in cool, comfortable Lincoln, OR on the Pacific coast for several days. We were there for a family wedding held in the wine country southwest of Portland.
Fantastic trip!
First!! he he
Just wanted to say a huge thanks to everybody here – my subscription ends today but I still subscribe to Laras Weekly. I have found more and more that I don’t have time to day trade so Lara’s longer time horizon suits me alot more to keep my own counts on track – but I may be back!!
A few us of us here have been around for a long time and have been through some very emotional times together over the years – you know who you are and I wish you all the best 🙂
Well, well, Olga. So good to hear from you. Perhaps I’ll hear from you at Lara’s weekly. I read that as well. We all certainly wish you the best. I learned a lot from you. Thanks.
Good news for me these last two days. In 2019, I get to undergo total shoulder replacement on both shoulders. One in Janusry. The other in August. Too much football and fun in the mountains I guess. But I look forward to many more years in the mountains with new shoulders in a year or so.
Good luck and God bless you.
That’s amazing news Rodney! I wish you all the best for your operations next year.
You’ll be like a modern day Bionic Man
That sounds rather serious Rodney, best of luck with that and I hope it restores your good shoulder health! That makes my little issues with tendonitus seem quite small compared with that.
Hi Olga. I wish you’d post more often 🙂 Take good care!
Thanks for the comment Olga, and so happy to see you’re still here in Lara’s Weekly.
It’s possible that we may see you back here in the daily when the bear market arrives. That will be highly emotional I expect.
Olga I have missed you more than you know! All the best!
Always enjoyed your comments – Godspeed Olga ! Hope to see you back in the future .