
An inside day leaves all short term Elliott wave counts valid, and the larger picture remains the same. On Balance Volume today suggests a new short term Elliott wave count may have a higher probability.
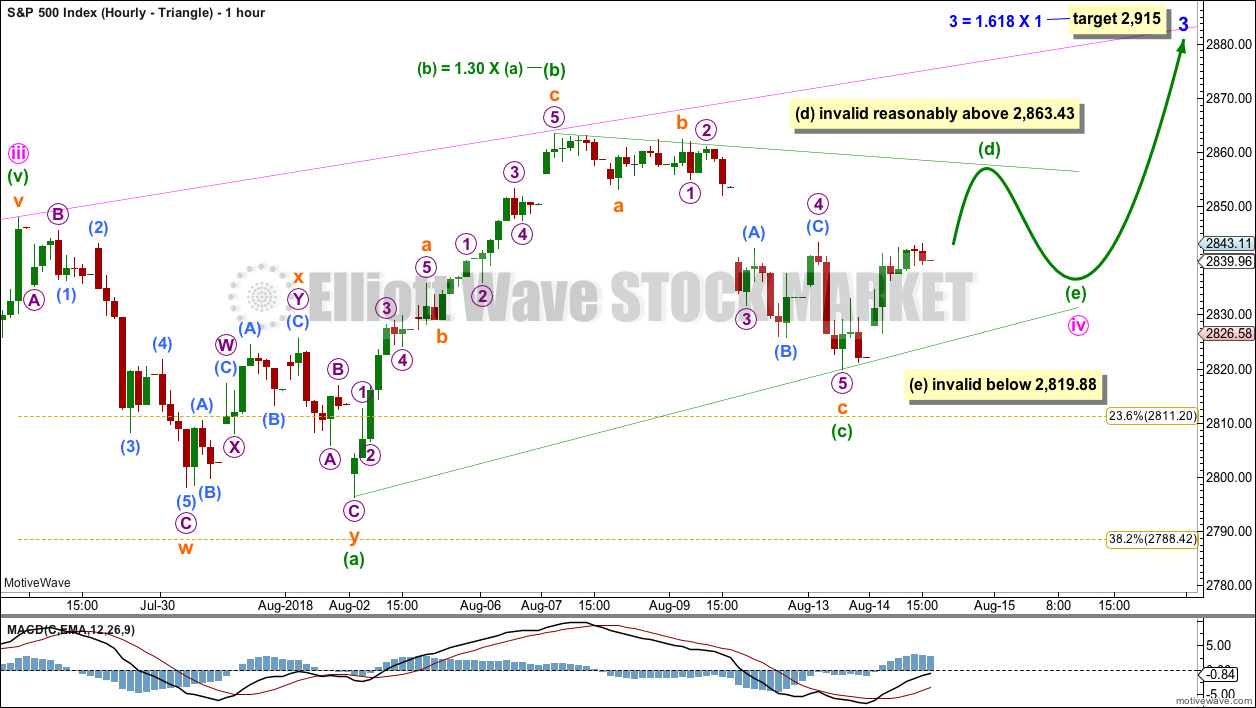
Summary: It now looks like price may continue sideways for another one to few days to complete a small triangle. A new low below 2,819.88 would indicate a pullback to end between 2,796.13 and 2,791.47.
If the pullback makes a new low below 2,791.47, then look for support about the lower edge of the pink channel on the daily chart.
The bigger picture remains extremely bullish.
The mid to longer term target is at 2,922 (Elliott wave) or 3,045 (classic analysis). Another multi week to multi month correction is expected at one of these targets.
The final target for this bull market to end remains at 3,616.
Always practice good risk management. Always trade with stops and invest only 1-5% of equity on any one trade.
New updates to this analysis are in bold.
The biggest picture, Grand Super Cycle analysis, is here.
Last historic analysis with monthly charts is here, video is here.
ELLIOTT WAVE COUNT
WEEKLY CHART
Click chart to enlarge.
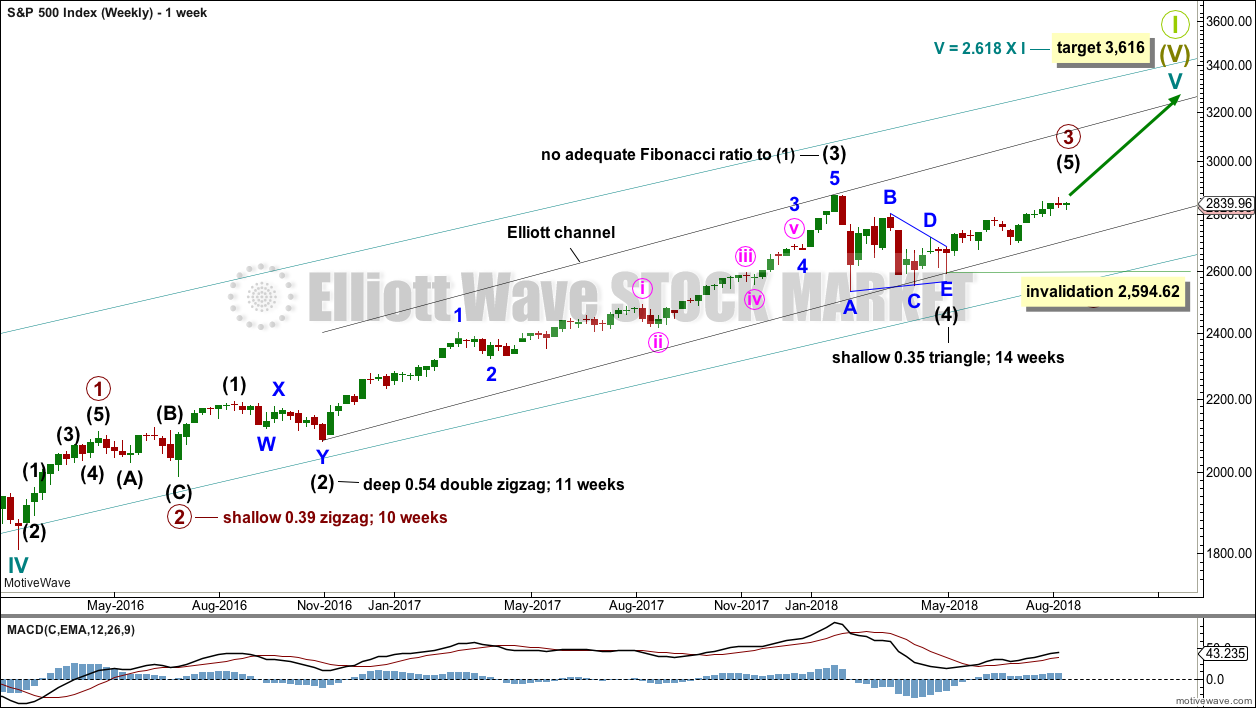
Cycle wave V must complete as a five structure, which should look clear at the weekly chart level and also now at the monthly chart level. It may only be an impulse or ending diagonal. At this stage, it is clear it is an impulse.
Within cycle wave V, the third waves at all degrees may only subdivide as impulses.
Intermediate wave (4) has breached an Elliott channel drawn using Elliott’s first technique. The channel is redrawn using Elliott’s second technique: the first trend line from the ends of intermediate waves (2) to (4), then a parallel copy on the end of intermediate wave (3). Intermediate wave (5) may end either midway within the channel, or about the upper edge.
Intermediate wave (4) may now be a complete regular contracting triangle lasting fourteen weeks, one longer than a Fibonacci thirteen. There is perfect alternation and excellent proportion between intermediate waves (2) and (4).
Within intermediate wave (5), no second wave correction may move beyond the start of its first wave below 2,594.62. However, the lower edge of the black Elliott channel drawn across the ends of intermediate degree waves should provide very strong support for any deeper pullbacks, holding price well above the invalidation point while intermediate wave (5) unfolds.
At this stage, the expectation is for the final target to me met in October 2019.
A multi week to multi month consolidation for primary wave 4 is expected on the way up to the final target.
The last bullish fifth wave of minor wave 5 to end intermediate wave (3) exhibited commodity like behaviour. It was strong and sustained. It is possible that the upcoming wave of minor wave 5 to end intermediate wave (5) to end primary wave 3 may exhibit similar behaviour, so we should be on the lookout for this possibility.
DAILY CHART
Click chart to enlarge.
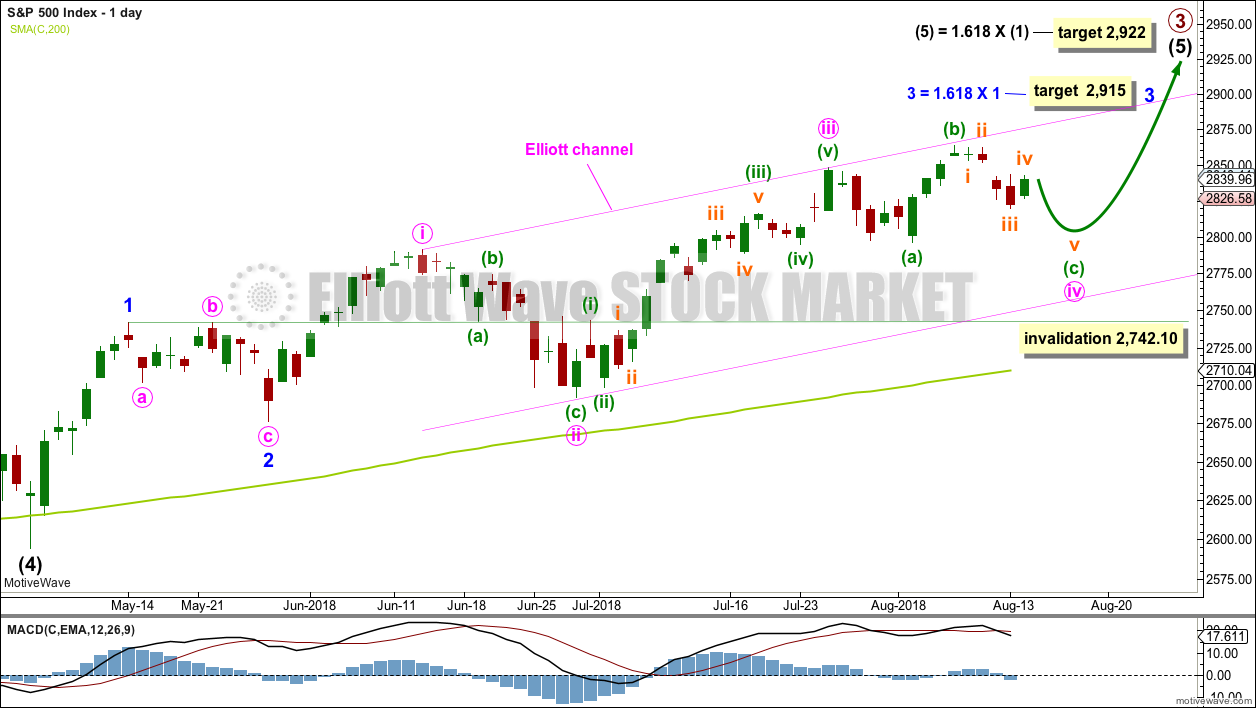
Intermediate wave (5) would be very likely to make at least a slight new high above the end of intermediate wave (3) at 2,872.87 to avoid a truncation.
Intermediate wave (3) exhibits no Fibonacci ratio to intermediate wave (1). It is more likely then that intermediate wave (5) may exhibit a Fibonacci ratio to either of intermediate waves (1) or (3). The most common Fibonacci ratio would be equality in length with intermediate wave (1), but in this instance that would expect a truncation. The next common Fibonacci ratio is used to calculate a target for intermediate wave (5) to end.
Intermediate wave (5) is unfolding as an impulse, and within it minor waves 1 and 2 are complete.
Minor wave 3 may only subdivide as an impulse. A target is calculated for minor wave 3 to end, which expects to see the most common Fibonacci ratio to minor wave 1. Minor wave 3 may last several weeks in total and should look like an impulse at the daily chart level. When it is complete, then minor wave 4 may last about one to two weeks in order for it to exhibit reasonable proportion to minor wave 2. Minor wave 4 may not move into minor wave 1 price territory below 2,742.10.
Within minor wave 3, minute waves i, ii and iii all look complete and minute wave iv may still be incomplete. If minute wave iv were to continue further, then it would have better proportion to minute wave ii and would exhibit alternation in structure. This idea also has support from classic technical analysis.
It is also possible that minute wave iv was over at the last low and minor wave 3 was over at the last high. A new low below 2,791.47 could not be a continuation of minute wave iv, so the correction at that stage would be labelled minor wave 4.
The channel is drawn using Elliott’s first technique. The upper edge has provided resistance. This channel is copied over to hourly charts.
If the main hourly wave count below is invalidated with a new low below 2,791.47 and price keeps on falling, then look for strong support about the lower edge of the Elliott channel on this daily chart; the pullback may end there.
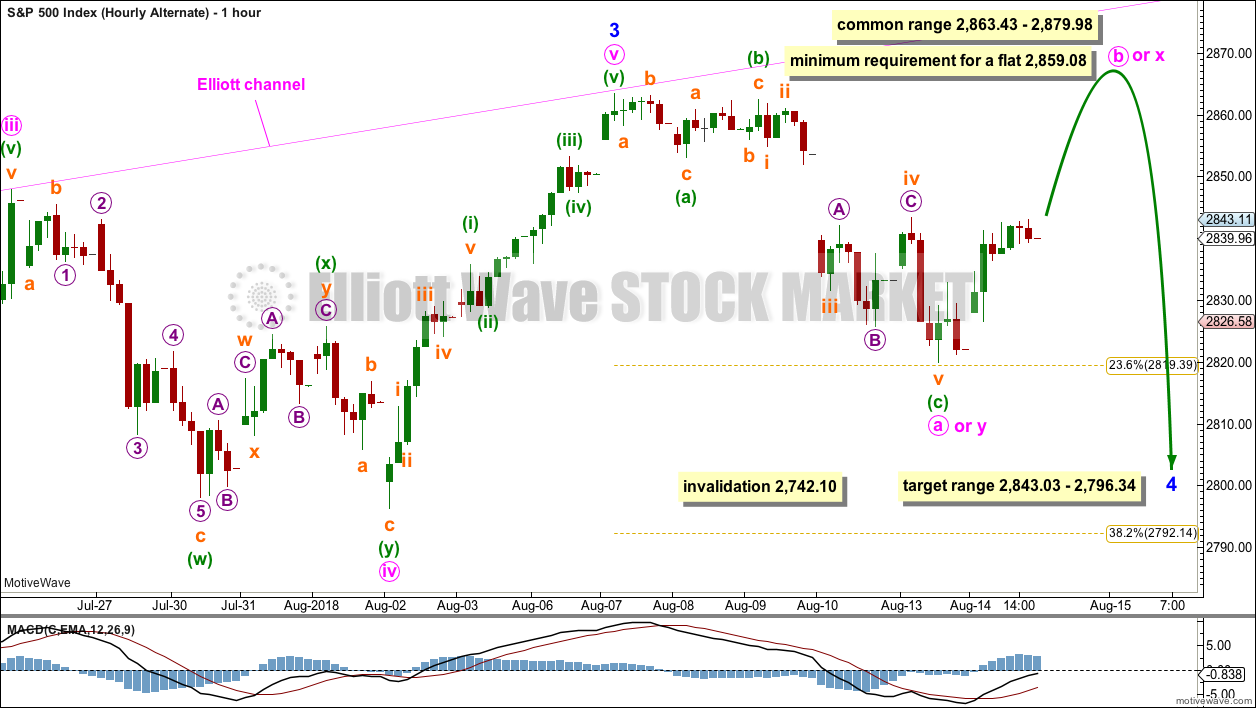
MAIN HOURLY CHART – TRIANGLE
Click chart to enlarge.
This wave count is new today and has the best support from classic technical analysis.
Minute wave iv may continue sideways for another two or so days to complete a running contracting or barrier triangle.
Only one sub-wave within a triangle may subdivide as a multiple and all remaining triangle sub-waves must be single corrective structures. In this example, minuette wave (a) fits best as a double zigzag.
Within a contracting triangle, minuette wave (d) may not move beyond the end of minuette wave (b) above 2,863.43. Contracting triangles are the most common type.
Within a barrier triangle, minuette wave (d) may end about the same level as minuette wave (b) in order for the (b)-(d) trend line to remain essentially flat. Minuette wave (d) may end slightly above minuette wave (b) and the triangle would remain valid; the upper invalidation point is not black and white. Barrier triangles are not the most common type, but they are still reasonably common.
For both a barrier and contracting triangle, minuette wave (e) may not move beyond the end of minuette wave (c) below 2,819.88. It would most likely fall short of the (a)-(c) trend line.
When Elliott wave triangles complete, the resulting movement out of them usually begins with strength.
MAIN HOURLY CHART – FLAT
Click chart to enlarge.
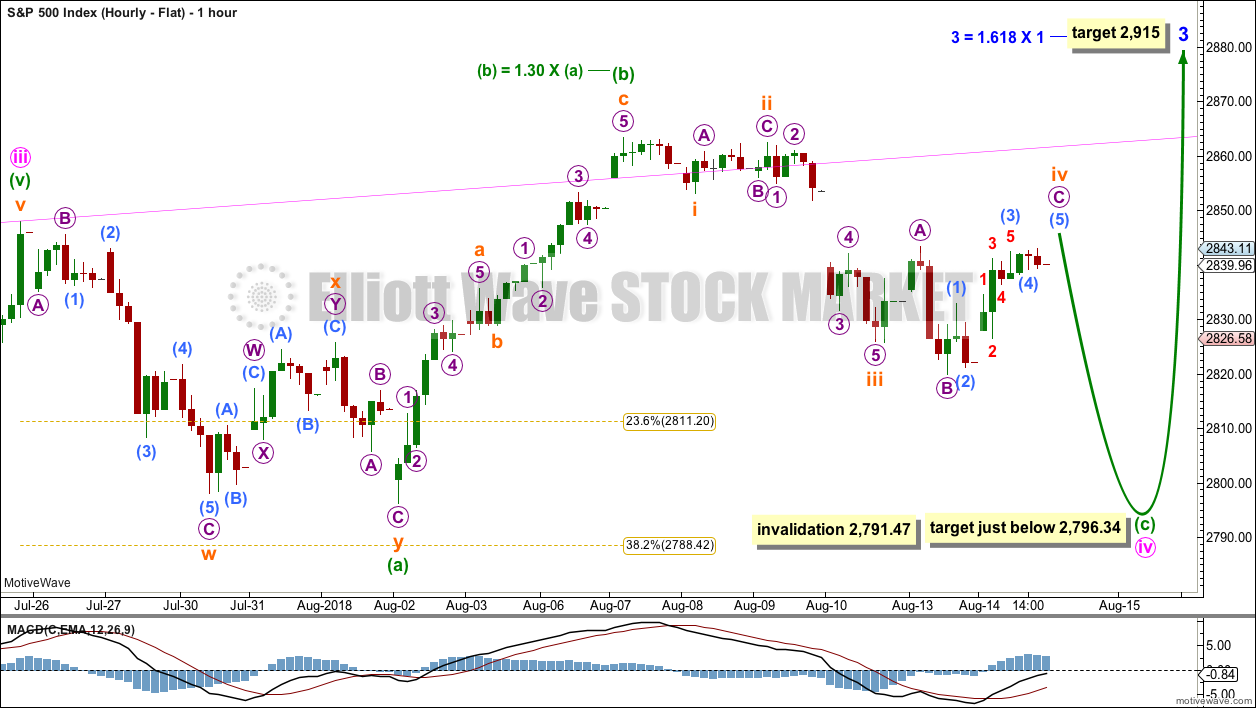
It remains possible that minute wave iv is an incomplete expanded flat correction.
Within the expanded flat, minuette waves (a) and (b) both subdivide as threes. Minuette wave (b) is still within the most common range for B waves within flat corrections, between 1 and 1.38 times the length of wave A.
Minuette wave (c) may be a steep sharp pullback. It would be very likely to make a new low at least slightly below the end of minuette wave (a) at 2,796.34 to avoid a truncation and a very rare running flat.
It is also possible to see minuette wave (a) over earlier as a single zigzag at the low labelled subminuette wave w. If this idea is correct, then minuette wave (c) only needs to make a slight new low below 2,798.11 to avoid a truncation.
Minuette wave (c) must subdivide as a five wave impulse.
The downwards wave labelled subminuette wave i may be seen as a complete five wave impulse on the five minute chart.
Within the impulse of minuette wave (c), subminuette waves i through to iii may be complete and subminuette wave iv may be completing as an expanded flat correction. Within subminuette wave iv, micro wave C would be extremely likely to make at least a slight new high above the end of micro wave A at 2,843.40 to avoid a truncation and a very rare running flat. Subminuette wave iv may not move into subminuette wave i price territory above 2,859.44.
When subminuette wave iv may be complete, then a downwards wave for subminuette wave v would be required to complete an impulse for minuette wave (c).
Minute wave iv may not move into minute wave i price territory below 2,791.47.
For this main hourly wave count, the upwards wave labelled minuette wave (b) is seen as a zigzag; this labelling has the best fit.
For the two hourly alternates below, the structure (labelled minuette wave (b) on this main hourly chart) is labelled as an impulse; this labelling does not have as good a fit.
ALTERNATE HOURLY CHART
Click chart to enlarge.
Here, the degree of labelling within minute wave iv is moved up one degree.
It is possible that minute wave iv could be over more quickly than was expected. If minute wave iv is over, then the possibility of an earlier than expected end to minute wave v must be considered.
Minor wave 3 may have been over at the last high. Minute wave v is seen as a five wave impulse in order for this wave count to work. This does not have as good a fit as the main wave count, which does see this wave as a zigzag.
Within minor wave 4, only minute wave a of a flat or triangle or minute wave w of a combination may be now complete.
If minor wave 4 unfolds as a flat correction, then within it minute wave b must retrace a minimum 0.9 length of minute wave a. The common range for minute wave b within a flat correction is from 1 to 1.38 times the length of minute wave a.
If minor wave 4 unfolds as a combination, then the first structure in a double combination may now be a complete zigzag, which would be labelled minute wave y. Minute wave x has no minimum nor maximum required length to minute wave y, and it may make a new price extreme beyond the start of minute wave y at 2,863.43.
If minor wave 4 unfolds as a triangle, there is no minimum nor maximum length for minute wave b, which may make a new high above the start of minute wave a at 2,863.43.
Minute wave b or x should exhibit weakness for all three ideas of a flat, combination or triangle.
Minor wave 4 may be reasonably expected to last at least about two weeks, and possibly up to about four weeks. It would most likely end somewhere within the fourth wave of one lesser degree; minute wave iv has its range from 2,843.03 to 2,796.34. If it does not end here, then it may end about the 0.382 Fibonacci ratio of minor wave 3 at 2,792.
SECOND ALTERNATE HOURLY CHART
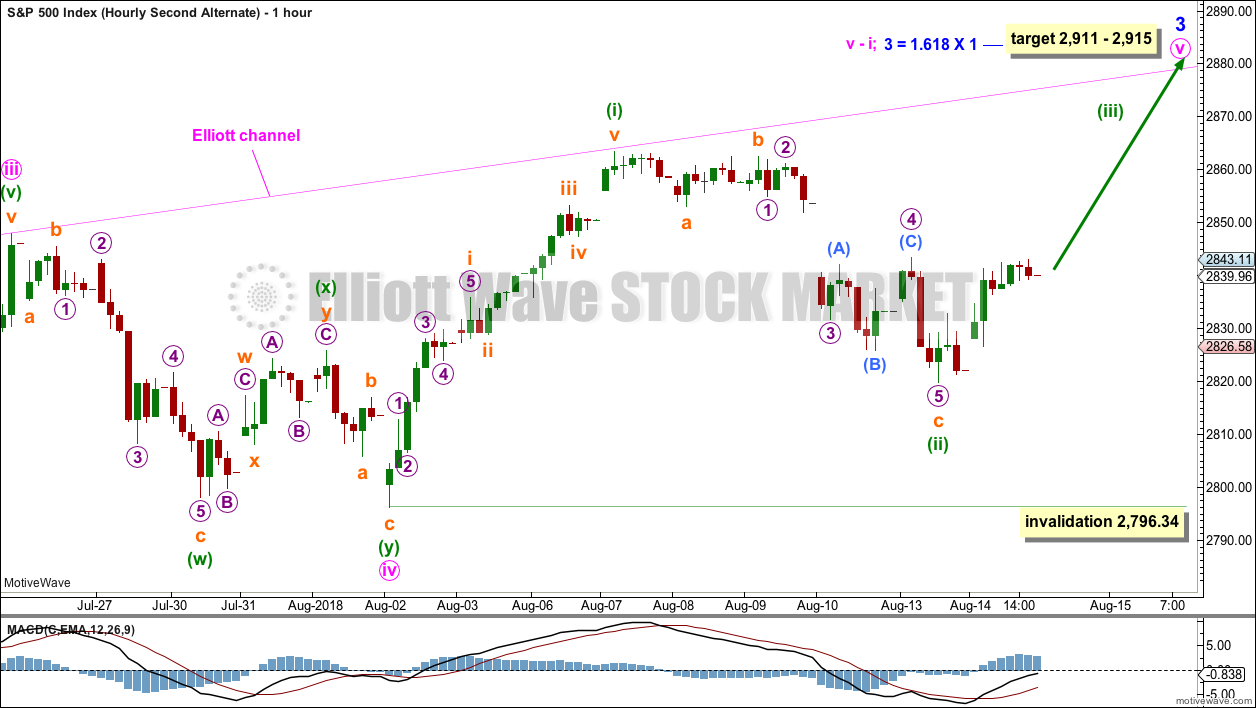
Click chart to enlarge.
This second alternate wave count moves the degree of labelling within the last upwards wave down one degree. Minute wave v may be incomplete, and only minuette wave (i) within it may be complete.
Minuette wave (ii) is labelled as complete single zigzag.
This wave count expects an increase in upwards momentum as minuette wave (iii) moves higher.
If minuette wave (ii) continues any further, it may not move beyond the start of minuette wave (i) below 2,796.34.
TECHNICAL ANALYSIS
WEEKLY CHART
Click chart to enlarge. Chart courtesy of StockCharts.com.
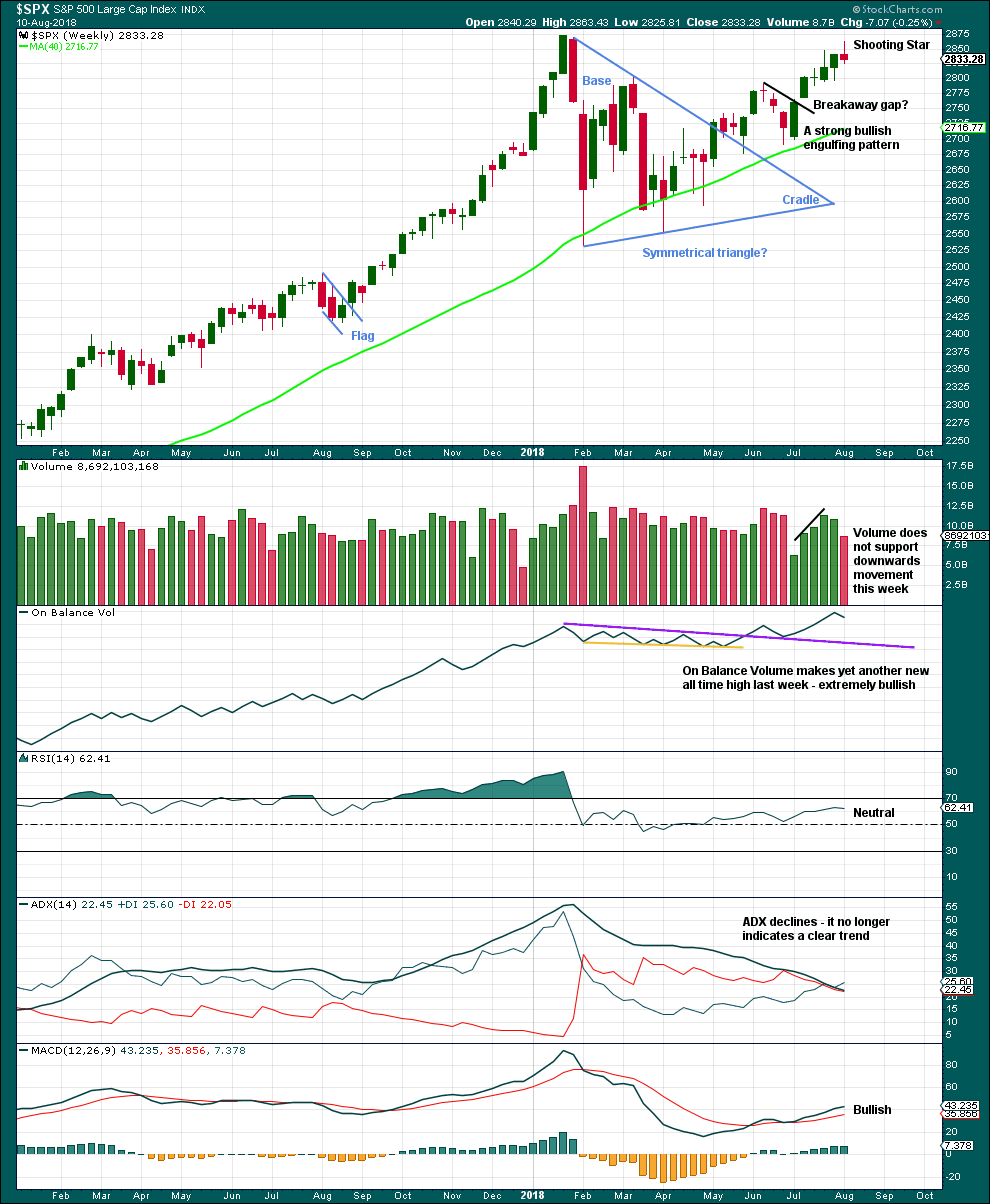
Another new high for On Balance Volume last week remains very bullish indeed, but that does not preclude another small pullback within this developing upwards trend. It is still expected that price is very likely to make new all time highs, but it will not move in a straight line.
Last week’s candlestick is a Shooting Star pattern. This is a bearish reversal pattern when it comes after an upwards trend. Look for a downwards week this week.
DAILY CHART
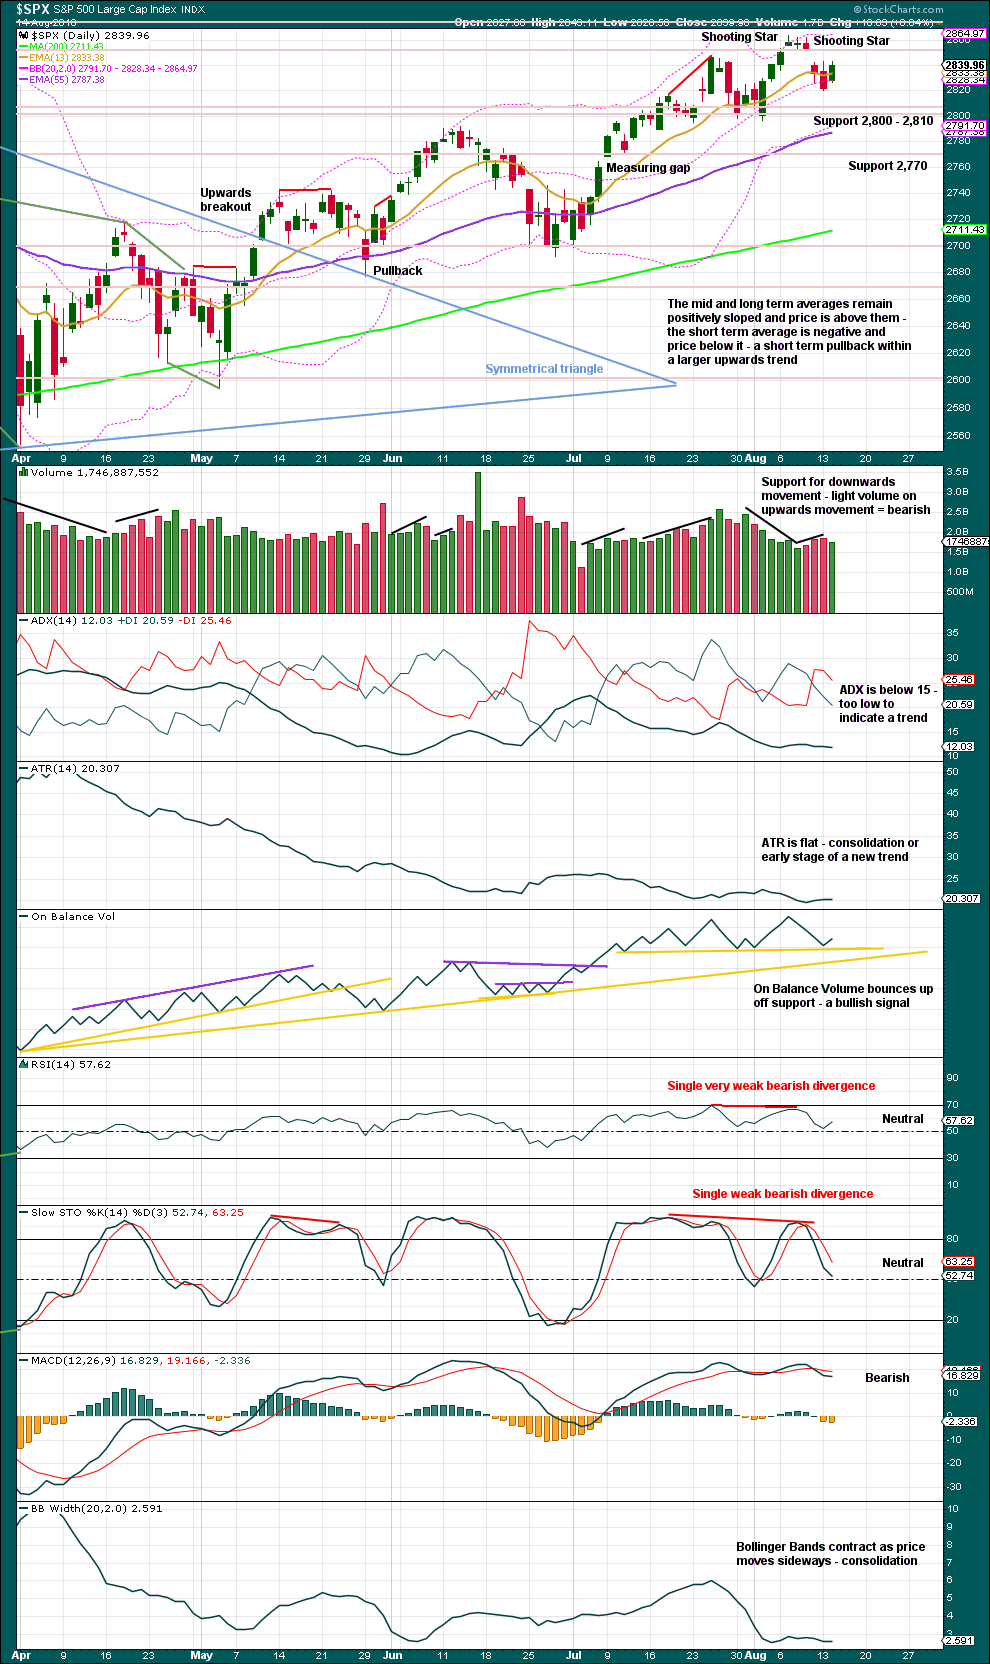
Click chart to enlarge. Chart courtesy of StockCharts.com.
The symmetrical triangle may now be complete. The base distance is 340.18. Added to the breakout point of 2,704.54 this gives a target at 3,044.72. This is above the Elliott wave target at 2,922, so the Elliott wave target may be inadequate.
Since the low on the 2nd of April, 2018, price has made a series of higher highs and higher lows. This is the definition of an upwards trend. But trends do not move in perfectly straight lines; there are pullbacks and bounces along the way.
There are now two Shooting Star candlesticks at or about the last high. This is now a stronger bearish warning. There are three recent examples of Shooting Stars on this chart: on 31st of July, 26th of July, and 11th of June. The second two examples came after an upwards trend and were considered bearish reversal candlesticks. Both were closely accompanied by new all time highs from On Balance Volume and some bearish divergence with price and Stochastics. Both were quickly followed by reasonable pullbacks. This is almost exactly the same situation now, and it now looks like it is happening again here. Price has found support about 2,800. On Balance Volume today has also found support. The pullback may not be deep if On Balance Volume continues to find support here.
The bigger picture remains extremely bullish with another new all time high from On Balance Volume as recently as the 7th of August.
If On Balance Volume breaks below first support, there is a new support line which may allow for another one or two days of downwards movement. Both support lines have reasonable technical significance.
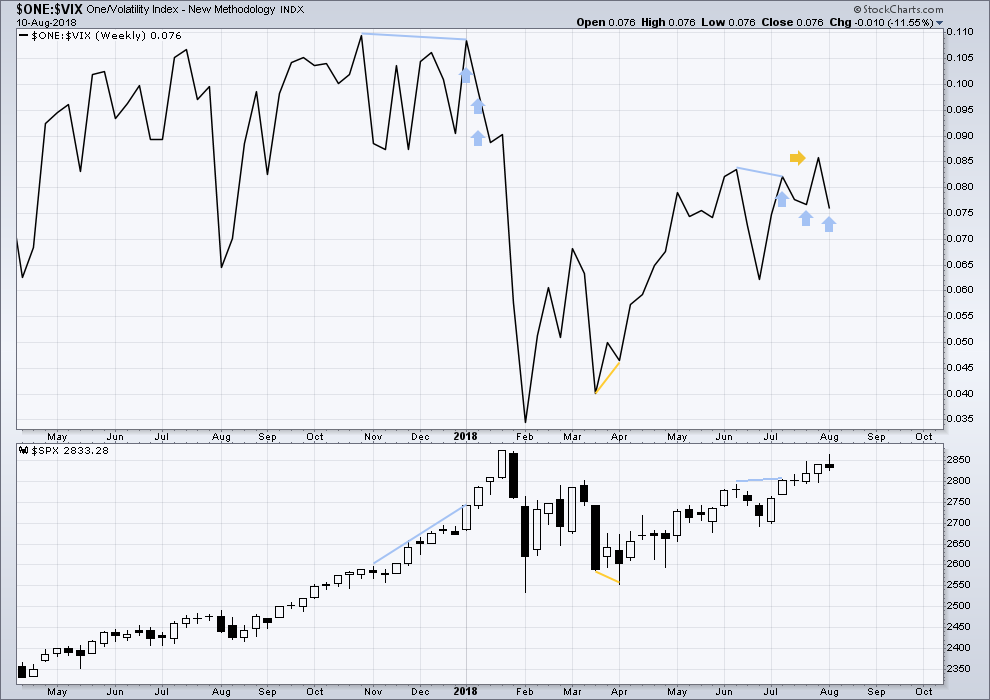
VOLATILITY – INVERTED VIX CHART
WEEKLY CHART
Click chart to enlarge. Chart courtesy of StockCharts.com. So that colour blind members are included, bearish signals
will be noted with blue and bullish signals with yellow.
To keep an eye on the all time high for inverted VIX a weekly chart is required at this time.
Notice how inverted VIX has very strong bearish signals four weeks in a row just before the start of the last large fall in price. At the weekly chart level, this indicator may be useful again in warning of the end of primary wave 3.
Last week completes an upwards week with a higher high and a higher low.
While price moved higher, inverted VIX moved lower. Downwards movement during last week does not have support from increasing market volatility. This divergence is bearish.
Inverted VIX is still some way off from making a new all time high.
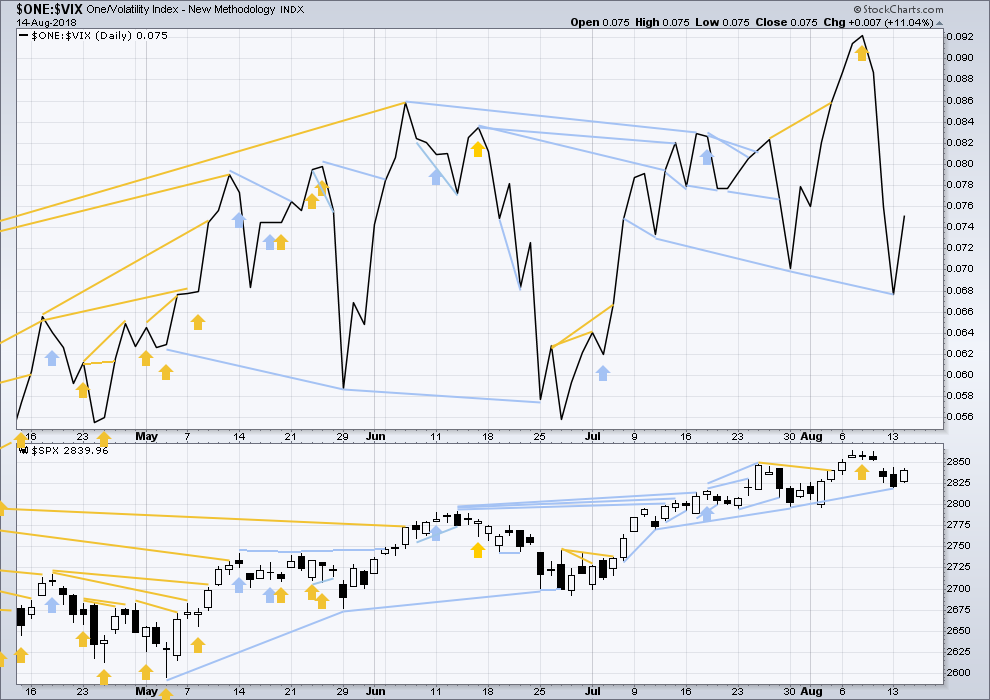
DAILY CHART
Click chart to enlarge. Chart courtesy of StockCharts.com. So that colour blind members are included, bearish signals
will be noted with blue and bullish signals with yellow.
Normally, volatility should decline as price moves higher and increase as price moves lower. This means that normally inverted VIX should move in the same direction as price.
Last noted mid term bearish divergence has not been followed yet by more downwards movement. It may still indicate downwards movement ahead as there is now a cluster of bearish signals from inverted VIX.
Inverted VIX has made a new swing low below the prior low of the 11th of July, but price has not. This is mid term divergence that is bearish. So far this has not been followed by downwards movement, but it may still be so though in the next day or so.
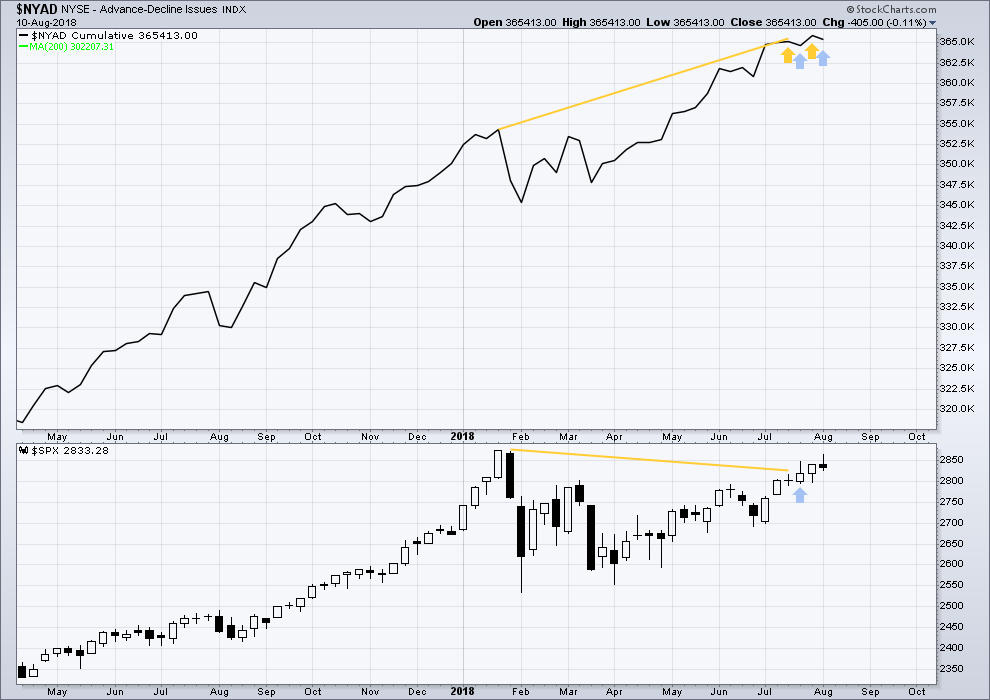
BREADTH – AD LINE
WEEKLY CHART
Click chart to enlarge. Chart courtesy of StockCharts.com.
When primary wave 3 comes to an end, it may be valuable to watch the AD line at the weekly time frame as well as the daily.
At this stage, there is very strong bullish divergence between price and the AD line at the weekly time frame. With the AD line making new all time highs, expect price to follow through with new all time highs in coming weeks.
Price last week has moved higher, but the AD line has moved lower.
Upwards movement within this last week does not have support from rising market breadth. This divergence is bearish for the short term.
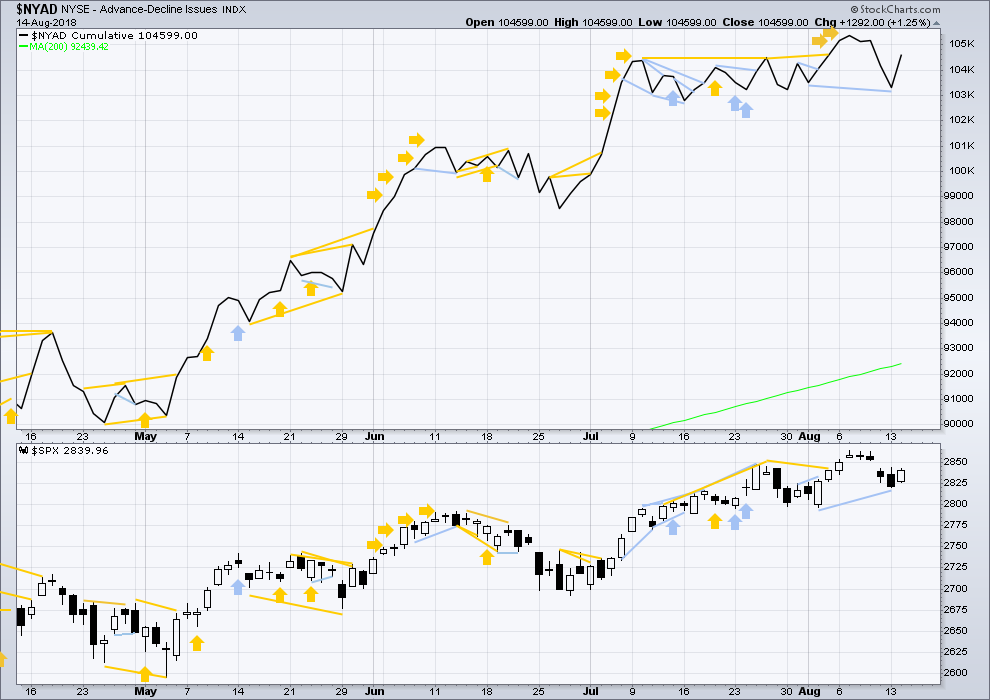
DAILY CHART
Click chart to enlarge. Chart courtesy of StockCharts.com.
There is normally 4-6 months divergence between price and market breadth prior to a full fledged bear market. This has been so for all major bear markets within the last 90 odd years. With no longer term divergence yet at this point, any decline in price should be expected to be a pullback within an ongoing bull market and not necessarily the start of a bear market. New all time highs from the AD line means that any bear market may now be an absolute minimum of 4 months away. It may of course be a lot longer than that. My next expectation for the end of this bull market may now be October 2019.
Breadth should be read as a leading indicator.
The AD line today has made a new short term swing low below the prior low of the 1st / 2nd of August, but price has not. This divergence is bearish for the short term. So far this has not been followed by any downwards movement, but it may yet be so.
Small caps made another new all time high today. Mid caps have made new all time highs on the 7th of August. Only large caps have to follow through; they do usually lag in the latter stages of a bull market.
DOW THEORY
The following lows need to be exceeded for Dow Theory to confirm the end of the bull market and a change to a bear market:
DJIA: 23,360.29.
DJT: 9,806.79.
S&P500: 2,532.69.
Nasdaq: 6,630.67.
Only Nasdaq at this stage is making new all time highs, with another new all time high on the 25th of July. DJIA and DJT need to make new all time highs for the ongoing bull market to be confirmed.
Charts showing each prior major swing low used for Dow Theory may be seen at the end of this analysis here.
Published @ 11:05 p.m. EST.
Sorry for not being here earlier everybody. I needed sleep. Much refreshed now and ready to do your analysis.
Today’s low is just above 2,796.24. So the idea of a flat would now have to see a very rare running flat complete. This is not the market conditions in which running flats turn up, the upwards trend here (weekly) is clear, but it’s not very strong. So I’m not going to publish a wave count with a running flat here, it would have too low a probability. Minuscule, infinitesimal.
What does now look pretty good is a triangle.
Now, the only question is what degree to label it? If it remains above 2,791.47 (which it must if it’s a triangle) and when complete has good proportion to minute ii, then I’m going to label it minute iv and discard the idea of a minor 4.
But if this triangle morphs into a combination (which will be my alternate) and makes a new low below 2,791.47 then I’ll label it minor 4.
I hope that all makes sense. Anyway, here’s a chart for you, this will be today’s main hourly wave count. Apologies for my tardiness and thank you for your patience.
This bounce looks corrective to me at the moment. At least one more low just ahead?
Down sure , which count ?
Not sure, Peter. I wouldn’t be surprised to see a revised wave count later today. Not just updated, but seriously reworked.
Seems like the main called for a small v wave down to just about this area and that’s exactly what we’ve got. What am I missing?
Daily, yes. I rather expect a new hourly count from Lara. We will know soon enough…
Lara’s main, which the action is following well, called for a v wave down here, and that’s what we’ve got. Right to just about her target area for a bottom. I’m not so sure this isn’t over, per her WC and the action. Perfect hit and turn off the pivot high from 3/13, and multiple fibo support in the same area around 2800.
I think the iv is over. But I’ve thought that before, lol!!!
I can make out a well defined i, ii, iii, iv, v on the 5 minute of the initial move down this morning to 2802.49. Though it could just be the i of the v, in which I guess it’s look out below! That would generate all kinds of invalidation though, so perhaps not so likely. There are larger volume nodes lower though that price will be attracted to, and the AD is running at what, 1-11? “Everything” is down.
WTF is up with Gold & Silver?
As always: too many folks wanting gold to hit 2000, and silver over 50… ain’t happening. I was one of them a few years ago.
USD too strong. The whole sector is toast for a long time. The key was the close of GDX below 20.80. That was the signal to get out and not look back for a while.
There should be a reversion to the mean trade coming up… “when” is anyone’s guess
I think the US dollar is in high demand throughout the world compared to other currencies.
They are going down.
Has AG hit your stop yet? Boy, even that 78% didn’t hold it. 4.93 is the next target down…then 2.67. Why didn’t I short…
No Stops unfortunately.
What I find very interesting is that almost ALL the open interest on AG Options, Calls and Puts, has vanished for August and September! It had a lot the last time I looked.
Had I gotten out of AG… right now and here is where I would be loading up!
NDX. I put down the gray ellipse as the likely “hit and turn” point several days ago. If this is the bottom, pretty close. Or perhaps it still gets down in there before turning.
Fantastic day for me…but I’m good with this being over soon, too. Along with a lot of profit taking, I’ve got a lot of red that needs the high TF bull market to reassert itself reasonably soon.
Just be careful as what is happening in China is going to have a huge impact given the critical level their currency is reaching against USD. If the 7 renminbi to 1 USD is broken to the up side, the stock market and momentum stocks like AMZN etc will suffer and hence NDX.
I appreciate the warning RR, thanks.
What if the 2800 level breach is kept on hold till EOD to keep majority investors stuck in the market at these levels? Tomorrow slam another future driven sell off that gives no option to anyone to get out. In my view majority are still stuck with (2800, including TA folks and we are not the only ones watching it)
Is the triangle main count still valid?
yes, I’m adjusting it.
minuette (c) of a triangle could be complete today.
that’s now going to be my main wave count
Looking like the opportunity to go long is right around the corner. Perhaps later today or tomorrow. And I just happen to be out of town again away from trading desk. Darn.
Use a contingency order my friend! 🙂
Up, up and away!
We had a spectacular morning!
I am taking a well-deserved break. These banksters can really wear you out.
Travel safely Rod! See ya back in the trenches bud.
Lots of support of various flavors at 2800 area, but the lower channel line is well below that.
Guten Morgen!
Mr. Market has made it clear to us that the 2800 pivot is of extreme importance. Every attempt by the bears to take it out on a close has been rejected so the odds are high we will see a reversal in that area, even if we get an intra-day penetration.
It was clear to every trader yesterday that the move up was short- term counter-trend and an opportunity to add to short positions. The move down in volatility was an absolute gift. Kudos if you paid attention to the signals and took advantage! Futures are down mildly, so we should see a slow drift toward the 2800 pivot over the next day or two and I plan on scaling out of short trades and gradually exiting short legs of bear call spread as we move down.
I am starting to wonder if we are going to see a very atypical lunar cycle in which we have market highs coming on back to back full moons. That would be most interesting.
Having said all that, we are looking at an interesting possible fractal that leaves the door open for a deeper move down so I think one has to be open to that possibility.
Take a look at the posted chart. The machine trading going on is incredible!
I will be with the posse all day today managing some pretty big positions so I won’t be posting here much. I hope you all have a great and profitable trading day!