
Another candlestick pattern supports the main short term Elliott wave count.
Summary: There are now two Shooting Star candlesticks about the last high. The main hourly Elliott wave count still expects a reasonable pullback to begin here and to end below 2,796.34 but not below 2,791.47.
The bigger picture remains extremely bullish.
The mid to longer term target is at 2,922 (Elliott wave) or 3,045 (classic analysis). Another multi week to multi month correction is expected at one of these targets.
The final target for this bull market to end remains at 3,616.
Always practice good risk management. Always trade with stops and invest only 1-5% of equity on any one trade.
New updates to this analysis are in bold.
The biggest picture, Grand Super Cycle analysis, is here.
Last historic analysis with monthly charts is here, video is here.
ELLIOTT WAVE COUNT
WEEKLY CHART
Click chart to enlarge.
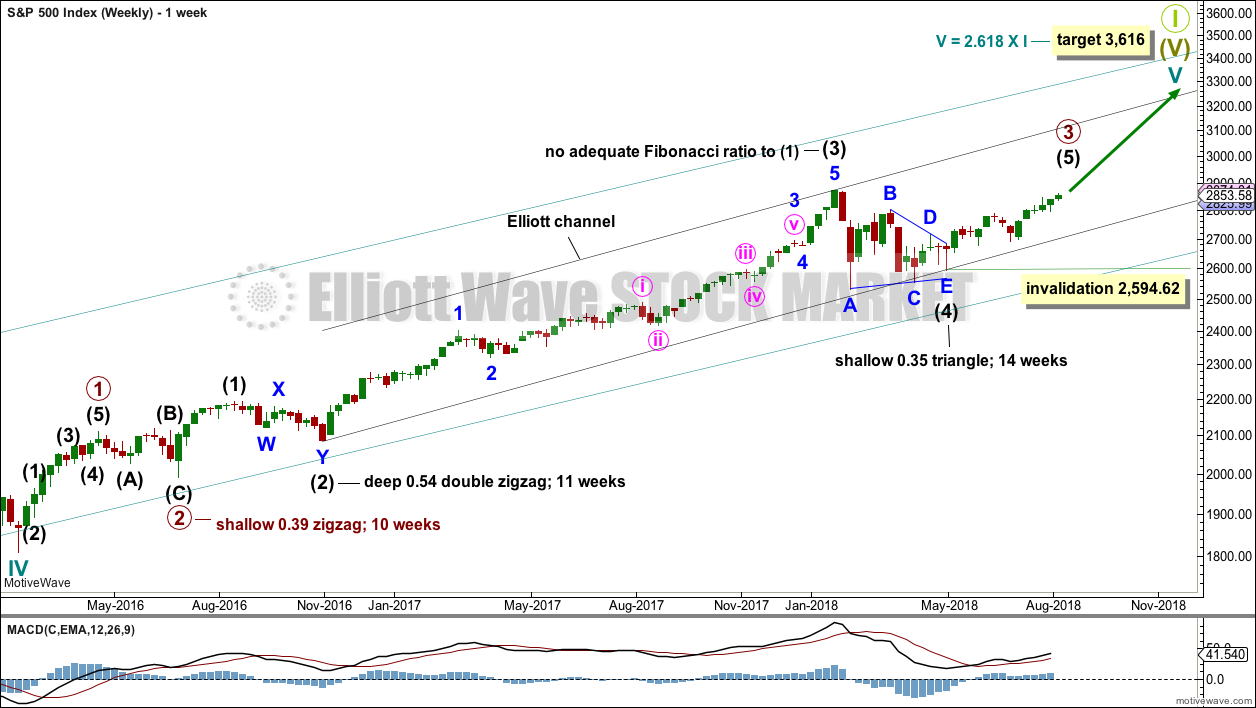
Cycle wave V must complete as a five structure, which should look clear at the weekly chart level and also now at the monthly chart level. It may only be an impulse or ending diagonal. At this stage, it is clear it is an impulse.
Within cycle wave V, the third waves at all degrees may only subdivide as impulses.
Intermediate wave (4) has breached an Elliott channel drawn using Elliott’s first technique. The channel is redrawn using Elliott’s second technique: the first trend line from the ends of intermediate waves (2) to (4), then a parallel copy on the end of intermediate wave (3). Intermediate wave (5) may end either midway within the channel, or about the upper edge.
Intermediate wave (4) may now be a complete regular contracting triangle lasting fourteen weeks, one longer than a Fibonacci thirteen. There is perfect alternation and excellent proportion between intermediate waves (2) and (4).
Within intermediate wave (5), no second wave correction may move beyond the start of its first wave below 2,594.62. However, the lower edge of the black Elliott channel drawn across the ends of intermediate degree waves should provide very strong support for any deeper pullbacks, holding price well above the invalidation point while intermediate wave (5) unfolds.
At this stage, the expectation is for the final target to me met in October 2019.
A multi week to multi month consolidation for primary wave 4 is expected on the way up to the final target.
The last bullish fifth wave of minor wave 5 to end intermediate wave (3) exhibited commodity like behaviour. It was strong and sustained. It is possible that the upcoming wave of minor wave 5 to end intermediate wave (5) to end primary wave 3 may exhibit similar behaviour, so we should be on the lookout for this possibility.
DAILY CHART
Click chart to enlarge.
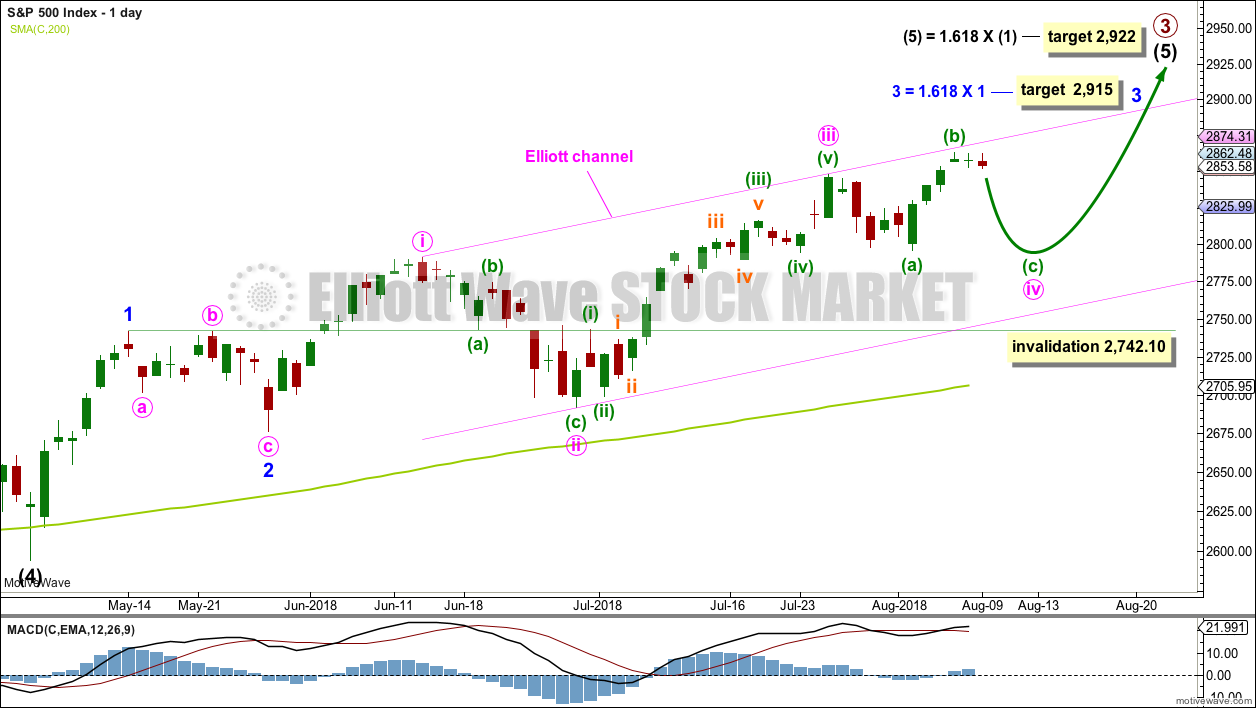
Intermediate wave (5) would be very likely to make at least a slight new high above the end of intermediate wave (3) at 2,872.87 to avoid a truncation.
Intermediate wave (3) exhibits no Fibonacci ratio to intermediate wave (1). It is more likely then that intermediate wave (5) may exhibit a Fibonacci ratio to either of intermediate waves (1) or (3). The most common Fibonacci ratio would be equality in length with intermediate wave (1), but in this instance that would expect a truncation. The next common Fibonacci ratio is used to calculate a target for intermediate wave (5) to end.
Intermediate wave (5) is unfolding as an impulse, and within it minor waves 1 and 2 are complete.
Minor wave 3 may only subdivide as an impulse. A target is calculated for minor wave 3 to end, which expects to see the most common Fibonacci ratio to minor wave 1. Minor wave 3 may last several weeks in total and should look like an impulse at the daily chart level. When it is complete, then minor wave 4 may last about one to two weeks in order for it to exhibit reasonable proportion to minor wave 2. Minor wave 4 must remain above minor wave 1 price territory above 2,742.10.
Within minor wave 3, minute waves i, ii and iii all look complete and minute wave iv may still be an incomplete expanded flat correction. This remains the main hourly wave count, and technical reasoning is outlined in the classic technical analysis section below. This main hourly wave count would also expect minute waves ii and iv to exhibit good proportion to each other, giving the wave count at the daily chart level the right look.
The channel is drawn using Elliott’s first technique. The upper edge has provided resistance. This channel is copied over to hourly charts.
MAIN HOURLY CHART
Click chart to enlarge.
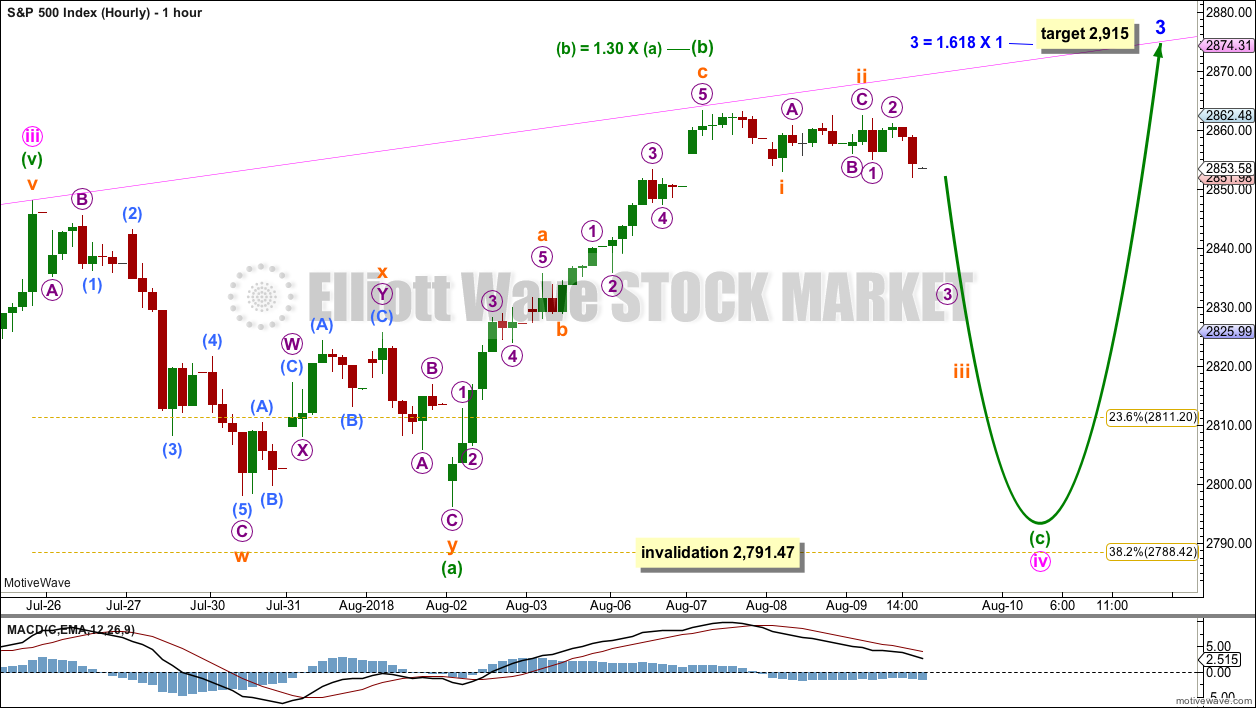
This remains the main wave count today.
It remains possible that minute wave iv is an incomplete expanded flat correction.
Within the expanded flat, minuette waves (a) and (b) both subdivide as threes. Minuette wave (b) is still within the most common range for B waves within flat corrections, between 1 and 1.38 times the length of wave A.
Minuette wave (c) may have begun here to be a steep sharp pullback. It would be very likely to make a new low at least slightly below the end of minuette wave (a) at 2,796.34 to avoid a truncation and a very rare running flat.
Minuette wave (c) must subdivide as a five wave impulse.
The downwards wave labelled subminuette wave i may be seen as a complete five wave impulse on the five minute chart.
There may now be two overlapping first and second waves complete within minuette wave (c). This wave count would now be expecting an increase in downwards momentum over the next one to few days as the middle of a small third wave down unfolds.
Minute wave iv may not move into minute wave i price territory below 2,791.47.
For this main hourly wave count, the upwards wave labelled minuette wave (b) is seen as a zigzag; this labelling has the best fit.
For the two hourly alternates below, the structure (labelled minuette wave (b) on this main hourly chart) is labelled as an impulse; this labelling does not have as good a fit.
ALTERNATE HOURLY CHART
Click chart to enlarge.
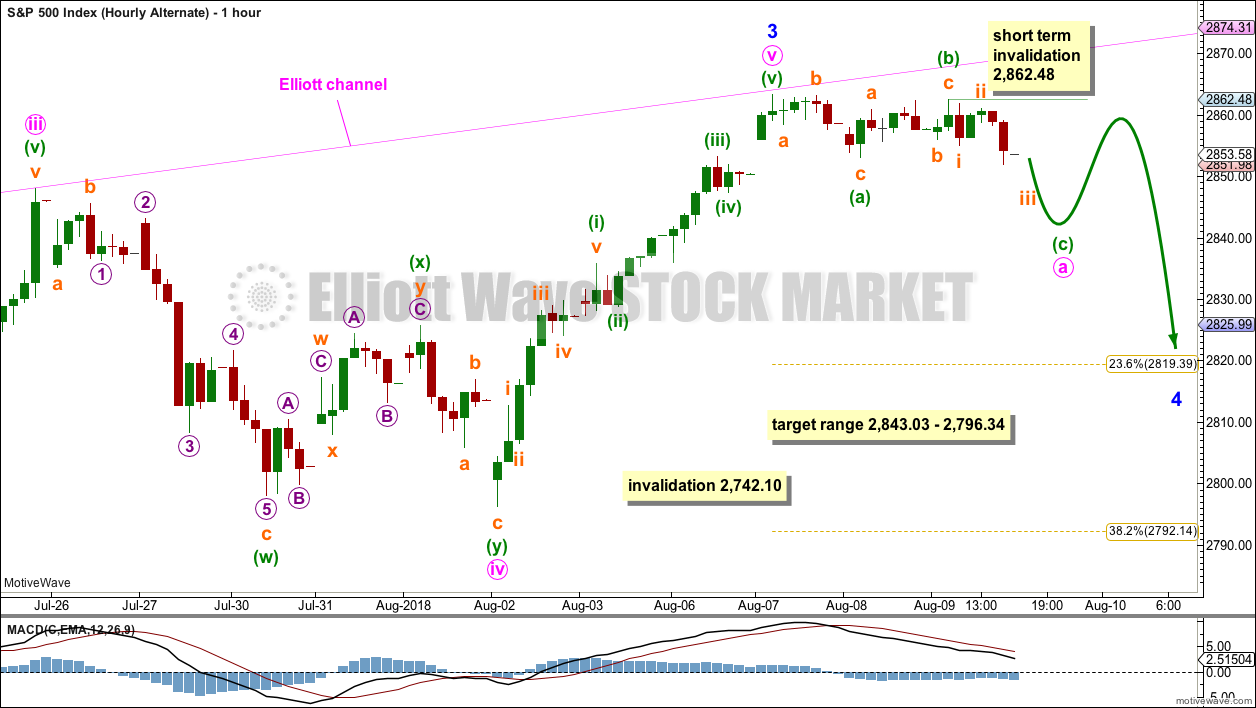
Here, the degree of labelling within minute wave iv is simply moved up one degree.
It is possible that minute wave iv could be over more quickly than was expected. If minute wave iv is over, then the possibility of an earlier than expected end to minute wave v must be considered.
Sideways movement of the last three days now looks like a separate wave to the prior upwards wave and not another correction within the upwards wave. Minor wave 3 may have been over at the last high. Minute wave v is seen as a five wave impulse in order for this wave count to work. This does not have as good a fit as the main wave count, which does see this wave as a zigzag.
Minor wave 4 would most likely be a flat, combination or triangle. These are all sideways types of corrections. It may have begun with a regular flat correction unfolding for minute wave a. Within minuette wave (c), no second wave correction may move beyond the start of its first wave above 2,862.48. Minuette wave (c) should complete as a five wave structure.
When minute wave a is complete, then minute wave b may make a new high above the start of minute wave a, as in an expanded flat or running triangle. At that stage, the short term invalidation point would no longer apply.
Minor wave 4 may be reasonably expected to last at least about two weeks, and possibly up to about four weeks. It would most likely end somewhere within the fourth wave of one lesser degree; minute wave iv has its range from 2,843.03 to 2,796.34.
SECOND ALTERNATE HOURLY CHART
Click chart to enlarge.
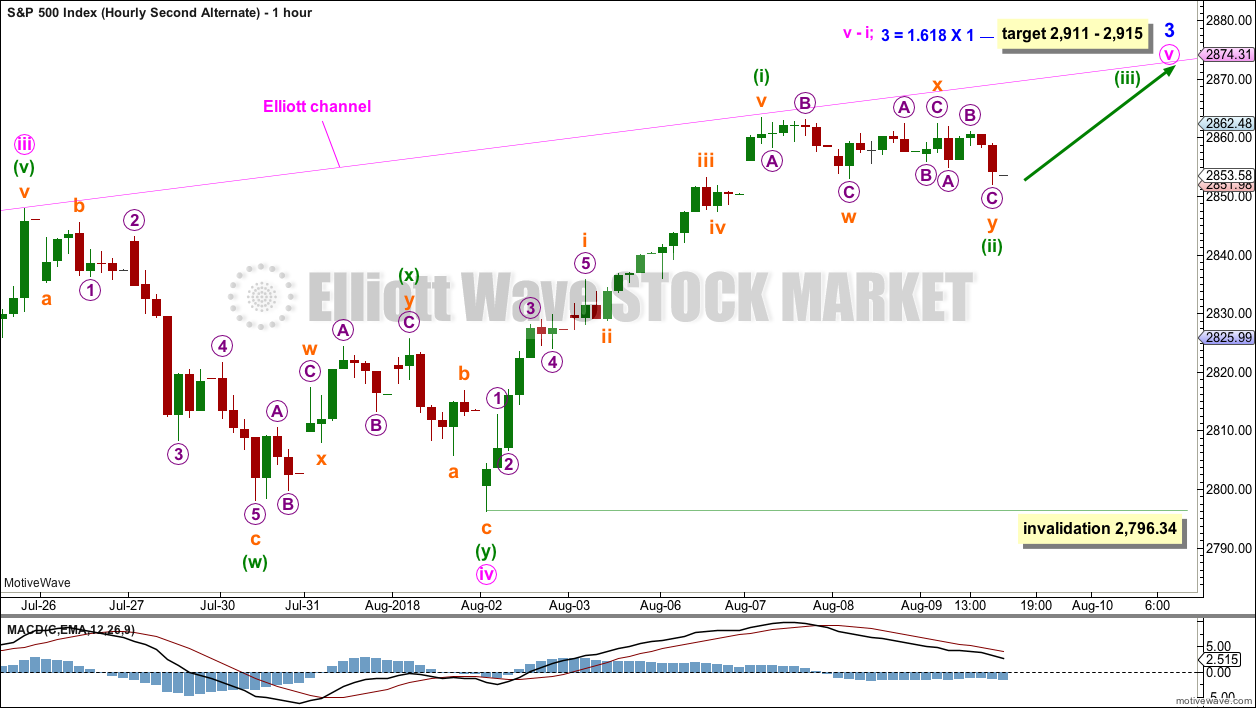
This second alternate wave count moves the degree of labelling within the last upwards wave down one degree. Minute wave v may be incomplete, and only minuette wave (i) within it may be complete.
Minuette wave (ii) is labelled as a complete double combination: flat – X – zigzag.
This wave count now expects an increase in upwards momentum as minuette wave (iii) moves higher.
If minuette wave (ii) continues any further, it may not move beyond the start of minuette wave (i) below 2,796.34.
TECHNICAL ANALYSIS
WEEKLY CHART
Click chart to enlarge. Chart courtesy of StockCharts.com.
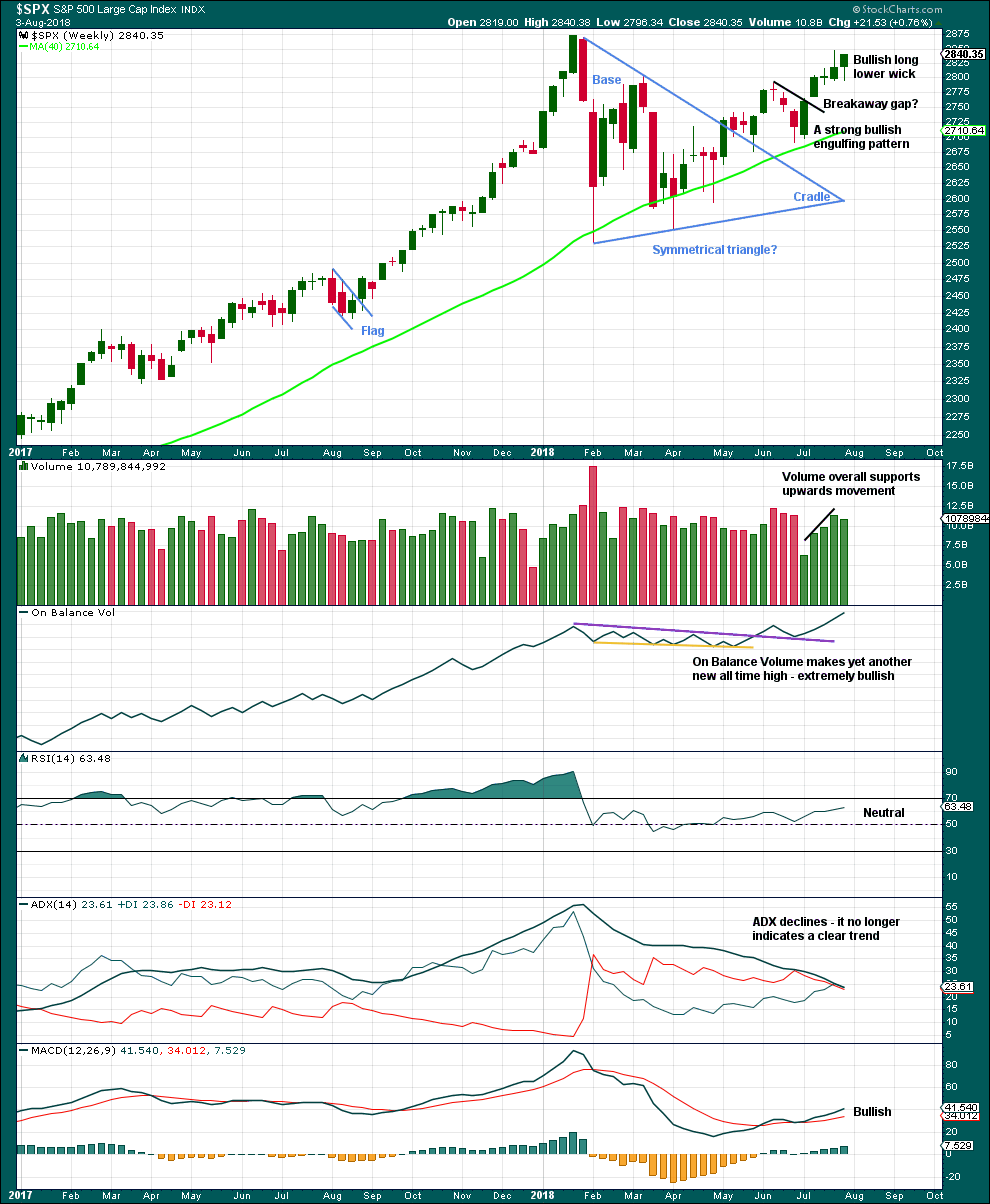
Another new high for On Balance Volume remains very bullish indeed, but that does not preclude another small pullback within this developing upwards trend. It is still expected that price is very likely to make new all time highs, but it will not move in a straight line.
Last week’s candlestick is bullish with a long lower wick. But it lacks support from volume, which may suggest a B wave.
DAILY CHART
Click chart to enlarge. Chart courtesy of StockCharts.com.
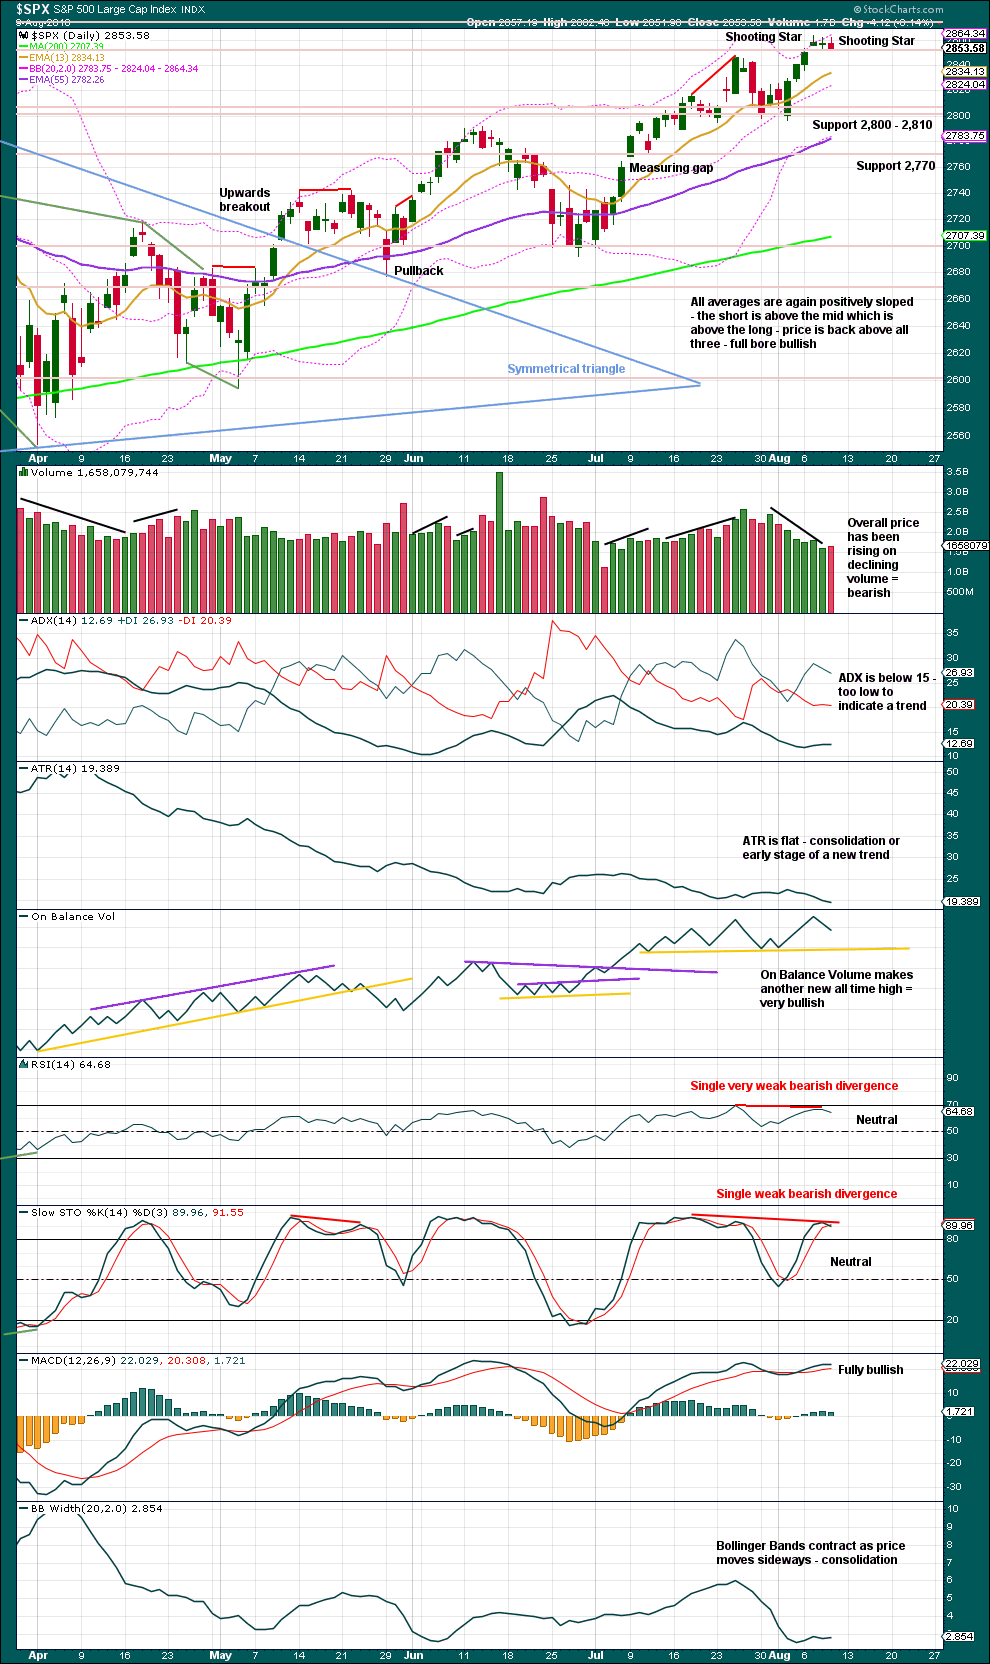
The symmetrical triangle may now be complete. The base distance is 340.18. Added to the breakout point of 2,704.54 this gives a target at 3,044.72. This is above the Elliott wave target at 2,922, so the Elliott wave target may be inadequate.
Since the low on the 2nd of April, 2018, price has made a series of higher highs and higher lows. This is the definition of an upwards trend. But trends do not move in perfectly straight lines; there are pullbacks and bounces along the way.
There are now two Shooting Star candlesticks at or about the last high. This is now a stronger bearish warning. There are three recent examples of Shooting Stars on this chart: on 31st of July, 26th of July, and 11th of June. The second two examples came after an upwards trend and were considered bearish reversal candlesticks. Both were closely accompanied by new all time highs from On Balance Volume and some bearish divergence with price and Stochastics. Both were quickly followed by reasonable pullbacks. This is almost exactly the same situation now, so it may happen again here. It is for this reason primarily that the main Elliott wave count expects to see a reasonable pullback begin here.
Just because this situation has recently appeared twice before and been followed by pullbacks does not mean that this time it also must be followed by a pullback. It only means that the probability of a pullback here is heightened. Nothing in technical analysis is certain.
The bigger picture remains extremely bullish with another new all time high from On Balance Volume as recently as the 7th of August.
VOLATILITY – INVERTED VIX CHART
WEEKLY CHART
Click chart to enlarge. Chart courtesy of StockCharts.com. So that colour blind members are included, bearish signals
will be noted with blue and bullish signals with yellow.
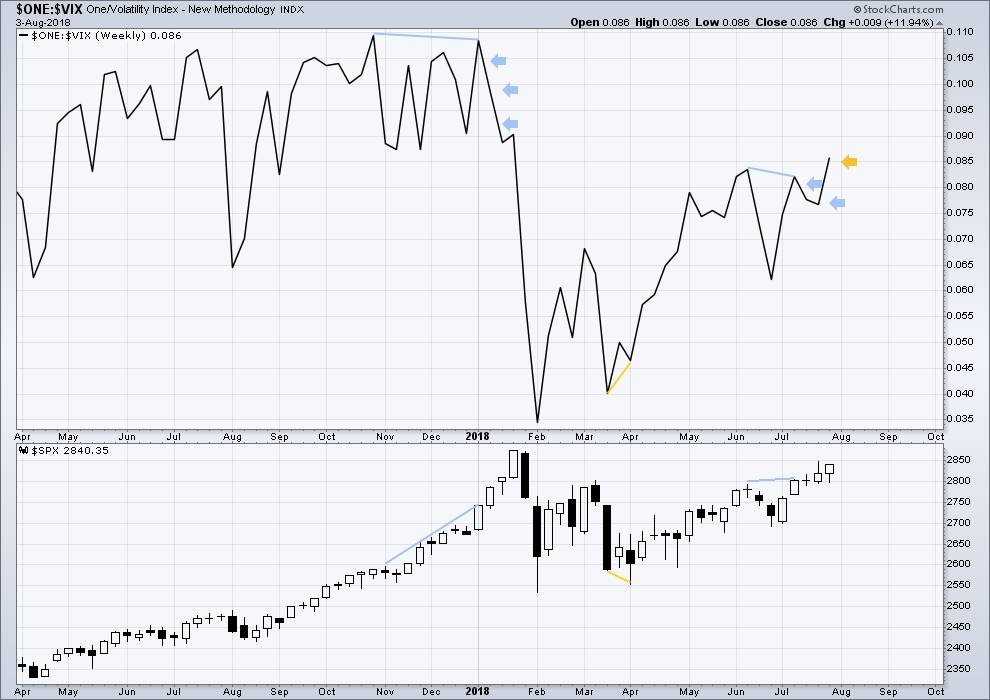
To keep an eye on the all time high for inverted VIX a weekly chart is required at this time.
Notice how inverted VIX has very strong bearish signals four weeks in a row just before the start of the last large fall in price. At the weekly chart level, this indicator may be useful again in warning of the end of primary wave 3.
Last week completes an inside week that closed green, and the balance of volume was upwards.
Upwards movement last week has support from declining market volatility. Inverted VIX has made a new short term high, but price has not yet; this short term divergence is bullish.
Inverted VIX is still some way off from making a new all time high.
DAILY CHART
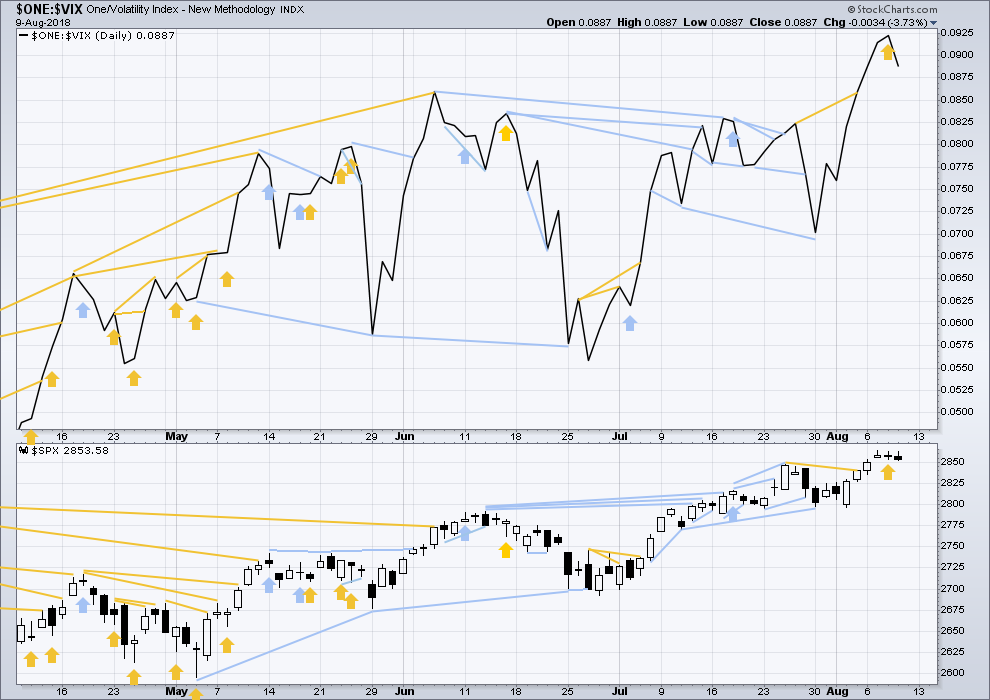
Click chart to enlarge. Chart courtesy of StockCharts.com. So that colour blind members are included, bearish signals
will be noted with blue and bullish signals with yellow.
Normally, volatility should decline as price moves higher and increase as price moves lower. This means that normally inverted VIX should move in the same direction as price.
Last noted mid term bearish divergence has not been followed yet by more downwards movement. It may still indicate downwards movement ahead as there is now a cluster of bearish signals from inverted VIX.
Bullish divergence noted in last analysis has not been followed by any upwards movement today, so it may have failed.
Price today moved slightly lower, but inverted VIX moved strongly lower. The fall in price today has good support from increasing market volatility, which is bearish.
BREADTH – AD LINE
WEEKLY CHART
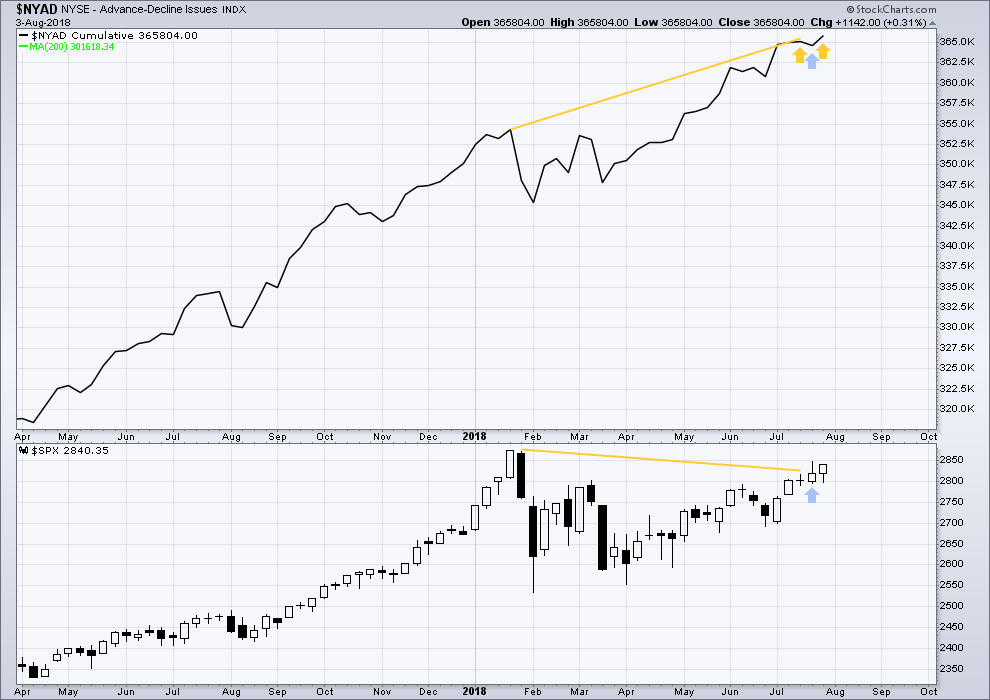
Click chart to enlarge. Chart courtesy of StockCharts.com.
When primary wave 3 comes to an end, it may be valuable to watch the AD line at the weekly time frame as well as the daily.
At this stage, there is very strong bullish divergence between price and the AD line at the weekly time frame. With the AD line making new all time highs, expect price to follow through with new all time highs in coming weeks.
Price last week completed an inside week with the balance of volume upwards. Upwards movement has support from rising market breadth. Another new all time high this week from the AD line is bullish.
DAILY CHART
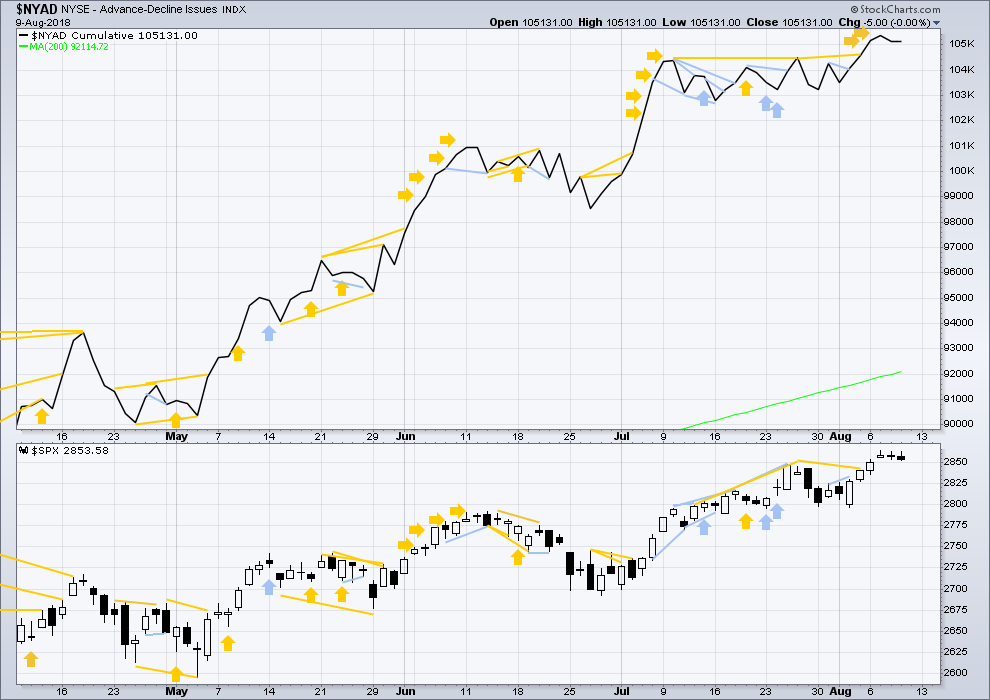
Click chart to enlarge. Chart courtesy of StockCharts.com.
There is normally 4-6 months divergence between price and market breadth prior to a full fledged bear market. This has been so for all major bear markets within the last 90 odd years. With no longer term divergence yet at this point, any decline in price should be expected to be a pullback within an ongoing bull market and not necessarily the start of a bear market. New all time highs from the AD line means that any bear market may now be an absolute minimum of 4 months away. It may of course be a lot longer than that. My next expectation for the end of this bull market may now be October 2019.
Breadth should be read as a leading indicator.
Price today moved slightly lower. The AD line is essentially flat. The slight decline in price has neutral support from market breadth. This is seen as neither bearish nor bullish today for the very short term.
Small caps and mid caps have both made new all time highs. Only large caps have to follow through; they do usually lag in the latter stages of a bull market.
Mid caps now have a strong Shooting Star pattern. This, along with a Gravestone doji at the high, looks bearish for the short term.
Small caps have another slight new high, but now there are is also a Gravestone doji and a Shooting Star about this high. This looks bearish for the short term.
DOW THEORY
The following lows need to be exceeded for Dow Theory to confirm the end of the bull market and a change to a bear market:
DJIA: 23,360.29.
DJT: 9,806.79.
S&P500: 2,532.69.
Nasdaq: 6,630.67.
Only Nasdaq at this stage is making new all time highs, with another new all time high on the 25th of July. DJIA and DJT need to make new all time highs for the ongoing bull market to be confirmed.
Charts showing each prior major swing low used for Dow Theory may be seen at the end of this analysis here.
Published @ 08:08 p.m. EST.
Just so that you all know what’s happening:
Sometimes I have other responsibilities on Saturdays. Like today, I did volunteer work in a conservation estate, hard hiking for about 3-6 hours. When that happens I start the analysis in the afternoon. I first prepare charts and write up each market until they’re all written. Then I begin video recording.
On these days if I were to keep going into the evening and record your video I would do a poor job. So I wait until I’ve had some sleep and do this Sunday morning, when I’m refreshed.
This is one reason why sometimes your end of week analysis is not published until late Saturday evening.
I just think that members may like to understand the why behind the variation in publication times for end of week analysis.
Thank you all for your patience.
main hourly chart updated:
the concern with this wave count is the end of this downwards wave is so very specific.
it needs to move below 2,798.11 at minimum to avoid a truncation (that price point allows for an alternate idea that sees minuette (a) over as a single zigzag at the low labelled submineutte w)
but it cannot move below 2,791.47.
great timing….. iv looks like a go
It does indeed.
Now the only question will be…. which fourth wave is it? Minute or minor?
We shall have an answer if price makes a new low below 2,791.47.
If it doesn’t… then it could still be either.
Man I just LOOO-VVVVE volatility! What a beautifuly day…GREEN EVERYWHERE!!! 🙂
SPX headed down in wave C or something. Fibo and pivot high support at 2825-28. Watch for a turn there. Then 2811 (78.6%), then 2800. As the volume profile showed, this is now “sliding up hill” to the higher volume node below 2800 (and if so, fulfilling Lara’s main count target too). But…it may turn before that.
uup monthly again (I showed this a few weeks back). The power of currency trends is AWESOME!!! Now that this has blown past the 62%, getting to the area of the 78% (derived fibo) at 26 is super likely. And if it goes by THAT…the 100% is likely, and then the 127% (derived fibo). Not trading advice, just situations to consider. I’m well up on my trade (Dec calls at 24), considering adding.
NDX’s swing down sure doesn’t look complete to me. This is a daily bar view. The overlapped 62% (of the most recent upswing) and 38% (of the prior larger upswing), along with several pivot lows in prior weeks in the same zone, is a very strong potential turn zone. And it’s likely to be hit right about when price is touching the major up trend line. The ellipse marks the spot. Get a turn back up there, and I’m backing up a small truck.
I’m starting to suspect that Monday will be the big down day, and that gray zone gets hit Monday or Tuesday.
I am still somewhat tentative on the matter of lunar cycles but it would seem to me that this turn ahead of the actual August 11 new moon date is significant. If we are indeed headed for a low sometime around August 26, date of next full moon (plus or minus three days), there is still a lot of market complacency going into this weekend…so far….
Ditto
I’ll mention again the asymmetry and positive EV (expected value) of just about to expire options.
You can buy at ATM put right now on SPY for about $35 that expires today. Max you can lose: $35. If SPY drops from say 283 to 280, you make about $170. If SPY rises from 283 to 10,000…you lose $35. I.e., even if you are neutral on the market, it’s a positive expectation play. Because the loss side is “terminated”, while the win side is not. Always true in options…but it becomes extreme and significant re: the math of “expected value” on these very short term options.
BTW, in my opinion, the most important book you’ll ever read about trading is probably “Portfolio Management Formulas” by Ralph Vince. The dirt on profitability, risk, edge, expected value, and optimal f. Fantastic stuff.
Yep. The Monday expiration contracts could also see a nice premium pop as VIX ramps higher.
NFLX has just about every property I look for in a set up right now. Hourly TL broken, bounce of a big swing 62% fibo, polarity inversion to “up”, and a 8 hour squeeze in progress. I WILL be buying upward movement here.
It may retest the 62% at 329, and if it turns back up there, a virtually perfect entry opportunity. Stop right under that 62%, and you’ve got incredible reward/risk.
From this volume profile of SPY we can see price is currently sitting at a volume node. However, if price falls…into a valley, and the peak of the next node is WAY DOWN THERE where Lara has been suggesting price is going to go: below 280 (2800 spx). So if price starts to drop here…expect acceleration and a long fall.
Thanks for posting that chart Kevin. I love how visually intuitive putting volume as horizontal bars like that is. Such a quick way to see support and resistance.
I’ve got SPY puts and VIX calls here. Looking at them as “all or nothing” re: the sell off so far, that is, I expect deeper and am not taking profits because I don’t want to possibly have to reload and take on risk. So it’s wait and see for me. Current lows are around the 38% but it’s been pretty badly sliced through; I think the 62% at least is high probability (2822), and the 78% (derived fibo) is very possible (2811).
Starting to look like the alternate hourly, with a minute a wave down complete and a minute b up underway. Right now the low is a bit above the 50% fibo, and that’s not stable IMO. 50%’ers tend to be temporary turn points, vs. a longer term swing level. So all the evidence I see indicates a minute c down right ahead of us. However, this all may be a several day process, with a lot of churn.
Eeeh.. Yogi…looks like you scared everyone away…!
Lunar cycle in play as expected…
Amazing isn’t it?
Have we discovered a genuine bankster Achillies’ heel? 🙂
I’m here. Where da bears at???
Soooo…you wanna peice of me??!!
Let’s rumble!!!
In the jungle! (Sorry, the ocean gives you an unfair advantage) 🙂