
Today’s signals from On Balance Volume, the AD line and VIX all point to the same direction for price next.
Three short term Elliott wave counts are provided for members to consider all possibilities.
Summary: A Shooting Star reversal candlestick pattern appears today. The main hourly Elliott wave count still expects a reasonable pullback to begin here and to end below 2,796.34 but not below 2,791.47.
The bigger picture remains extremely bullish.
The mid to longer term target is at 2,922 (Elliott wave) or 3,045 (classic analysis). Another multi week to multi month correction is expected at one of these targets.
The final target for this bull market to end remains at 3,616.
Always practice good risk management. Always trade with stops and invest only 1-5% of equity on any one trade.
New updates to this analysis are in bold.
The biggest picture, Grand Super Cycle analysis, is here.
Last historic analysis with monthly charts is here, video is here.
ELLIOTT WAVE COUNT
WEEKLY CHART
Click chart to enlarge.
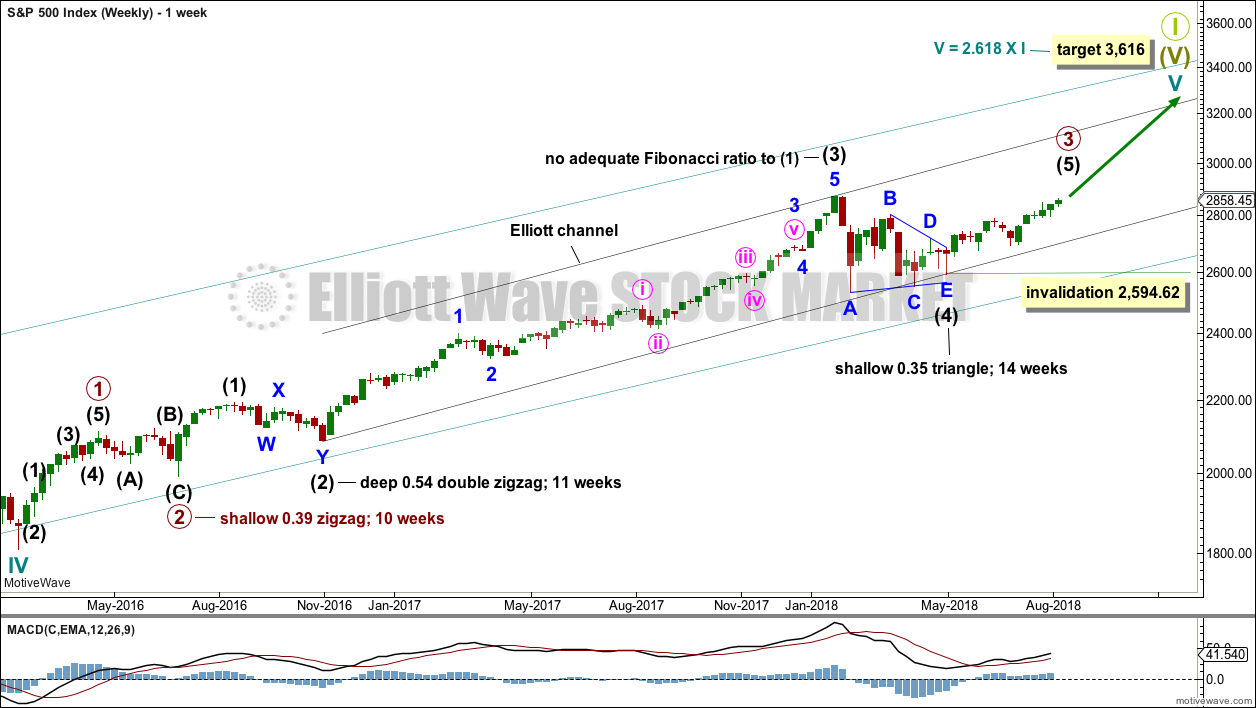
Cycle wave V must complete as a five structure, which should look clear at the weekly chart level and also now at the monthly chart level. It may only be an impulse or ending diagonal. At this stage, it is clear it is an impulse.
Within cycle wave V, the third waves at all degrees may only subdivide as impulses.
Intermediate wave (4) has breached an Elliott channel drawn using Elliott’s first technique. The channel is redrawn using Elliott’s second technique: the first trend line from the ends of intermediate waves (2) to (4), then a parallel copy on the end of intermediate wave (3). Intermediate wave (5) may end either midway within the channel, or about the upper edge.
Intermediate wave (4) may now be a complete regular contracting triangle lasting fourteen weeks, one longer than a Fibonacci thirteen. There is perfect alternation and excellent proportion between intermediate waves (2) and (4).
Within intermediate wave (5), no second wave correction may move beyond the start of its first wave below 2,594.62. However, the lower edge of the black Elliott channel drawn across the ends of intermediate degree waves should provide very strong support for any deeper pullbacks, holding price well above the invalidation point while intermediate wave (5) unfolds.
At this stage, the expectation is for the final target to me met in October 2019.
A multi week to multi month consolidation for primary wave 4 is expected on the way up to the final target.
The last bullish fifth wave of minor wave 5 to end intermediate wave (3) exhibited commodity like behaviour. It was strong and sustained. It is possible that the upcoming wave of minor wave 5 to end intermediate wave (5) to end primary wave 3 may exhibit similar behaviour, so we should be on the lookout for this possibility.
DAILY CHART
Click chart to enlarge.
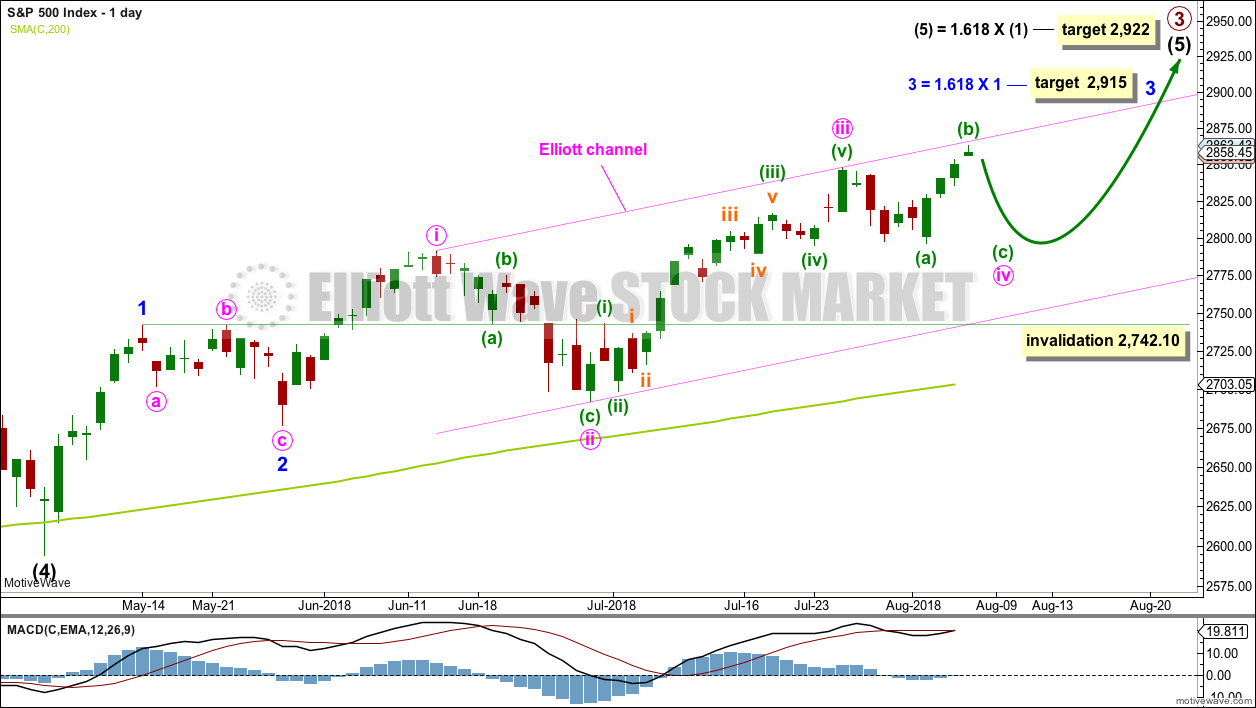
Intermediate wave (5) would be very likely to make at least a slight new high above the end of intermediate wave (3) at 2,872.87 to avoid a truncation.
Intermediate wave (3) exhibits no Fibonacci ratio to intermediate wave (1). It is more likely then that intermediate wave (5) may exhibit a Fibonacci ratio to either of intermediate waves (1) or (3). The most common Fibonacci ratio would be equality in length with intermediate wave (1), but in this instance that would expect a truncation. The next common Fibonacci ratio is used to calculate a target for intermediate wave (5) to end.
Intermediate wave (5) is unfolding as an impulse, and within it minor waves 1 and 2 are complete.
Minor wave 3 may only subdivide as an impulse. A target is calculated for minor wave 3 to end, which expects to see the most common Fibonacci ratio to minor wave 1. Minor wave 3 may last several weeks in total and should look like an impulse at the daily chart level. When it is complete, then minor wave 4 may last about one to two weeks in order for it to exhibit reasonable proportion to minor wave 2. Minor wave 4 must remain above minor wave 1 price territory above 2,742.10.
Within minor wave 3, minute waves i, ii and iii all look complete and minute wave iv may still be an incomplete expanded flat correction. This remains the main hourly wave count, and technical reasoning is outlined in the classic technical analysis section below.
The channel is redrawn today using Elliott’s first technique. The upper edge today has provided resistance. This channel is copied over to hourly charts.
MAIN HOURLY CHART

Click chart to enlarge.
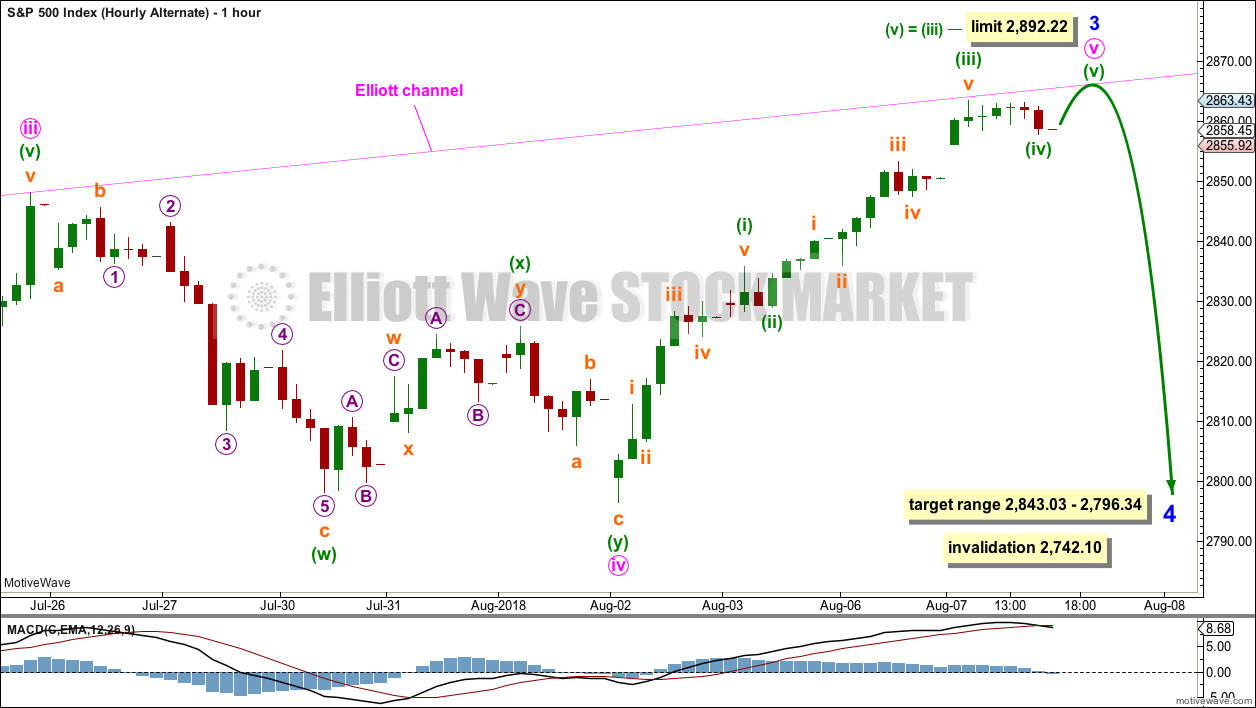
This remains the main wave count today.
It remains possible that minute wave iv is an incomplete expanded flat correction.
Within the expanded flat, minuette waves (a) and (b) both subdivide as threes. Minuette wave (b) is still within the most common range for B waves within flat corrections, between 1 and 1.38 times the length of wave A.
Minuette wave (c) may begin here to be a steep sharp pullback. It would be very likely to make a new low at least slightly below the end of minuette wave (a) at 2,796.34 to avoid a truncation and a very rare running flat.
Minute wave iv may not move into minute wave i price territory below 2,791.47.
ALTERNATE HOURLY CHART
Click chart to enlarge.
Here, the degree of labelling within minute wave iv is simply moved up one degree.
It is possible that minute wave iv could be over more quickly than was expected. If minute wave iv is over, then the possibility of an earlier than expected end to minute wave v must be considered.
For this labelling of minute wave v, minuette wave (iii) is shorter than minuette wave (i). This limits minuette wave (v) to no longer than equality in length with minuette wave (iii) at 2,892.22.
Minute wave v could be over with only one slight new high. Minor wave 3 could be over very quickly, and minor wave 4 may then begin.
Minor wave 4 may be reasonably expected to last at least about two weeks, and possibly up to about four weeks. It would most likely end somewhere within the fourth wave of one lesser degree; minute wave iv has its range from 2,843.03 to 2,796.34.
Minor wave 4 would most likely be a flat, combination or triangle. These are all sideways types of corrections.
SECOND ALTERNATE HOURLY CHART
Click chart to enlarge.
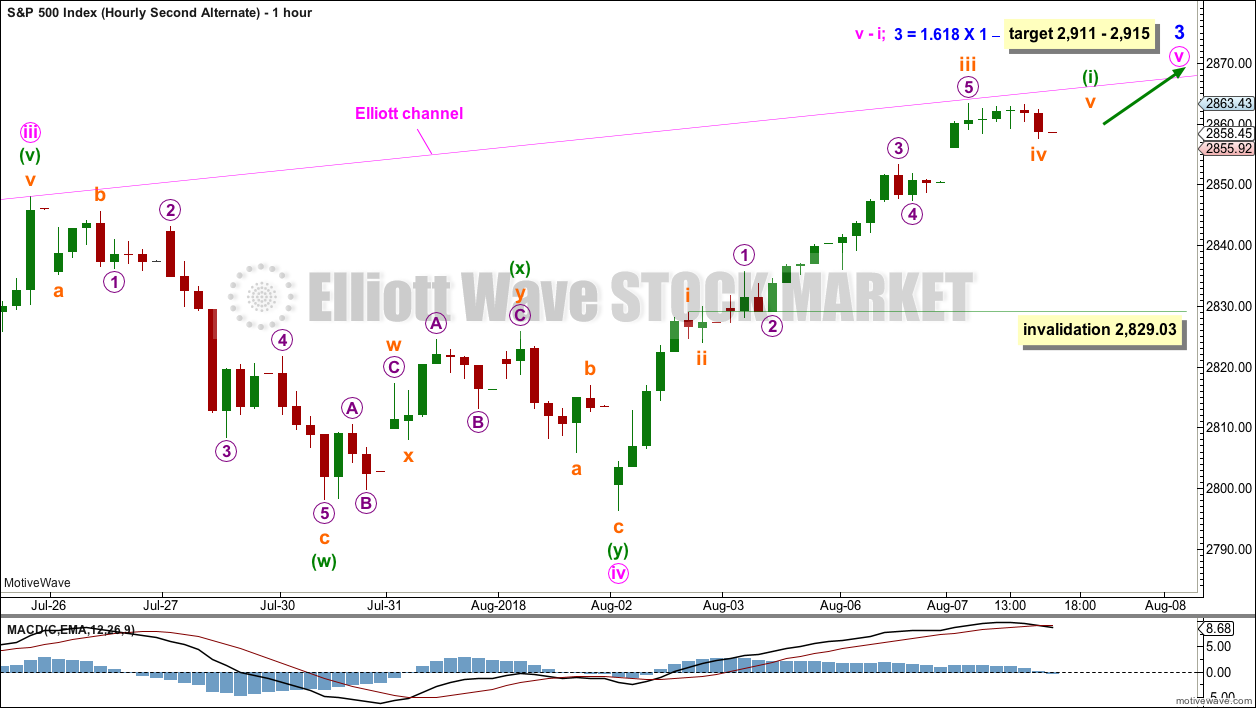
If minute wave iv is over, then it is also possible that minute wave v may not be close to completion and that it may extend further.
Minute wave v may be subdividing as an impulse, and within it minuette wave (i) may be very close to completion.
Within minuette wave (i), the small correction for subminuette wave iv may not move into subminuette wave i price territory below 2,829.03. Subminuette wave iv should be over here or very soon indeed. If price starts to move down fairly strongly tomorrow, then this wave count should be adjusted to see minuette wave (i) over at the last high.
There is more than one way to label the upwards movement within minute wave v which meet all Elliott wave rules.
TECHNICAL ANALYSIS
WEEKLY CHART
Click chart to enlarge. Chart courtesy of StockCharts.com.
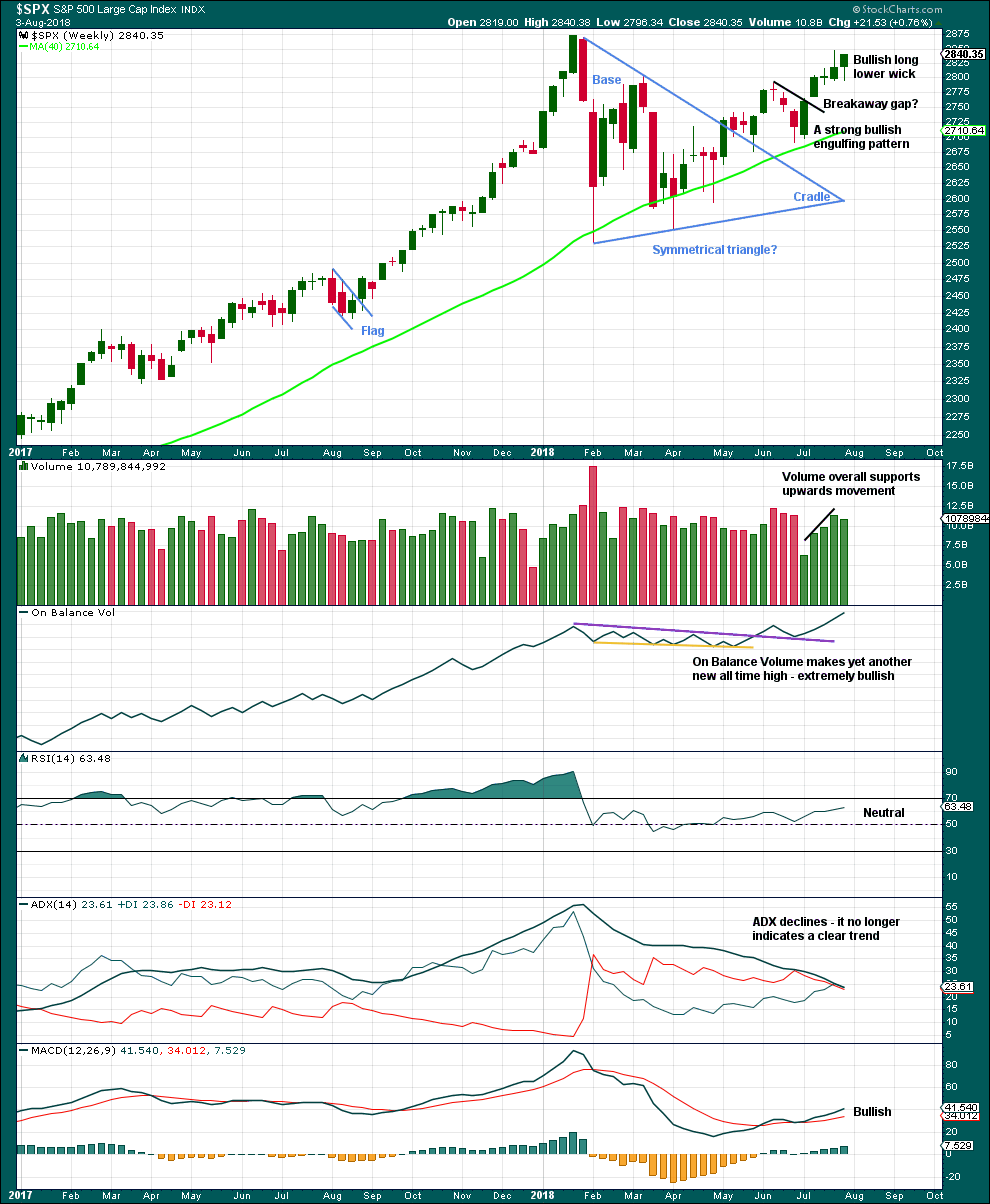
Another new high for On Balance Volume remains very bullish indeed, but that does not preclude another small pullback within this developing upwards trend. It is still expected that price is very likely to make new all time highs, but it will not move in a straight line.
Last week’s candlestick is bullish with a long lower wick. But it lacks support from volume, which may suggest a B wave.
DAILY CHART
Click chart to enlarge. Chart courtesy of StockCharts.com.
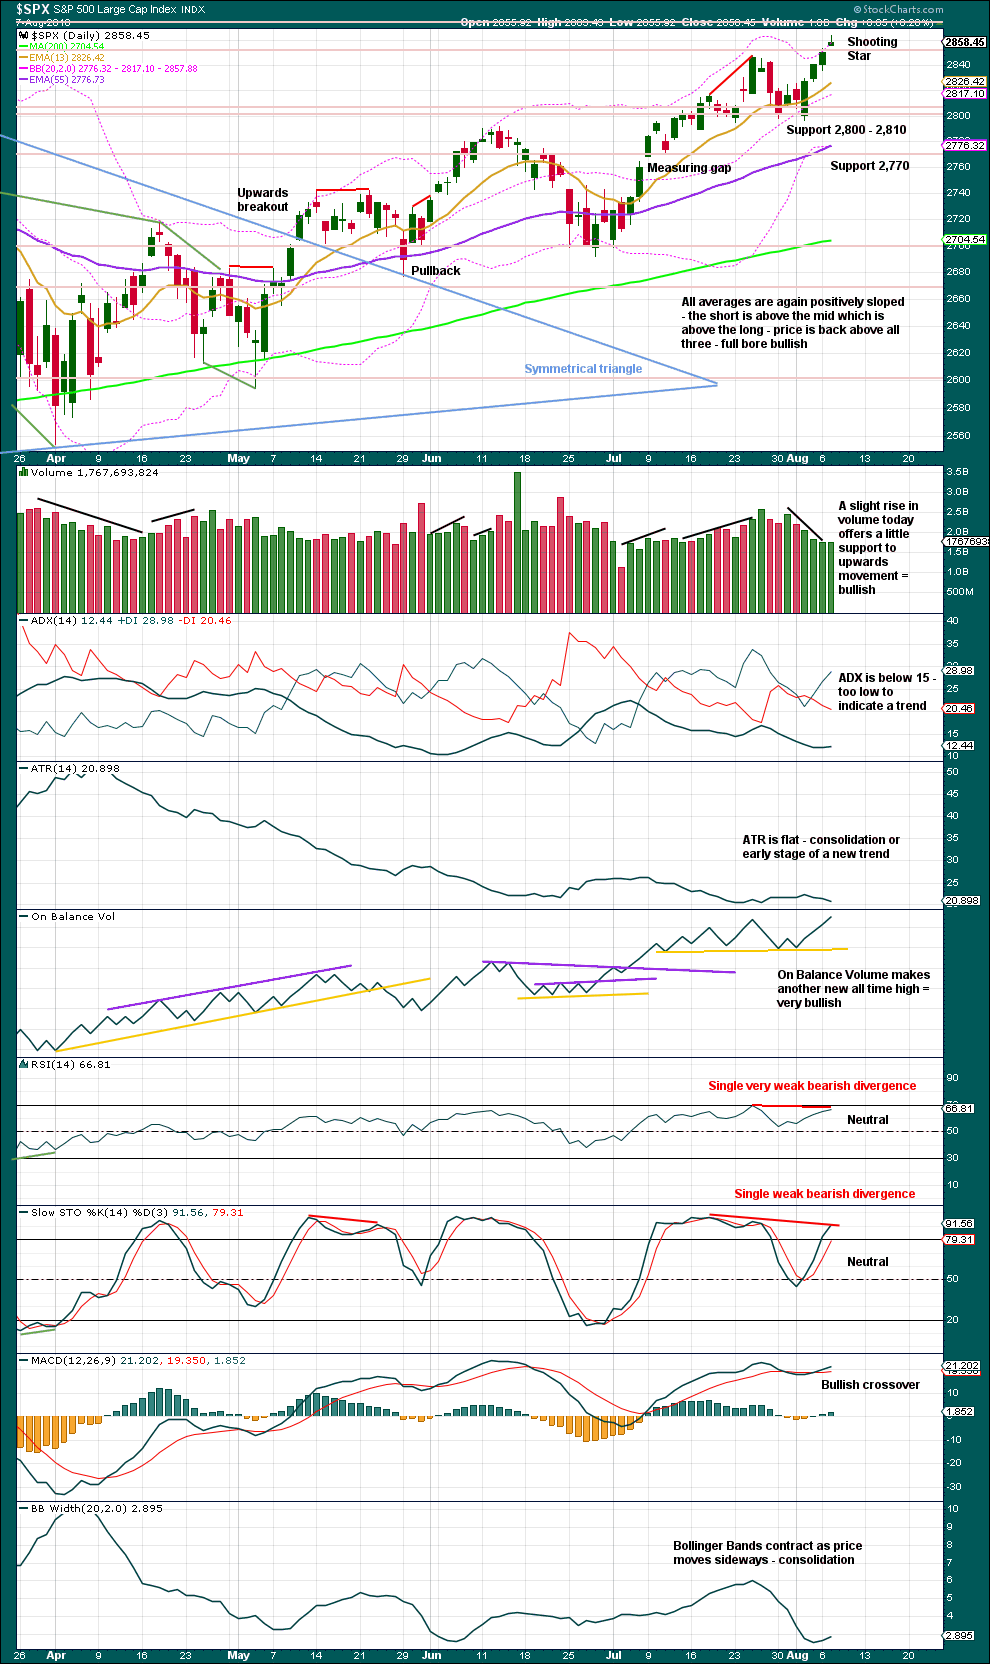
The symmetrical triangle may now be complete. The base distance is 340.18. Added to the breakout point of 2,704.54 this gives a target at 3,044.72. This is above the Elliott wave target at 2,922, so the Elliott wave target may be inadequate.
Since the low on the 2nd of April, 2018, price has made a series of higher highs and higher lows. This is the definition of an upwards trend. But trends do not move in perfectly straight lines; there are pullbacks and bounces along the way.
Today’s bearish warning comes from the Shooting Star candlestick that gapped higher, but it is very small though and this reduces the bearish implication. There are three recent examples of Shooting Stars on this chart: on 31st of July, 26th of July, and 11th of June. The second two examples came after an upwards trend and were considered bearish reversal candlesticks. Both were closely accompanied by new all time highs from On Balance Volume and some bearish divergence with price and Stochastics. Both were quickly followed by reasonable pullbacks. This is almost exactly the same situation today, so it may happen again here. It is for this reason primarily that the main Elliott wave count expects to see a reasonable pullback begin tomorrow or the day after.
Just because this situation has recently appeared twice before and been followed by pullbacks does not mean that this time it also must be followed by a pullback. It only means that the probability of a pullback here is heightened. Nothing in technical analysis is certain.
The bigger picture remains extremely bullish with another new all time high today from On Balance Volume
VOLATILITY – INVERTED VIX CHART
WEEKLY CHART
Click chart to enlarge. Chart courtesy of StockCharts.com. So that colour blind members are included, bearish signals
will be noted with blue and bullish signals with yellow.
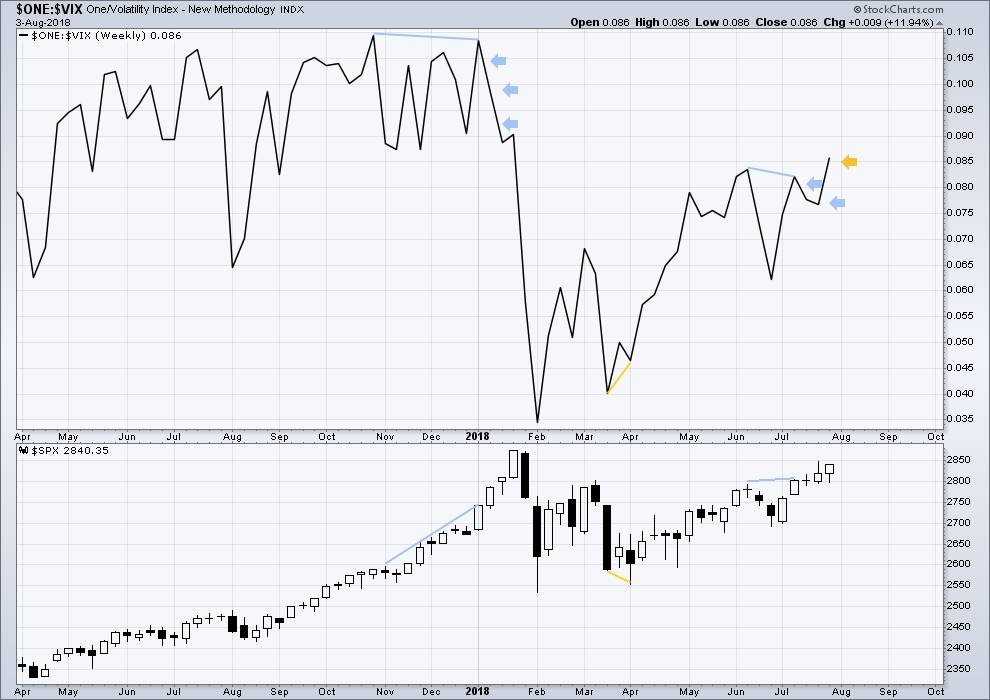
To keep an eye on the all time high for inverted VIX a weekly chart is required at this time.
Notice how inverted VIX has very strong bearish signals four weeks in a row just before the start of the last large fall in price. At the weekly chart level, this indicator may be useful again in warning of the end of primary wave 3.
Last week completes an inside week that closed green, and the balance of volume was upwards.
Upwards movement last week has support from declining market volatility. Inverted VIX has made a new short term high, but price has not yet; this short term divergence is bullish.
Inverted VIX is still some way off from making a new all time high.
DAILY CHART
Click chart to enlarge. Chart courtesy of StockCharts.com. So that colour blind members are included, bearish signals
will be noted with blue and bullish signals with yellow.
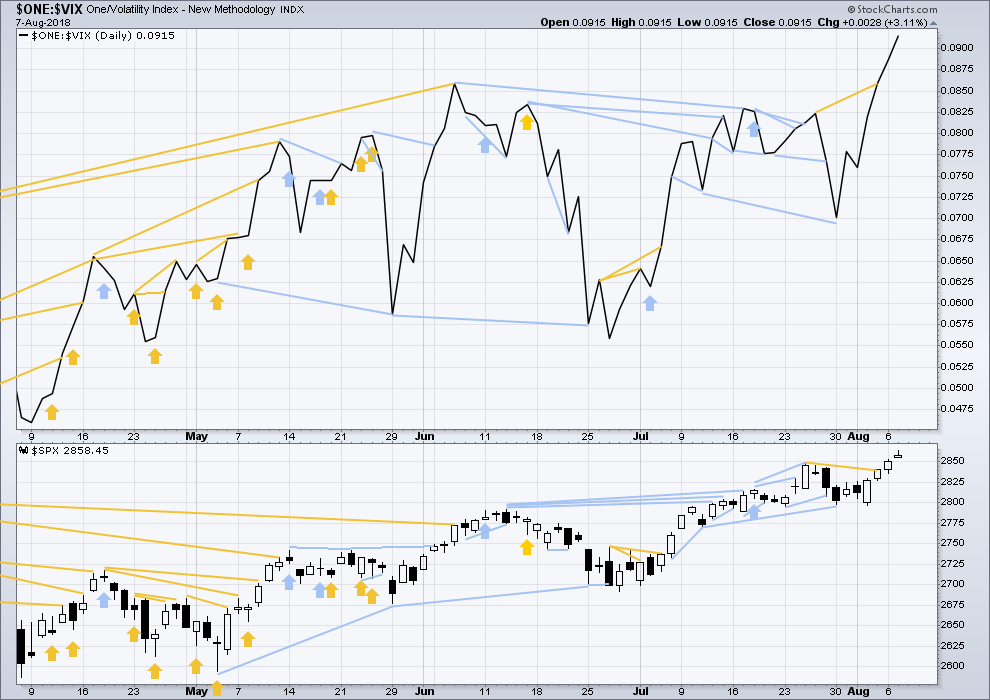
Normally, volatility should decline as price moves higher and increase as price moves lower. This means that normally inverted VIX should move in the same direction as price.
Last noted mid term bearish divergence has not been followed yet by more downwards movement. It may still indicate downwards movement ahead as there is now a cluster of bearish signals from inverted VIX.
Upwards movement today has strong support from declining market volatility as inverted VIX moves strongly higher. There is no new divergence.
BREADTH – AD LINE
WEEKLY CHART
Click chart to enlarge. Chart courtesy of StockCharts.com.
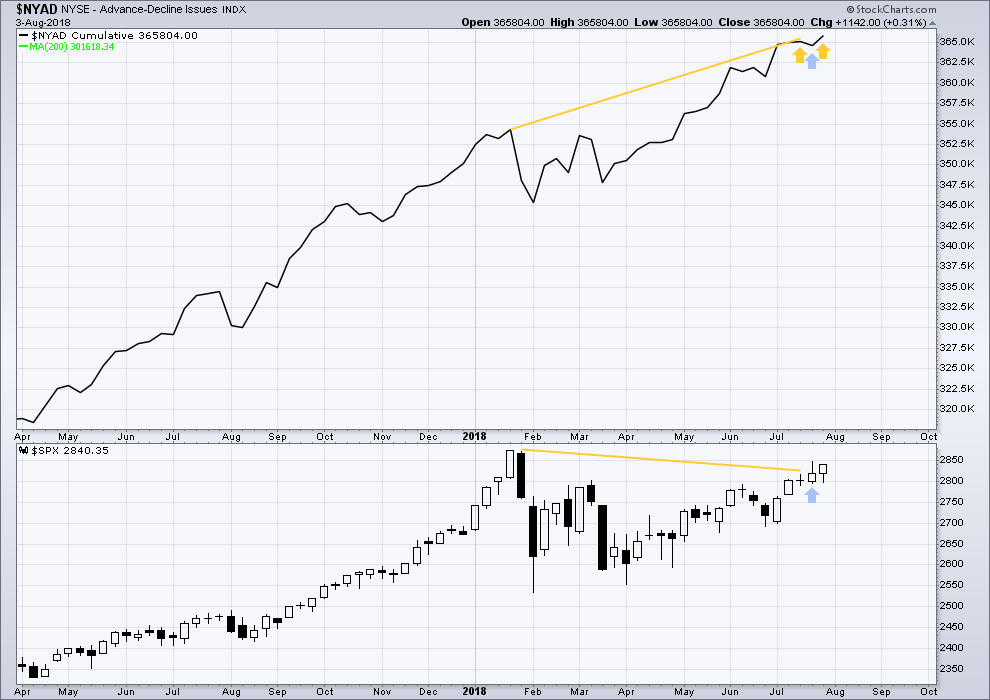
When primary wave 3 comes to an end, it may be valuable to watch the AD line at the weekly time frame as well as the daily.
At this stage, there is very strong bullish divergence between price and the AD line at the weekly time frame. With the AD line making new all time highs, expect price to follow through with new all time highs in coming weeks.
Price last week completed an inside week with the balance of volume upwards. Upwards movement has support from rising market breadth. Another new all time high this week from the AD line is bullish.
DAILY CHART
Click chart to enlarge. Chart courtesy of StockCharts.com.
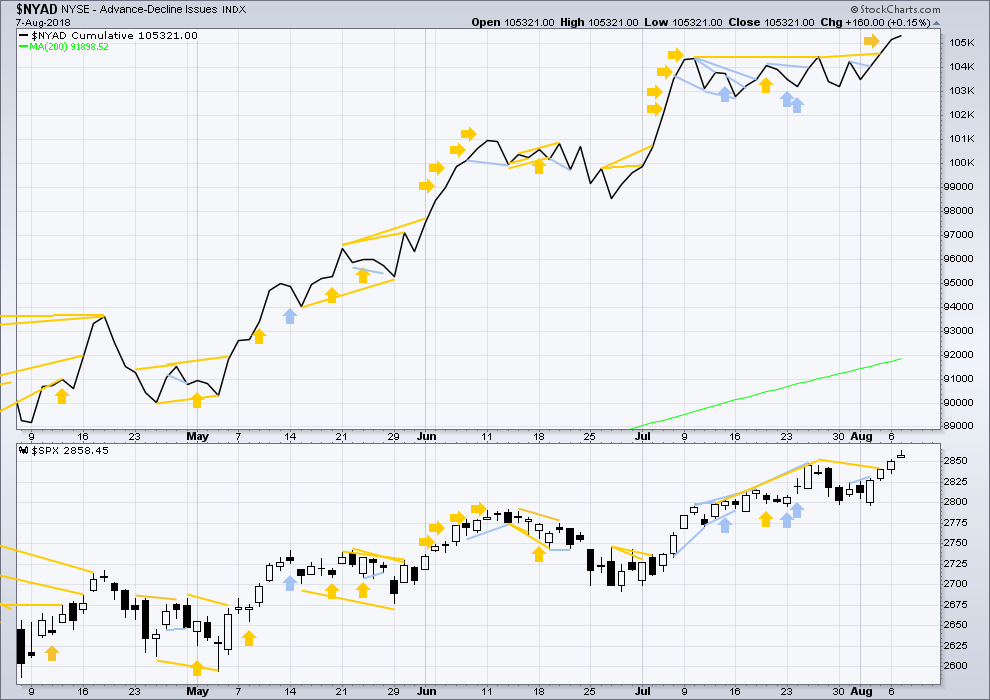
There is normally 4-6 months divergence between price and market breadth prior to a full fledged bear market. This has been so for all major bear markets within the last 90 odd years. With no longer term divergence yet at this point, any decline in price should be expected to be a pullback within an ongoing bull market and not necessarily the start of a bear market. New all time highs from the AD line means that any bear market may now be an absolute minimum of 4 months away. It may of course be a lot longer than that. My next expectation for the end of this bull market may now be October 2019.
Breadth should be read as a leading indicator.
The AD line today makes yet another new all time high (on the daily chart), which is extremely bullish.
Small caps and mid caps have both made new all time highs today. But they both have Gravestone doji for today’s candlesticks, suggesting pullbacks in both here. Only large caps have to follow through; they do usually lag in the latter stages of a bull market.
DOW THEORY
The following lows need to be exceeded for Dow Theory to confirm the end of the bull market and a change to a bear market:
DJIA: 23,360.29.
DJT: 9,806.79.
S&P500: 2,532.69.
Nasdaq: 6,630.67.
Only Nasdaq at this stage is making new all time highs, with another new all time high on the 25th of July. DJIA and DJT need to make new all time highs for the ongoing bull market to be confirmed.
Charts showing each prior major swing low used for Dow Theory may be seen at the end of this analysis here.
Published @ 08:28 p.m. EST.
main hourly chart updated:
I can see the downwards movement as a five today on the five minute chart, so I’m going to label it a first wave
it can also be seen as a single zigzag so that would fit the alternates as well
they all remain valid
If this works out, my stop will lock in my short-term position’s profits most likely tomorrow. I’ll look to re-enter long about 2800 or so. Great. My stop was missed at today’s low by mere pennies!
One other note: We have an ascending triangle on the SPX clearly seen at the 5 minute level. Today’s last 30 minute drop did not break the lower trend line of that ascending triangle. So it is still valid.
A picture is worth a thousand words.
So far as lunar musings go, might we see an impulse down complete tomorrow followed by a high of sorts for a minuette b wave on Friday-Monday to attend a new moon? If we get a lingering b wave things could still approximate a full moon wave four low later this month with extended motive waves and deep corrections….hmmnnnn….!
“if” we’re going down, it still sure looks like we’ll retest 2862 area again before going down. VIX is down quite a bit today, as of right now its spending its second day below its bollinger band…
Lets see what the last 90 minutes will bring…
Indeed it did retest. I think it proceeds up and through.
Should be interesting.
If you like big range trades BABA is a nice issue (5 minute chart here, see daily/weekly to see it’s ranging pattern). A long set up is here, waiting for triggers. It could continue to roll down to a lower pivot low around 166 though before breaking this down trend. But with multiple fibo support just underneath, I will take a long here if it fires. Note the squeeze too, could add juice.
AG now appears to me to the likely headed down to 5.38. Not good. I’ve taken my very small loss, “stopped out”. I’ve learned the hard way, if a bounce off a 61.8% fibo doesn’t hold…GET OUT (or perhaps…get short!).
Related, the tremendous market drop for silver (and metals in general) portends substantial manufacturing slow downs coming down the pike (according to some). Couple that with a yield curve inversion late this year…then a market top in Oct 2019…and conditions and indicators are big time prime for a major recession starting up in 2020.
We just had an unprecedented world wide heat wave, and forecast models of a heating earth are getting blown up. What if the earth has hit a global heating tipping point driven by feedback systems we don’t really understand? What if substantial areas of the planet with lots of real estate value start becoming uninhabitable? Here in the US I’d cite Dallas, Phoenix, and possibly even LA. The economic impact will be off the scale. This is coming with pretty much certainty. The only question is when; people still think it’s far enough over the event horizon (20 years? 40 years?) that they are completely complacent about it. However, recent events combined with current market/credit/money/real estate value cycles indicate to me that a climate change driven recession/depression of a scale unprecedented in post industrial society history may be pretty close around the corner, with the Oct 2019 GSC top as a leading indicator. As a former boss once said to me, “Kevin, don’t back into the future and let it break over your head! Turn around and face it going forward.” So I think about these worse case scenarios, and do my trading thing on it: what’s “the trade” (what’ll I do if anything about a 2020’s economic meltdown?) and what are the triggers (how do I decide unemotionally based on data that something is transpiring and I need to act?).
Actually we are ending a 500 year warming cycle and entering an extended cooling period. Arable land in the US will move considerably farther South, and world wide food production will decline dramatically due to the loss of US production. Everyone’s long term plan should definitely consider a move closer to equatorial regions. Cold, dry times, they are a’comin’…! Not a bad idea to start securing second passports (I have three!). You do not want to wait for the stampede…! 🙂
If NDX breaks to new highs (above 7514), I expect it to run to the 1.27% extension at 7667 fairly quickly. I’ve marked the spot with an ellipse: 7667 around next Wednesday. But only if 7514 gets exceeded.
T has turned last month very close to a 5 year or so 61.8% retrace level on the monthly chart. It’s now breaking a sharp down trend line on the monthly, and when you drill to the daily, it’s breaking the most recent and sharpest down trend line there too. I like it to the long side here.
Bam! The bulls just entered the arena. Bears scatter…but may be regrouping for a pitched battle.
In other words, it’s a range day.
A range day here would just be adding evidence that the market is in a topping process here and will be rolling over and selling off very soon now.
A sharp move up late today or tomorrow to the ATH could still occur, and if so I expect it to be a sucker final rally, followed immediately by sharp selling. A double top will form. We know it won’t hold but…it’ll scare a lot of $$$ into selling as the TA and misinformed EW folks cry “bull market over!”. Not.
The extreme complacency evident recently argues for a substantial correction. Confirmed negative divergences at recent highs are quite steep.
Insanity abounds! VXX in the red??!!
It’s gotta be the algos. Human traders are not this clueless…or are they??!! 🙂
Below the gap is:
2849 (23%)
2838 (38%)
2830 (50%)
2822 (62%)
2811 (78%)
but perhaps the market will be satisfied with the gap fill?
The DOW seems to be driving this selling, but /ES looks like it may bounce off a 23.6% at 25528. NDX holding up well. This doesn’t look like it’s going far down overall, to me. We’ll see what the next hour brings.
Rats!
I thought I would get a chance to buy more VIX calls under 11.00
Fortunately I grabbed some at the close yesterday. We probably reclaim the lower B band today.
Verne,
BTC and ETH amougst others undergoing correct with BTC target looking more like $5,200 as $6,845 support got taken out with minimal resistance. I suspect the impact on RIOT and others as the correction for Wave 4 unfolds. Your thoughts?
A lot of funny business going on in the crypto space right now. I agree the fourth wave apparently not quite done, but no question we are eventually going much higher.
I’d appreciate that. I have a very small position…but well underwater!! I bought it with the intent of “hold til profitable” under the theory the bitcoin wave isn’t over yet. I’m hopeful that you agree.
“Tops are a process; bottoms are an event.”
It’s actually the June 11 shoot star “example” that somewhat worries me: it was followed by 2 more days of sideways action, then tumbled into that big 11 day iv wave we suffered through, a rolling top. That’s a likely scenario here.
On the other hand, we’ve had a grinding but pretty steady move up. It’s not to nominal length yet relative to recent moves (the market likes symmetry), and the hugely attractive ATH is just over head. I wouldn’t be surprised at all to see a quick and strong high power move up to 2873 to suck in the late arriving retail crowd, finishing this entire move up as a complete minor 3, with a sharp reversal to initiate the minor 4 down. Temporarily giving the market a double top look. It’s almost too perfect.
Hi everybody.
I just wanted to made a comment on how difficult this analysis was today. I had a really tough time deciding on the main and alternate hourly wave counts.
I would have to judge the differences in probability to be not too great. I almost wanted to sit on the fence, but I’ve decided the main count looks like it has a slightly higher probability.
I just wanted you all to know how that went down today.
Thanks Lara!
MDY at new ATH today!
Thank you, Lara. I appreciate your careful and precise work — including letting us know when uncertainty is high.
Ditto Curtis. Thank you Lara. I think your analysis and commentary above made clear the level of uncertainty. But the outright stating of the difficulty of choosing the main and alternates makes certain all readers are clearly aware of the situation. In fact, I am astonished it does not occur much more often than it does. I don’t recall very many times or any time when the hourly main and alternates were essentially equal in probability. It is astonishing to me that you are not forced to say this much more often. But that is why you are the leader. Thanks for the analysis and the head’s up.
That being said, your analysis has helped me because I have moved my stop loss on my short term account long positions to just under this morning’s gap. If stopped out, I will be quite profitable and quite happy. If not stopped out, the market goes up more and I may continue to raise the stop very close again. If stopped out, I will gladly re-enter long or short depending on the situation. But it appears we are entering a time of lower profit potentials on long positions before a larger correction occurs. As of now, my long term accounts have a lower stop based on the weekly data, charts etc. That may change soon as well. I cannot complain one bit when all positions are handsomely profitable at this time.
You’re welcome folks. I’m glad you appreciate the honesty and no one here is asking me to give them certainty in this market.
That gap is now closed, so it’s an exhaustion gap, that’s bearish for the short term. So taking profits on long positions here looks like a reasonable approach.
Nicely done Rodney.