
An outside day fits all three short term Elliott wave counts.
Volume, On Balance Volume and the AD line will be used today to determine if the consolidation is likely over or may continue.
Summary: Assume that while price remains above 2,791.47 either a shallow consolidation may continue sideways for a few days or a brief pullback was over at the last low. A new high above 2,848.03 with support from volume would indicate the correction is over.
A new low below 2,791.47 would indicate a deeper pullback may continue. The target for it to end would then be about 2,752.
The bigger picture remains extremely bullish.
The next target is about 2,915, where another consolidation to last about two weeks may be expected.
The invalidation point remains at 2,743.26.
The mid to longer term target is at 2,922 (Elliott wave) or 3,045 (classic analysis). Another multi week to multi month correction is expected at one of these targets.
The final target for this bull market to end remains at 3,616.
Always practice good risk management. Always trade with stops and invest only 1-5% of equity on any one trade.
New updates to this analysis are in bold.
The biggest picture, Grand Super Cycle analysis, is here.
Last historic analysis with monthly charts is here, video is here.
ELLIOTT WAVE COUNT
WEEKLY CHART
Click chart to enlarge.
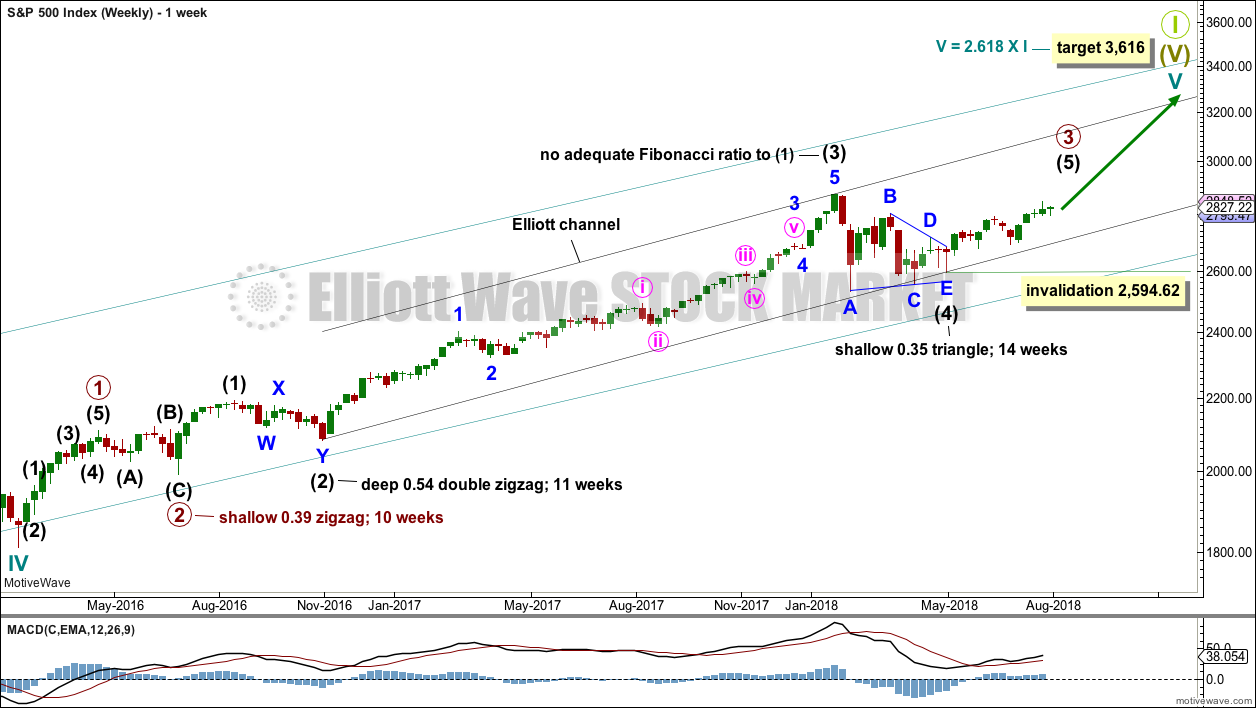
Cycle wave V must complete as a five structure, which should look clear at the weekly chart level and also now at the monthly chart level. It may only be an impulse or ending diagonal. At this stage, it is clear it is an impulse.
Within cycle wave V, the third waves at all degrees may only subdivide as impulses.
Intermediate wave (4) has breached an Elliott channel drawn using Elliott’s first technique. The channel is redrawn using Elliott’s second technique: the first trend line from the ends of intermediate waves (2) to (4), then a parallel copy on the end of intermediate wave (3). Intermediate wave (5) may end either midway within the channel, or about the upper edge.
Intermediate wave (4) may now be a complete regular contracting triangle lasting fourteen weeks, one longer than a Fibonacci thirteen. There is perfect alternation and excellent proportion between intermediate waves (2) and (4).
Within intermediate wave (5), no second wave correction may move beyond the start of its first wave below 2,594.62. However, the lower edge of the black Elliott channel drawn across the ends of intermediate degree waves should provide very strong support for any deeper pullbacks, holding price well above the invalidation point while intermediate wave (5) unfolds.
At this stage, the expectation is for the final target to me met in October 2019.
A multi week to multi month consolidation for primary wave 4 is expected on the way up to the final target.
The last bullish fifth wave of minor wave 5 to end intermediate wave (3) exhibited commodity like behaviour. It was strong and sustained. It is possible that the upcoming wave of minor wave 5 to end intermediate wave (5) to end primary wave 3 may exhibit similar behaviour, so we should be on the lookout for this possibility.
DAILY CHART
Click chart to enlarge.
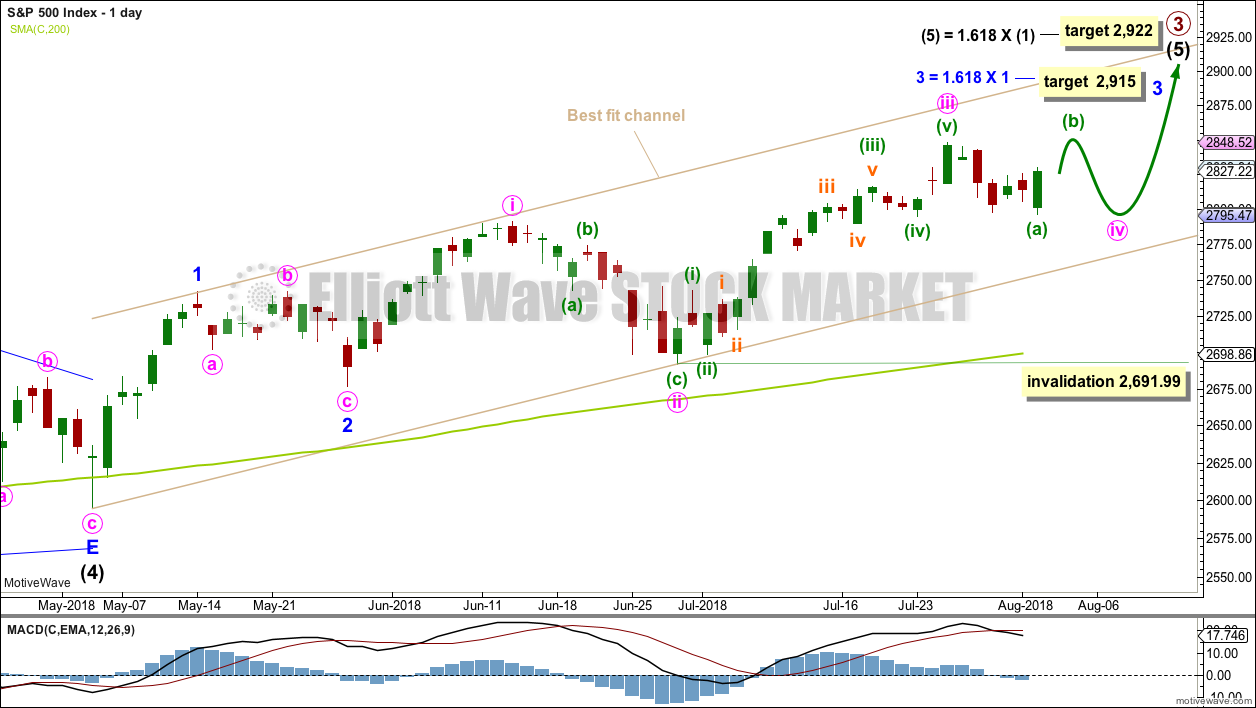
Intermediate wave (5) would be very likely to make at least a slight new high above the end of intermediate wave (3) at 2,872.87 to avoid a truncation.
Intermediate wave (3) exhibits no Fibonacci ratio to intermediate wave (1). It is more likely then that intermediate wave (5) may exhibit a Fibonacci ratio to either of intermediate waves (1) or (3). The most common Fibonacci ratio would be equality in length with intermediate wave (1), but in this instance that would expect a truncation. The next common Fibonacci ratio is used to calculate a target for intermediate wave (5) to end.
It is possible that minute wave iii could be over at last week’s high; if it is complete here, it would not exhibit a Fibonacci ratio to minute wave i. Minute wave iv must be very shallow to remain above minute wave i price territory at 2,791.47.
At this stage, it is possible that minute wave iv was over at today’s low, or that it may continue sideways for a few days as a flat. Both ideas are outlined in hourly charts below.
If downwards movement continues below 2,791.47, then the best alternate idea would be to move the degree of labelling within minute wave iii all down one degree and see only minuette wave (i) within minute wave iii complete at the last high. Downwards movement would then be labelled minuette wave (ii), which may not move beyond the start of minuette wave (i) below 2,691.99. However, downwards movement should find support reasonably above the invalidation point at support about the lower edge of the best fit channel.
A target is calculated for minor wave 3 to end, which expects to see the most common Fibonacci ratio to minor wave 1. Minor wave 3 may last several weeks in total and should look like an impulse at the daily chart level. When it is complete, then minor wave 4 may last about one to two weeks in order for it to exhibit reasonable proportion to minor wave 2. Minor wave 4 must remain above minor wave 1 price territory.
A best fit channel is added in taupe to this chart. It contains all of intermediate wave (5) so far. The lower edge may provide support for any deeper pullbacks. The upper edge may provide resistance.
FIRST HOURLY CHART
Click chart to enlarge.
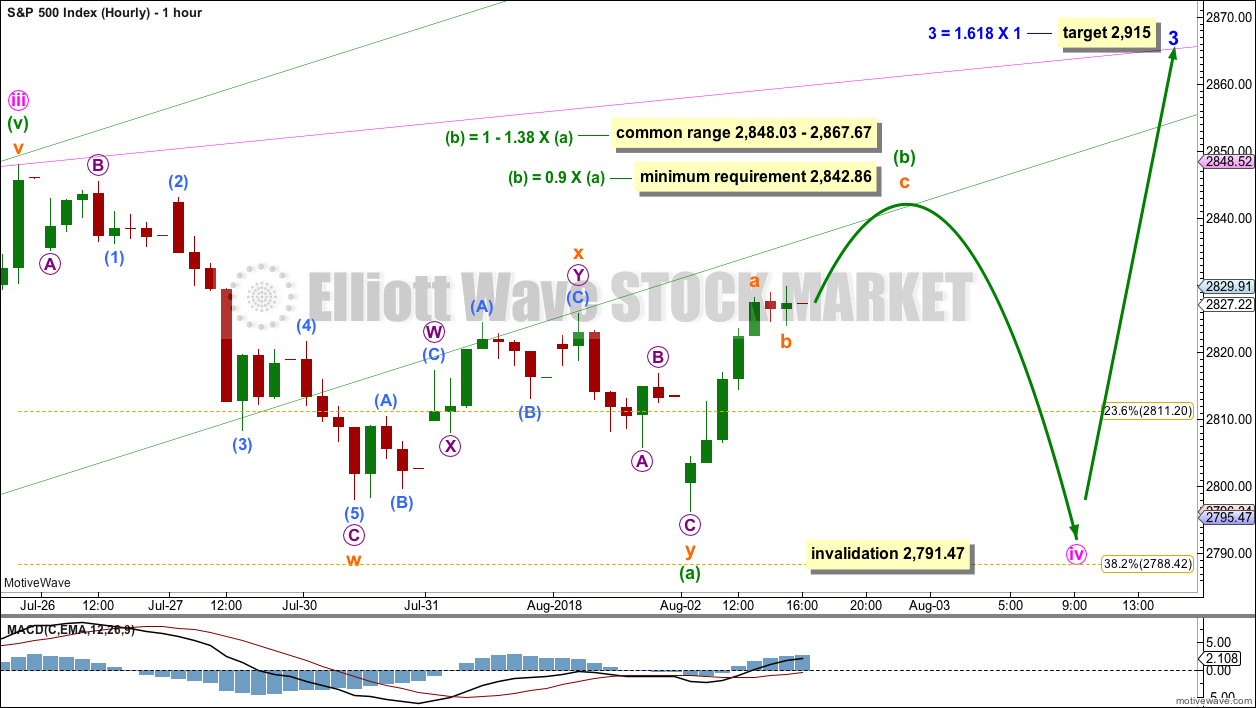
If minute wave iii was over at the last high, then there are reasonable Fibonacci ratios within it.
Minute wave ii was a very deep 0.87 single zigzag lasting 11 sessions. Minute wave iv would most likely be shallow, and most likely exhibit alternation in structure with minute wave ii as a flat, combination or triangle.
At this stage, if minute wave iv is continuing, then the structural possibilities may be narrowed down to a flat correction. Rules for triangles or combinations are at this stage not met.
Within the flat correction, minuette wave (b) must retrace a minimum 0.9 length of minuette wave (a), and it may make a new high above the start of minuette wave (a) as in an expanded flat. Minuette wave (b) should exhibit weakness; it should have light and declining volume, and should not come with a new high for either of On Balance Volume or the AD line.
When minuette wave (b) has reached the minimum requirement and may be a complete structure, then minuette wave (c) downwards would be most likely to make at least a slight new low below the end of minuette wave (a) at 2,796.34 to avoid a truncation.
Minute wave iv may not move into minute wave i price territory below 2,791.47.
SECOND HOURLY CHART
Click chart to enlarge.
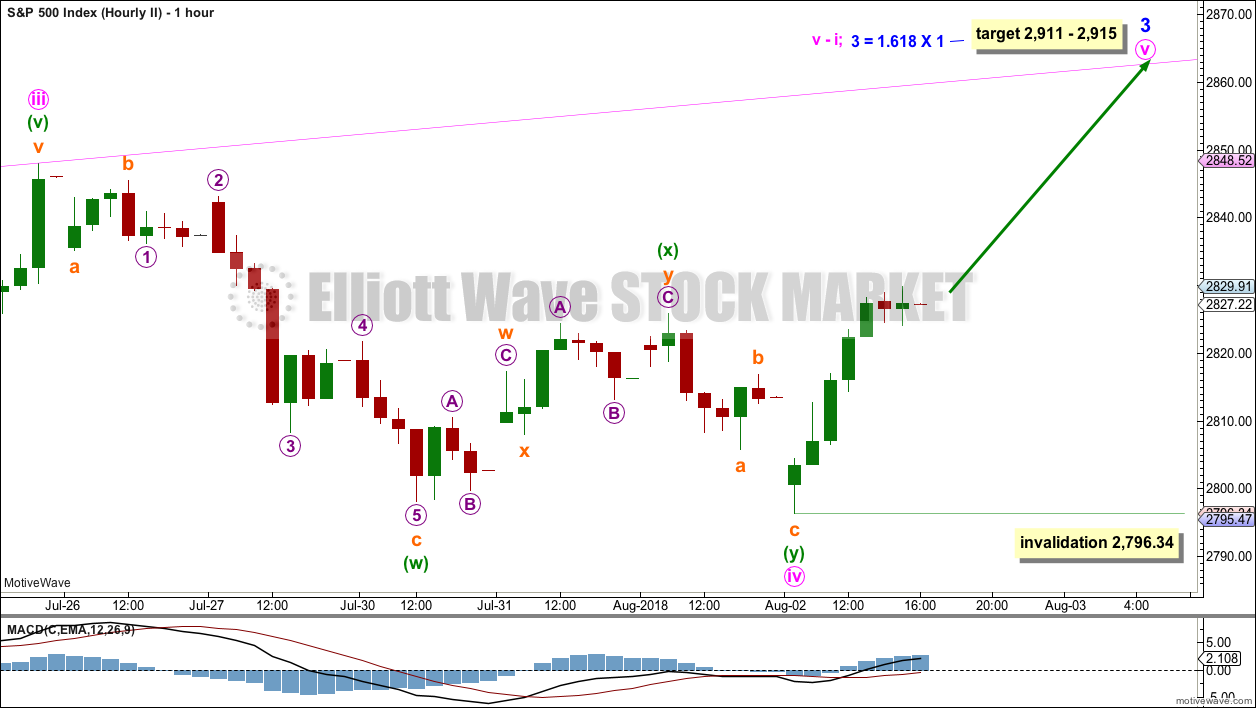
By simply moving the degree of labelling within the correction all up one degree, it is possible today that minute wave iv could again be over as a shallow double zigzag.
However, it would be very brief and so disproportionate to minute wave ii. Minute wave ii lasted 11 sessions. Minute wave iv would have lasted only six sessions.
There would be a little alternation in structure as minute wave ii was a single zigzag and minute wave iv may be a double zigzag. Alternation is a guideline, not a rule, and alternation in structure does not always occur.
There would be excellent alternation in depth: minute wave ii was very deep and minute wave iv would be very shallow.
Within minute wave v, no second wave correction may move beyond the start of its first wave below 2,796.34.
If price makes a new high above 2,848.03 and meets one or more of the following conditions, then this would be the main wave count:
– support from volume
– a new high from On Balance Volume
– a new high from the AD line
ALTERNATE HOURLY CHART
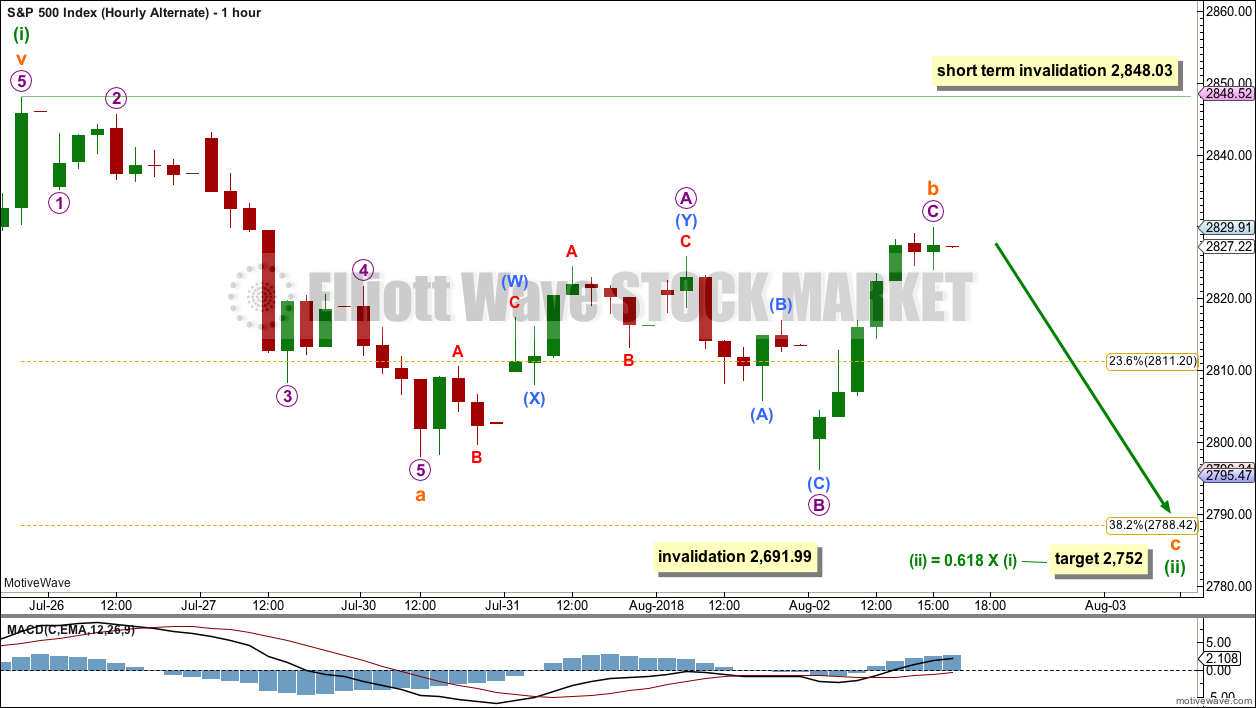
Click chart to enlarge.
This alternate wave count moves the degree of labelling within minute wave iii all down one degree.
If minuette wave (i) was over at the last high, then downwards movement of the last six sessions may be the start of minuette wave (ii). A target for minuette wave (ii) would reasonably be the 0.618 Fibonacci ratio of minuette wave (i) about 2,752. However, if this target is wrong, it may be a little too low. There may be support just above this point at the lower edge of the best fit channel, which is seen on the daily chart.
Minuette wave (ii) may not move beyond the start of minuette wave (i) below 2,691.99.
This wave count sees minuette wave (ii) as a possible single zigzag. Within minuette wave (ii), subminuette wave a subdivides as a five, and subminuette wave b now may be complete as a regular flat correction. This wave count still has a slightly better fit for recent subdivisions.
If subminuette wave b continues higher, then it may not move beyond the start of subminuette wave i above 2,848.03.
TECHNICAL ANALYSIS
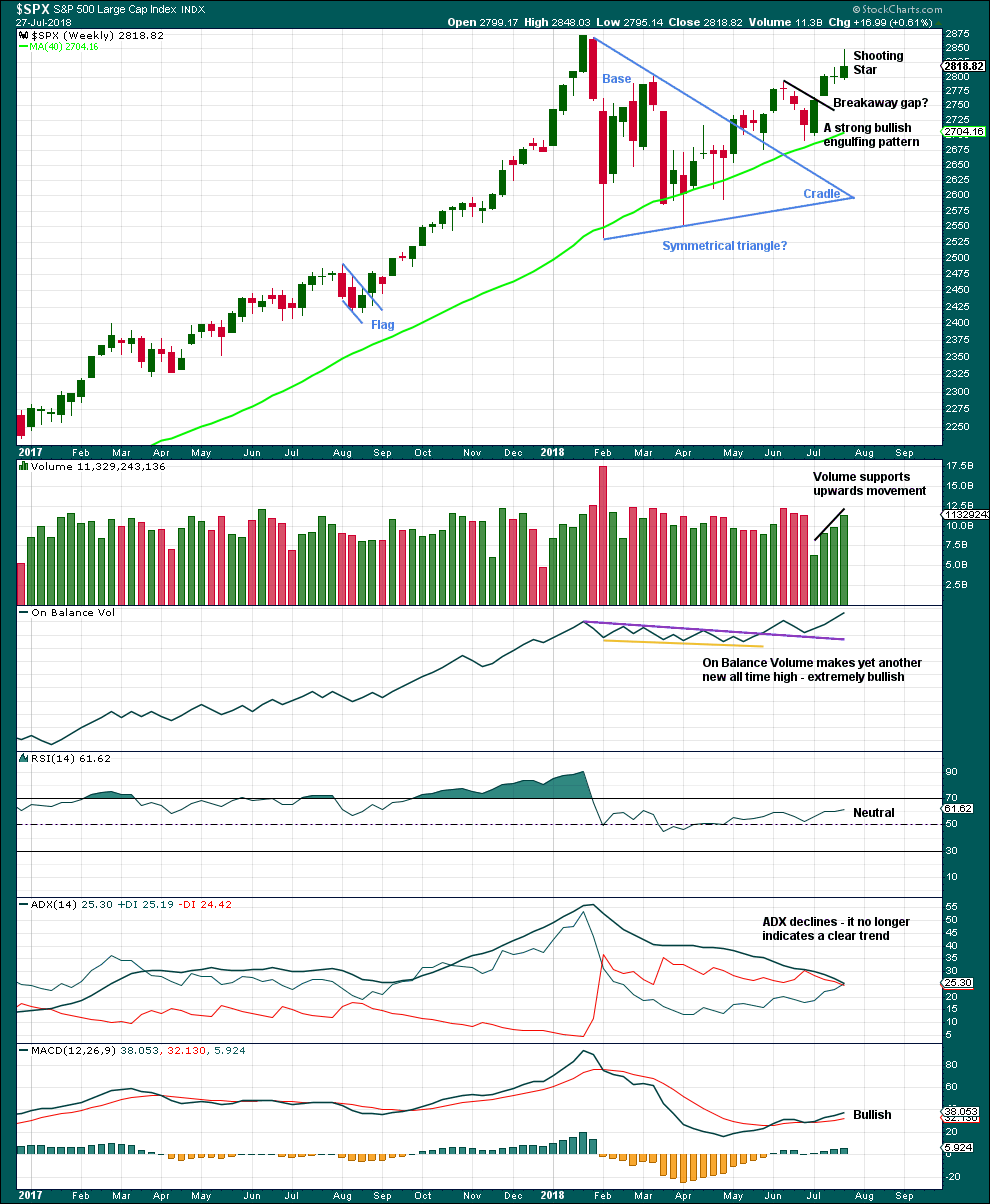
WEEKLY CHART
Click chart to enlarge. Chart courtesy of StockCharts.com.
Recent new highs for On Balance Volume remains very bullish indeed, but that does not preclude another reasonable pullback within this developing upwards trend. It is still expected that price is very likely to make new all time highs, but it will not move in a straight line.
A Doji candlestick followed now by a Shooting Star, which did not gap higher, is reasonably bearish for the short term. A pullback or small consolidation may result.
Bullish volume and another new all time high from On Balance Volume are very strong bullish signals.
DAILY CHART
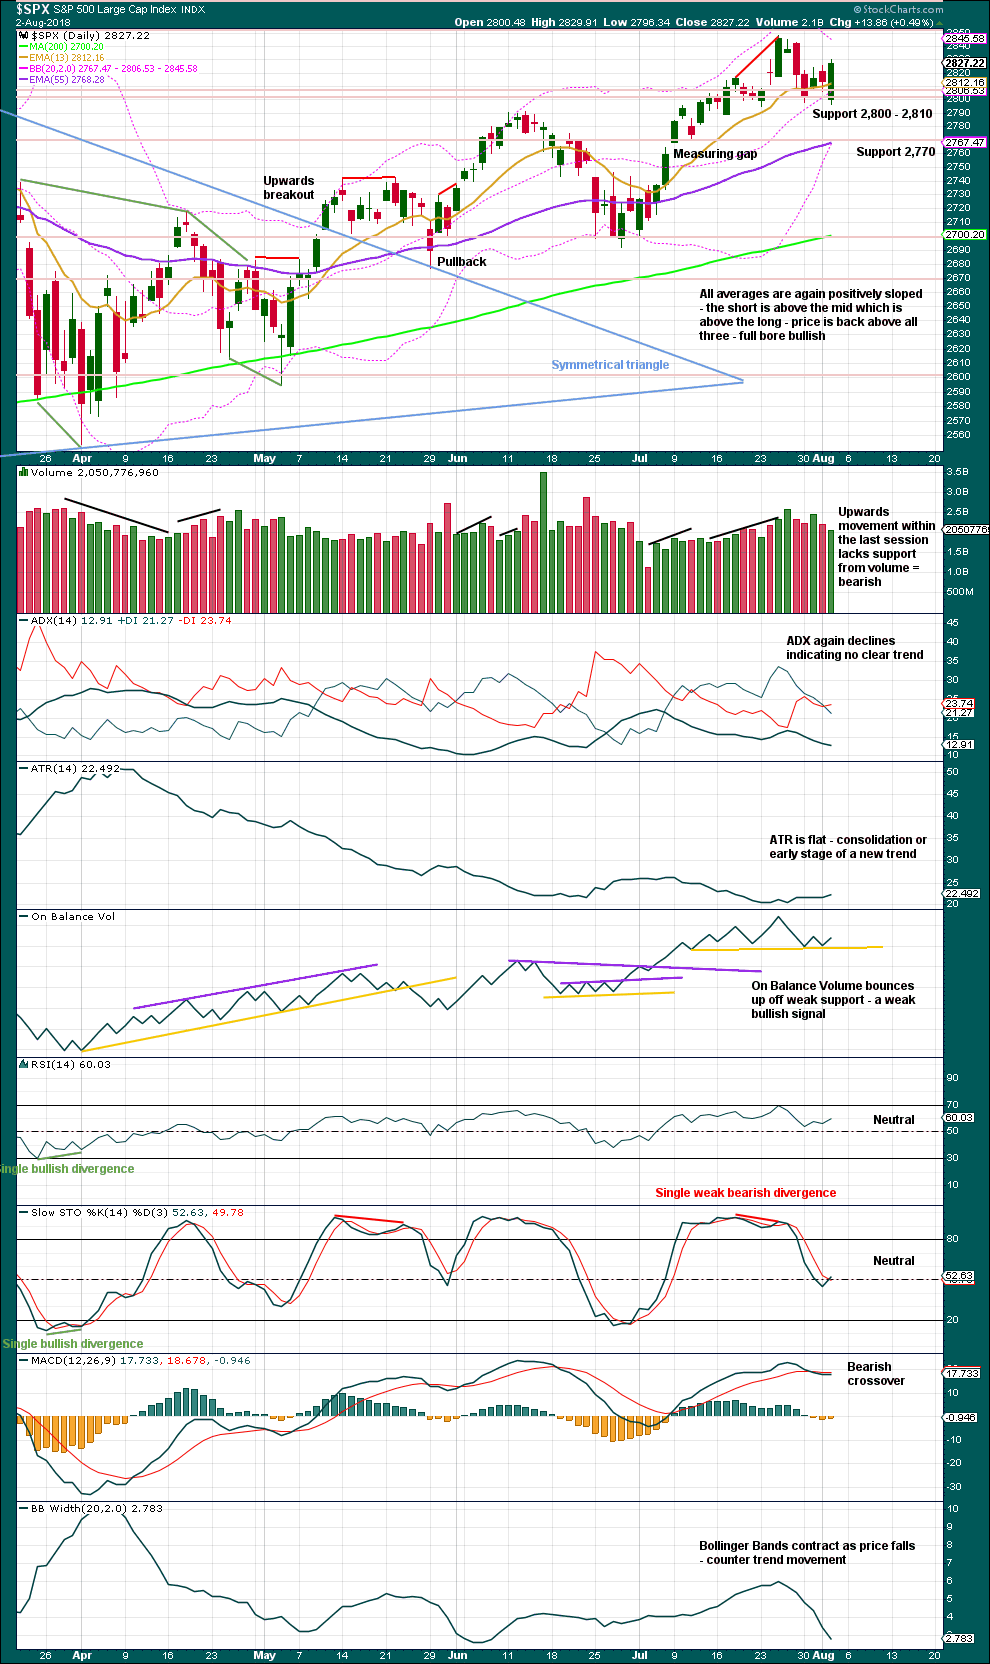
Click chart to enlarge. Chart courtesy of StockCharts.com.
The symmetrical triangle may now be complete. The base distance is 340.18. Added to the breakout point of 2,704.54 this gives a target at 3,044.72. This is above the Elliott wave target at 2,922, so the Elliott wave target may be inadequate.
Since the low on the 2nd of April, 2018, price has made a series of higher highs and higher lows. This is the definition of an upwards trend. But trends do not move in perfectly straight lines; there are pullbacks and bounces along the way.
This bull run now has some support from volume and strong support from On Balance Volume making new all time highs.
Upwards movement within this last session looks weak. This indicates it may be a B wave.
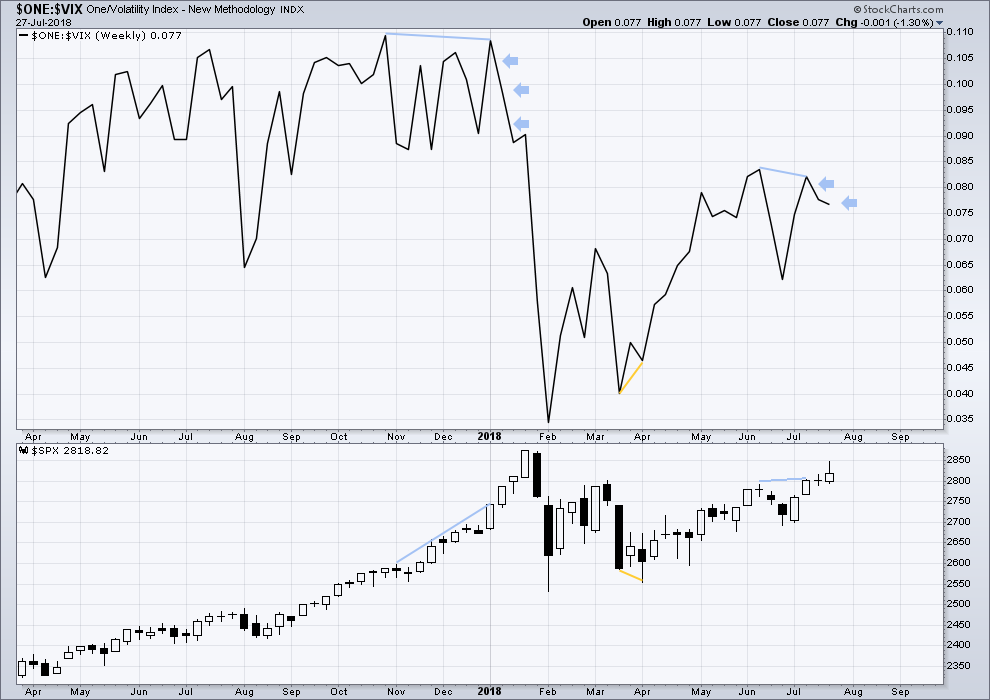
VOLATILITY – INVERTED VIX CHART
WEEKLY CHART
Click chart to enlarge. Chart courtesy of StockCharts.com. So that colour blind members are included, bearish signals
will be noted with blue and bullish signals with yellow.
To keep an eye on the all time high for inverted VIX a weekly chart is required at this time.
Notice how inverted VIX has very strong bearish signals four weeks in a row just before the start of the last large fall in price. At the weekly chart level, this indicator may be useful again in warning of the end of primary wave 3.
There is bearish divergence at this time between swing highs of inverted VIX and price, and now two weeks in a row of upwards movement from price and downwards movement from inverted VIX. This is now a reasonable warning of a possible pullback or consolidation, but it is not as strong a warning as that back in January. The last two weeks of upwards movement in price is not particularly strong (completing a Doji and a Shooting Star, not strong upwards candlesticks), so this divergence is not as significant.
DAILY CHART
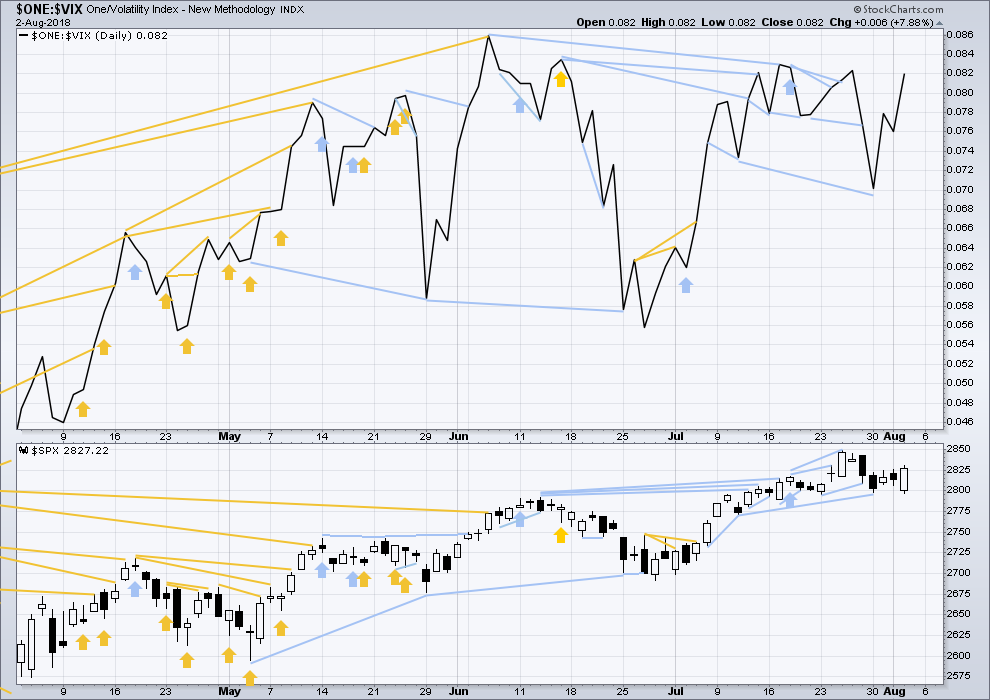
Click chart to enlarge. Chart courtesy of StockCharts.com. So that colour blind members are included, bearish signals
will be noted with blue and bullish signals with yellow.
Normally, volatility should decline as price moves higher and increase as price moves lower. This means that normally inverted VIX should move in the same direction as price.
Last noted mid term bearish divergence has not been followed yet by more downwards movement. It may still indicate downwards movement ahead as there is now a cluster of bearish signals from inverted VIX.
There is no new divergence today between price and inverted VIX.
BREADTH – AD LINE
WEEKLY CHART
Click chart to enlarge. Chart courtesy of StockCharts.com.
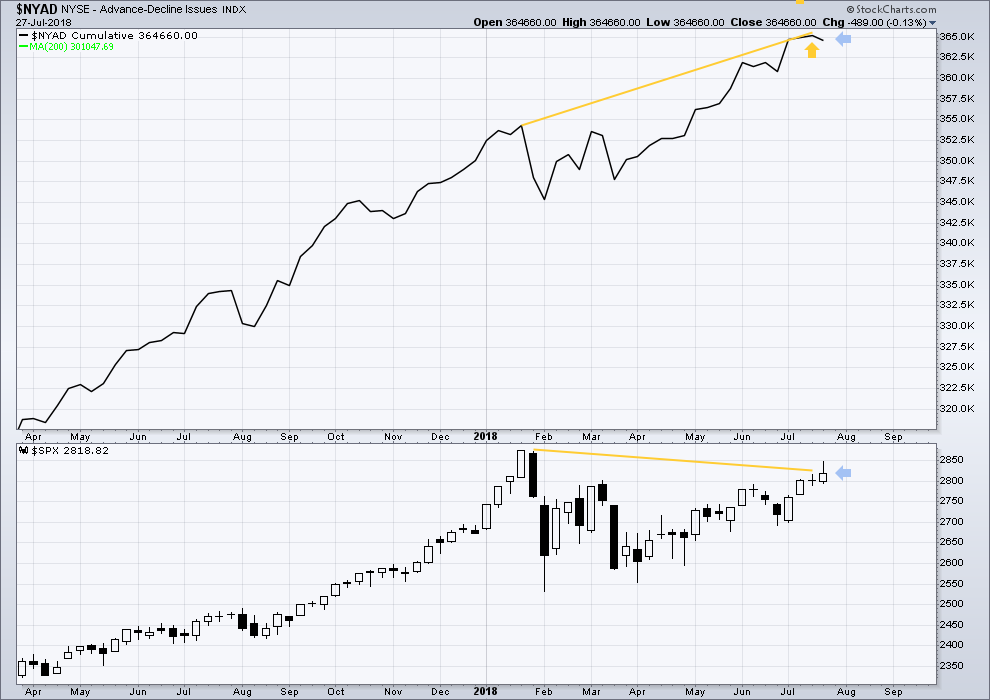
When primary wave 3 comes to an end, it may be valuable to watch the AD line at the weekly time frame as well as the daily.
At this stage, there is very strong bullish divergence between price and the AD line at the weekly time frame. With the AD line making new all time highs, expect price to follow through with new all time highs in coming weeks.
Price moved higher last week, but the AD line moved lower. This single week divergence is bearish for the short term.
DAILY CHART
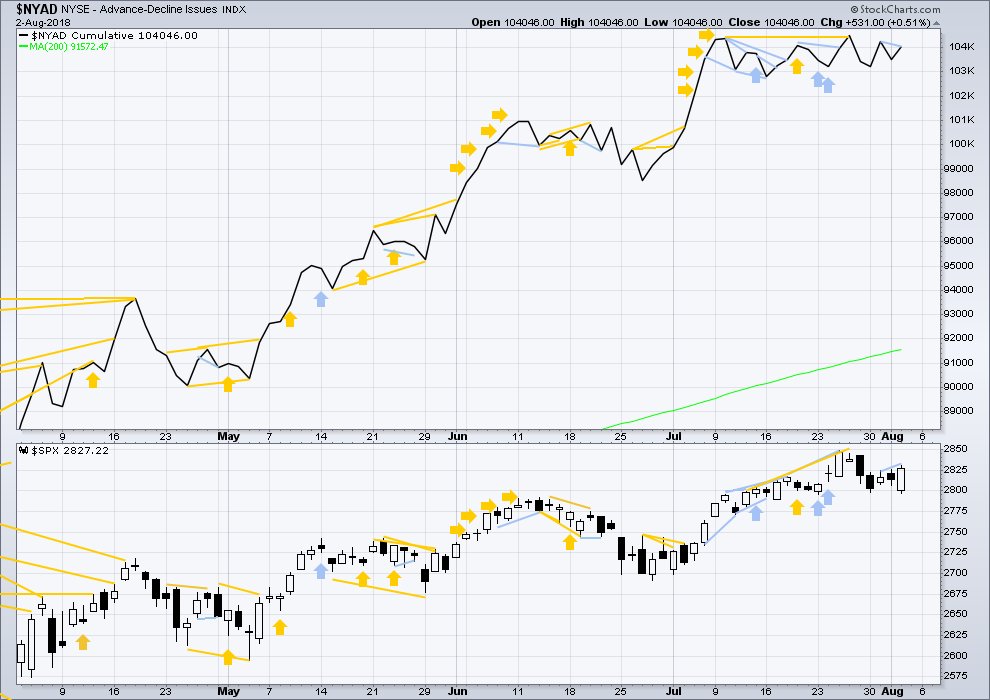
Click chart to enlarge. Chart courtesy of StockCharts.com.
There is normally 4-6 months divergence between price and market breadth prior to a full fledged bear market. This has been so for all major bear markets within the last 90 odd years. With no longer term divergence yet at this point, any decline in price should be expected to be a pullback within an ongoing bull market and not necessarily the start of a bear market. New all time highs from the AD line means that any bear market may now be an absolute minimum of 4 months away. It may of course be a lot longer than that. My next expectation for the end of this bull market may now be October 2019.
Breadth should be read as a leading indicator.
The last signal from the AD line was very bullish, with another new all time high last Thursday.
Price made a new high today, a little above the prior high two sessions ago, but the AD line did not. This is very short term and weak bearish divergence.
Small caps have made another slight new all time on Friday. Mid caps made a new all time high on the 10th of July. Only large caps have to follow through; they do usually lag in the latter stages of a bull market.
DOW THEORY
The following lows need to be exceeded for Dow Theory to confirm the end of the bull market and a change to a bear market:
DJIA: 23,360.29.
DJT: 9,806.79.
S&P500: 2,532.69.
Nasdaq: 6,630.67.
Only Nasdaq at this stage is making new all time highs, with another new all time high on Friday of last week. DJIA and DJT need to make new all time highs for the ongoing bull market to be confirmed.
Charts showing each prior major swing low used for Dow Theory may be seen at the end of this analysis here.
Published @ 10:58 p.m. EST.
AMTD is nicely set up and showing signs of resuming it’s higher tf up trends on the hourly.
I really like synthetic longs on it. Sept calls at 50 are going for only about 0.60 of premium ($7.60 with an underlying price of 57.18). That’s pretty cheap premium on such a bullish issue, IMO.
They sure know how to keep us waiting. Tapped 2840.42, just a tad higher than my indicator suggested. Let’s see how much of a fade we get into the close…
2837 continuing to be very formidable resistance for SPX….sixth attempt (15 min chart) underway…!
POW!
Ending with some nice strength… in price at least.
The daily SPX bar is now comfortable back on top of the 5 period EMA, and price has formed a very nice up channel at the daily tf. Price tagged and is moving up off the 21 period EMA. Strongly confirming bu-bu-bu-bullish indicators. My trend indicator is still neutral, and should go green on the next upward daily bar. 2-4 green bars up to 2920 would suit me fine next week!
once thru the 78%, more often than not the 127% target gets tagged eventually. 2861.6 here we come.
Gooooood morning everybody!
(you’ll just have to imagine the voice)
I’m going to be very curious as to whether or not volume supports today’s upwards movement. And if we have a new high from the AD line or On Balance Volume.
Any signs of strength here and I’ll expect minute iv would most likely be over.
Weakness, and it continues.
Sleepless in New Zealand…
Yeah. Insomnia sucks.
I tried melatonin (thanks to a lovely member who helped there) but so sad, it gave me a rash all over my face and neck. Which no woman wants!
It did make me sleep really well though, so yeah, super sad about that.
Trying 5HTP… but it’s just not as good. Obvs, bcos I’m up at 4am!
Are you getting daily exercise? even a walk of just a mile a day, if done consistently, is extremely beneficial overall including better sleep.
apart from surf (which I do as much as possible) not so much exercise TBH
I find it boring
yeah, I know I should do it more often
but even if I have a massive surf session, like over 3 hrs, I still can have insomnia.
*edit to add: I know you’re right Kevin. I’ll try harder, really will, to walk. I don’t mind walking so much.
single shot doesn’t do it. Daily. It’s only 20 minutes to do a mile walk. It’s worth it Lara…and the weight of the evidence is that you’ll have positive results within 2-3 weeks.
I have a dog, which helps motivate me to “go do it”. Sitting trading for most of 6 hours a day motivates, too, lol!!
agree, cliches do hold wisdom: “move it or lose it”
the only things that keep me sane are weightlifting, swimming, and yoga….. if I stop, the quality of my sleep and life in general decline
I have it bad these days too, Lara, so I feel your pain. Melatonin is no help to me, and I refuse to risk more powerful sleep aids.
What a wonderful gift deep sleep is! It’s so easy to take for granted until it flees away.
*chases the sleep goblin about the room*
it’s fleeing!
Howwwwdy! Such a pleasant surprise! Lotsa coffee? 😀
Only uno cafe
Up against resistance at 2836 for the third time today…will this one be the charm?
I like how SPX’s little pullback exactly tagged and turned on the .618 at 2829. Fibo magic, and a strong confirmation of continued bull mode for the time being. Will there be a C wave down, or is the v up started? I think it’s the latter, myself. But staying nimble.
What I’m thinking is that even if minute v has started, there should be a subminuette ii lurking around the corner soon…
Indeed. And when it kicks in, deciding if it’s C down vs. a minuette ii down will be the question.
Overall, this push up just looks too strong to me to be a B wave. But I like Lara’s criteria; guilty of being a B wave until sufficient evidence lets its off the hook.
LOL
I like that. “Guilty of being a B wave… ”
Guilty until proven innocent.
Volatility on sale!! 🙂
Amazing isn’t it?
Re-loaded Sept. 12 calls, took me a while to get executed…..(not trading advice)
Same here. I make one trade, and my inbox has ten alerts due the trade getting executed in batches. Anemic liquidity!
Shooting star on 5 min. I don’t think we are going to make it to 2840. We should get a C down into the close. Buckle up! 🙂
Selling half SPY calls…waiting for tag of 2840 to cash in remaining. Things unfolding pretty much as expected… 🙂
is it time to buy some UVXY Verne???
Loaded to the gills! 😀 😀
SPX should tag 2840 before a turn….
SPX has cleared the 61.8% retrace. Next resistance areas:
78% at 2737.4.
100% at 2748.
127% at 2761.7
this…
78% at 2837.4.
100% at 2848.
127% at 2861.7???
Clearly… 🙂
Oh, I consistently dropped 100 points from those numbers didn’t I!!! Arrrgggh. Well…the chart is correct. I hope because it’s Friday I get a pass.
He!he! “You…..shall…not….PASS!!!!!”
G.
Someone said they took some NUGT yesterday? I took some this morning too. /GC daily looking like a double bottom on top of a significant 1.272 (derived) fibo extension. Maaaaaybe the gold sell off is over, for at least a bit. (I know lots of pundits have been run over the last few months making that statement, lol!!)
Yeah, gold was getting no support from data. A few tidbits on the higher trade loss , lower employment numbers (albeit lower unemployment as well) and lower ISM numbers. This coupled with the COTs being at a level around the same as the Jan 2016 rise may put a little fire under this market. Would have liked to see $BPGDM on stockcharts.com get a little lower though (at about 40 percent now…was down near zero before 2015/16 launch). Always a gamble but I think there are a few things lining up that could give this some giddy up.
Given the constant headfakes…I bought a little NUGT this morning and already cashed my little profit. I’ll go for longer holds if and as gold shows me it’s changed trend _really_.
A friend of mine bought $250k of NUGT yesterday, sold today for +$12k. That’s some sick riverboat gamblin’ right there!
Way too much for that instrument. If he wanted to own the shares a longer dated naked put would have been a better trade. Wow!
The brutal final Gold smackdown I was expecting finally arrived. They do this every single time ahead of an important bottom. Too bad your friend did not know this. He apparently did not have a stop loss in place. All he had to do was hang onto the shares for a few weeks to recoup most if not all of his money.
Starting this week, I am selling weekly put credit spreads against GDX for safe income going two weeks out. 20/21 spreads for August 17 will bring 0.18 per contract.
I would be willing to take assignment of shares and sell covered calls.
This is a good strategy for Gold in an uptrend.
Kramer stated that gold might be a good buy here a few days back with commercials becoming less short and adding to longs. I can remember a time he became positive on gold a few years back and it was a gold market top. I’m hoping his call is better now but …..
https://www.cftc.gov/dea/options/deacmxsof.htm
Gold commercials continue to get rid of their shorts. Longs were taken down too but the overall commercial position is pretty close to net nuetral. Interesting. Commercials took off 55K options and contracts combined. That is a pretty big reduction from the short side. They also took off 37 K from the long side. Net about 18K was taken off the short side, still a big number. Specs are net long about 6 K on silver and 20 K on gold. To put in perspective before the 250 dollar runup from 1100 to 1350 in early 2016 we had specs net long 20 k silver and 10 k gold. If past is prologue……
China just played spoiler for bills with threat on tariffs…let’s see how this plays out …. interesting enough today happens to be the turn day for many stocks and indexes..ramp over the last few days might be done..
It would seem that despite the futures ramp, VIX is letting the cat out of the bag, so to speak…! Hoping to cash in calls early. Happy Trading! 🙂
Sep. E-Mini equivalent minute [iv] has overlapped minute [i].
May give more weight to alt.hourly or minuette (iv) occurring rather than minute [iv].
they’re different markets, so will have different wave counts
Between Lara’s hourly models and price stalling out here right at the 61.8% (2829) will have me looking for sell triggers right out of the chute tomorrow.
$DXY monthly. I’m going to be taking advantage of this market on the long side going forward. Note the strong tendency of this market to trend; it’s a beautiful thing! The white lines are symmetric projections: almost all of the recent upswings have been significantly longer that what’s transpired so far. I think 97.9 (62%) is extremely likely, and 100.5 (78%) quite possible.
The weekly is set up well with a long squeeze still in play. Note the price explosion out of the prior long period squeeze (April). Wow. We can only hope eh?
You will have to be quite nimble long $DXY..! 😉
As I didn’t bother to say…I’ll be using options on UUP as my weapon of choice. Joker.
The first hourly wave counts meshes beautifully with the current level of open interest in SPY at, or in the money options expiring tomorrow. I figured we would see some serious whiplash and a move up to complete minuette b would be the perfect hook to bring some more bullish traders on board, followed by a the C wave down to take all those option contracts OUT of the money into the close. That would be an awesome entry for the rocket up to complete minor three next week. Thanks Lara! Once again putting viable wave counts to my wild musings! 🙂
You’re welcome!
And thanks also to Kevin for sharing your charts