For the very short term, for Friday’s session, a pullback to about 2,828 was expected. A pullback did unfold but was deeper than expected, reaching 2,808.
Summary: Look out for some consolidation next week before the resumption of the upwards trend.
The bigger picture remains extremely bullish. But short term bearish divergence between price and the AD line, along with a Shooting Star candlestick pattern, provide a strong warning here for a pullback or consolidation that may have begun on Friday and may continue next week.
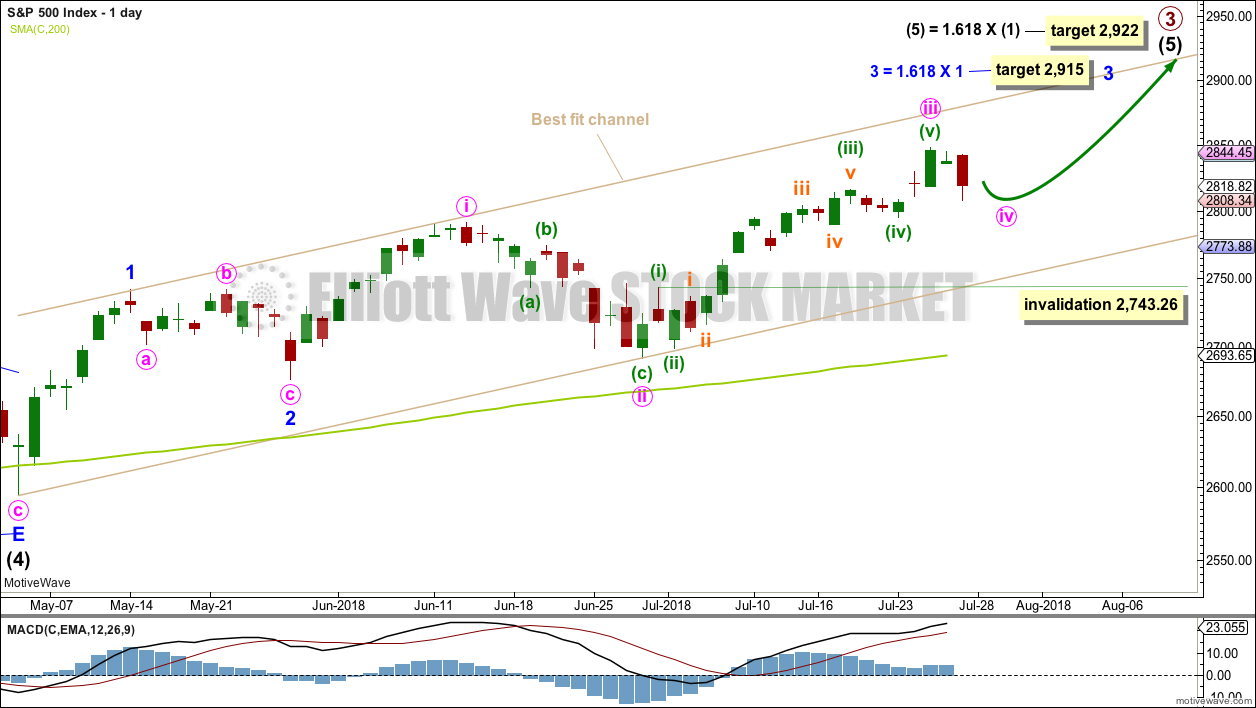
The next target is about 2,915, where another consolidation to last about two weeks may be expected.
The invalidation point remains at 2,743.26.
The mid to longer term target is at 2,922 (Elliott wave) or 3,045 (classic analysis). Another multi week to multi month correction is expected at one of these targets.
The final target for this bull market to end remains at 3,616.
Always practice good risk management. Always trade with stops and invest only 1-5% of equity on any one trade.
New updates to this analysis are in bold.
The biggest picture, Grand Super Cycle analysis, is here.
Last historic analysis with monthly charts is here, video is here.
ELLIOTT WAVE COUNT
WEEKLY CHART
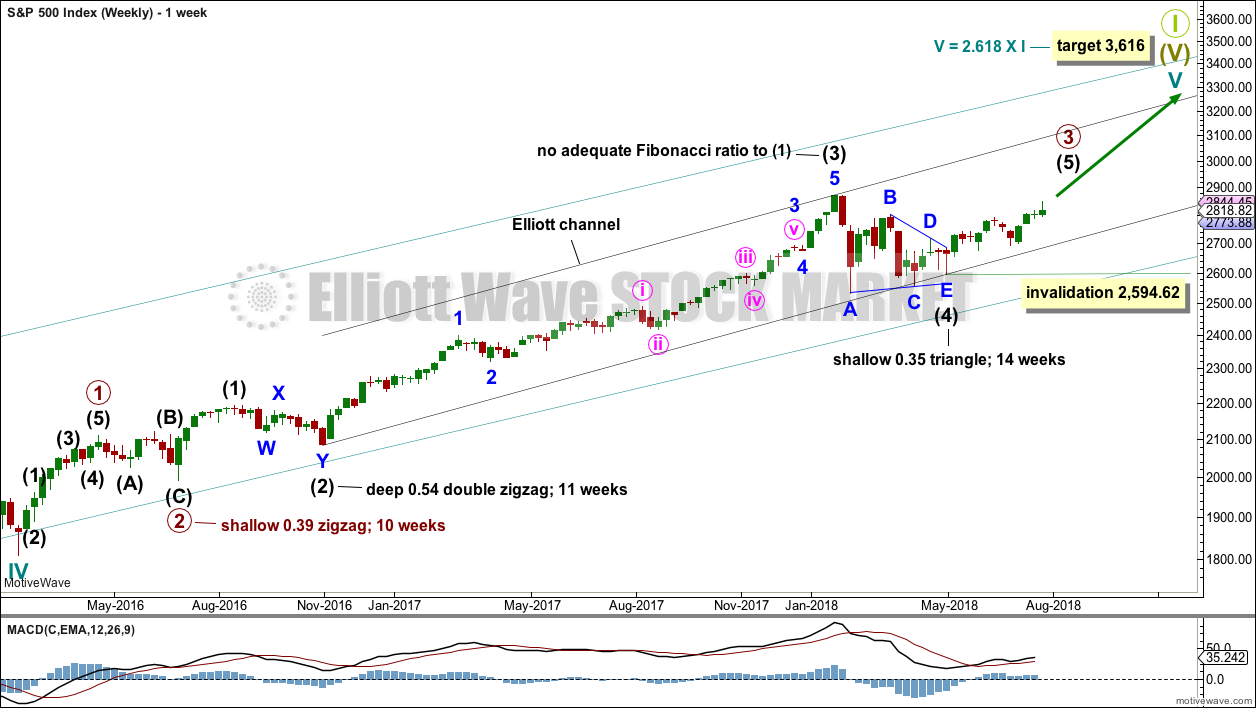
Cycle wave V must complete as a five structure, which should look clear at the weekly chart level and also now at the monthly chart level. It may only be an impulse or ending diagonal. At this stage, it is clear it is an impulse.
Within cycle wave V, the third waves at all degrees may only subdivide as impulses.
Intermediate wave (4) has breached an Elliott channel drawn using Elliott’s first technique. The channel is redrawn using Elliott’s second technique: the first trend line from the ends of intermediate waves (2) to (4), then a parallel copy on the end of intermediate wave (3). Intermediate wave (5) may end either midway within the channel, or about the upper edge.
Intermediate wave (4) may now be a complete regular contracting triangle lasting fourteen weeks, one longer than a Fibonacci thirteen. There is perfect alternation and excellent proportion between intermediate waves (2) and (4).
Within intermediate wave (5), no second wave correction may move beyond the start of its first wave below 2,594.62. However, the lower edge of the black Elliott channel drawn across the ends of intermediate degree waves should provide very strong support for any deeper pullbacks, holding price well above the invalidation point while intermediate wave (5) unfolds.
At this stage, the expectation is for the final target to me met in October 2019.
A multi week to multi month consolidation for primary wave 4 is expected on the way up to the final target.
The last bullish fifth wave of minor wave 5 to end intermediate wave (3) exhibited commodity like behaviour. It was strong and sustained. It is possible that the upcoming wave of minor wave 5 to end intermediate wave (5) to end primary wave 3 may exhibit similar behaviour, so we should be on the lookout for this possibility.
DAILY CHART
Intermediate wave (5) would be very likely to make at least a slight new high above the end of intermediate wave (3) at 2,872.87 to avoid a truncation.
Intermediate wave (3) exhibits no Fibonacci ratio to intermediate wave (1). It is more likely then that intermediate wave (5) may exhibit a Fibonacci ratio to either of intermediate waves (1) or (3). The most common Fibonacci ratio would be equality in length with intermediate wave (1), but in this instance that would expect a truncation. The next common Fibonacci ratio is used to calculate a target for intermediate wave (5) to end.
It is possible that minute wave iii could be over at this week’s high; if it is complete here, it would not exhibit a Fibonacci ratio to minute wave i. If minute wave iv unfolds next week, then it must be very shallow to remain above minute wave i price territory at 2,791.47.
It is also possible that only minuette wave (iii) within minute wave iii was over at this week’s high, but this idea has less support at the end of this week from classic technical analysis. If minuette wave (iv) continues next week, then it may not move into minuette wave (i) price territory below 2,743.26.
A target is calculated for minor wave 3 to end, which expects to see the most common Fibonacci ratio to minor wave 1. Minor wave 3 may last several weeks in total and should look like an impulse at the daily chart level. When it is complete, then minor wave 4 may last about one to two weeks in order for it to exhibit reasonable proportion to minor wave 2. Minor wave 4 must remain above minor wave 1 price territory.
A best fit channel is added in taupe to this chart. It contains all of intermediate wave (5) so far. The lower edge may provide support for any deeper pullbacks. The upper edge may provide resistance.
MAIN HOURLY CHART
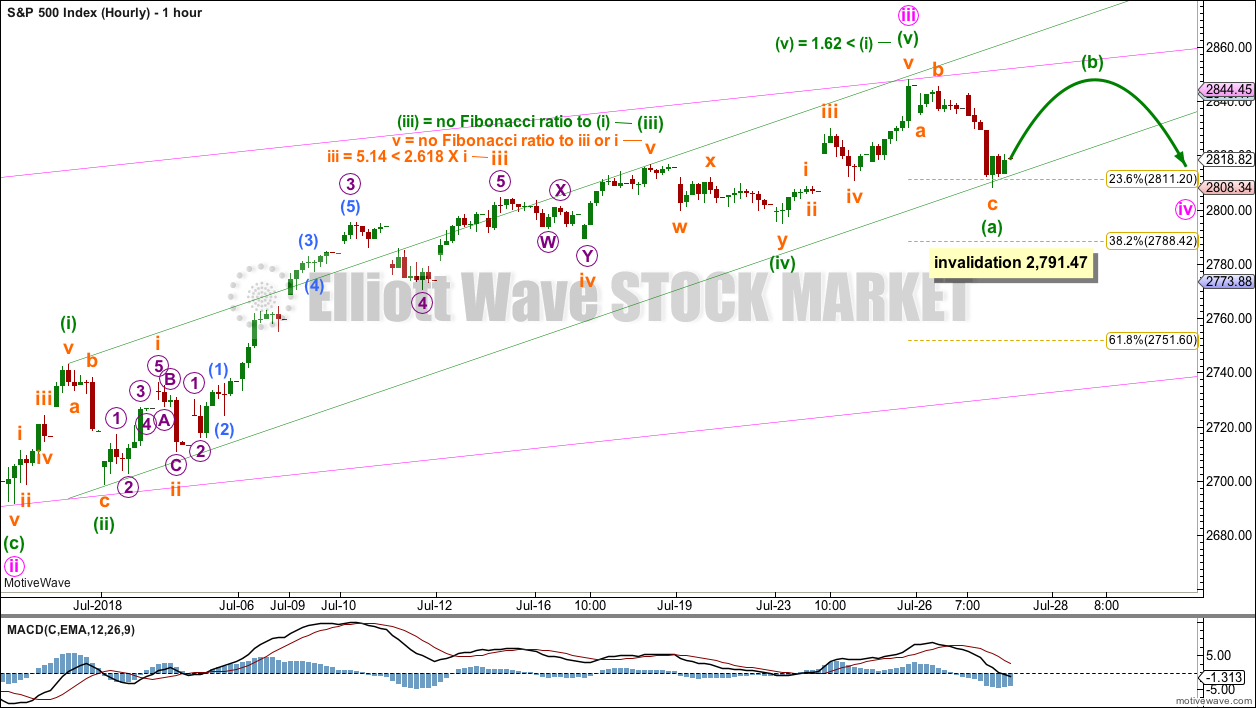
Both hourly charts show all of minute wave iii from its start at 2,691.99 on the 28th of June.
This is the main hourly chart because it expects a shallow consolidation to continue next week. This idea has support from a Shooting Star candlestick pattern and bearish divergence between price and the AD line.
If minute wave iii was over at the last high, then there are reasonable Fibonacci ratios within it.
Minute wave ii was a very deep 0.87 single zigzag lasting 11 sessions. Minute wave iv may be a very shallow sideways type of correction: a flat, combination or triangle. These would exhibit alternation with minute wave ii.
All of a flat, combination or triangle may include a new high above the start of minute wave iv at 2,848.03, as in an expanded flat, running triangle or wave X of a combination. There is no upper invalidation point for this reason.
Minute wave iv may not move into minute wave i price territory below 2,791.47.
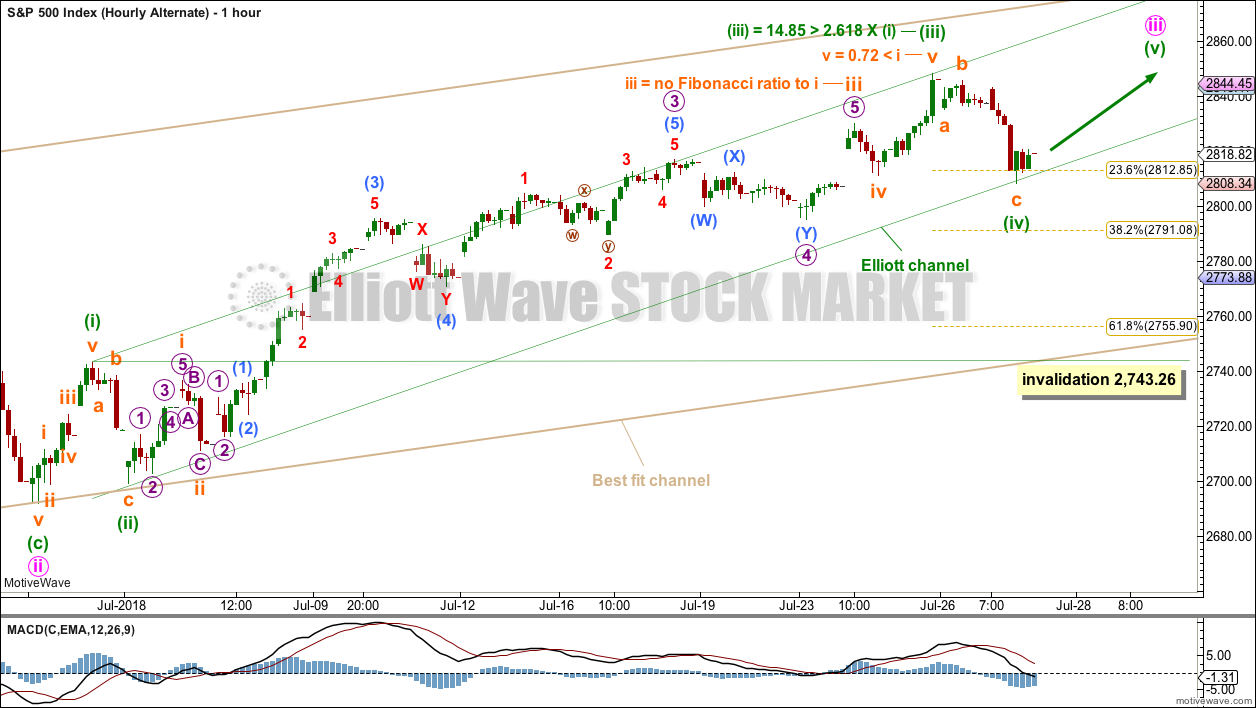
ALTERNATE HOURLY CHART
It is also possible that only minuette wave (iii) was over at the last high and that minute wave iii may be incomplete. This would allow minute wave iii to move further away from the high of minute wave i at 2,791.47, which would then allow more room for minute wave iv to unfold and remain above first wave price territory.
The Fibonacci ratios for this alternate are not quite as good as the main wave count.
Minuette wave (iv) for this wave count may be over at Friday’s low, finding support almost right on the lower edge of the green Elliott channel.
If it continues further, minuette wave (iv) may not move into minuette wave (i) price territory below 2,743.26.
If price moves below 2,791.47 early next week, then the main hourly wave count would be invalidated. That would leave only this alternate wave count valid, which is more bullish, but allows for more downwards movement and a deeper pullback prior to new highs.
TECHNICAL ANALYSIS
WEEKLY CHART
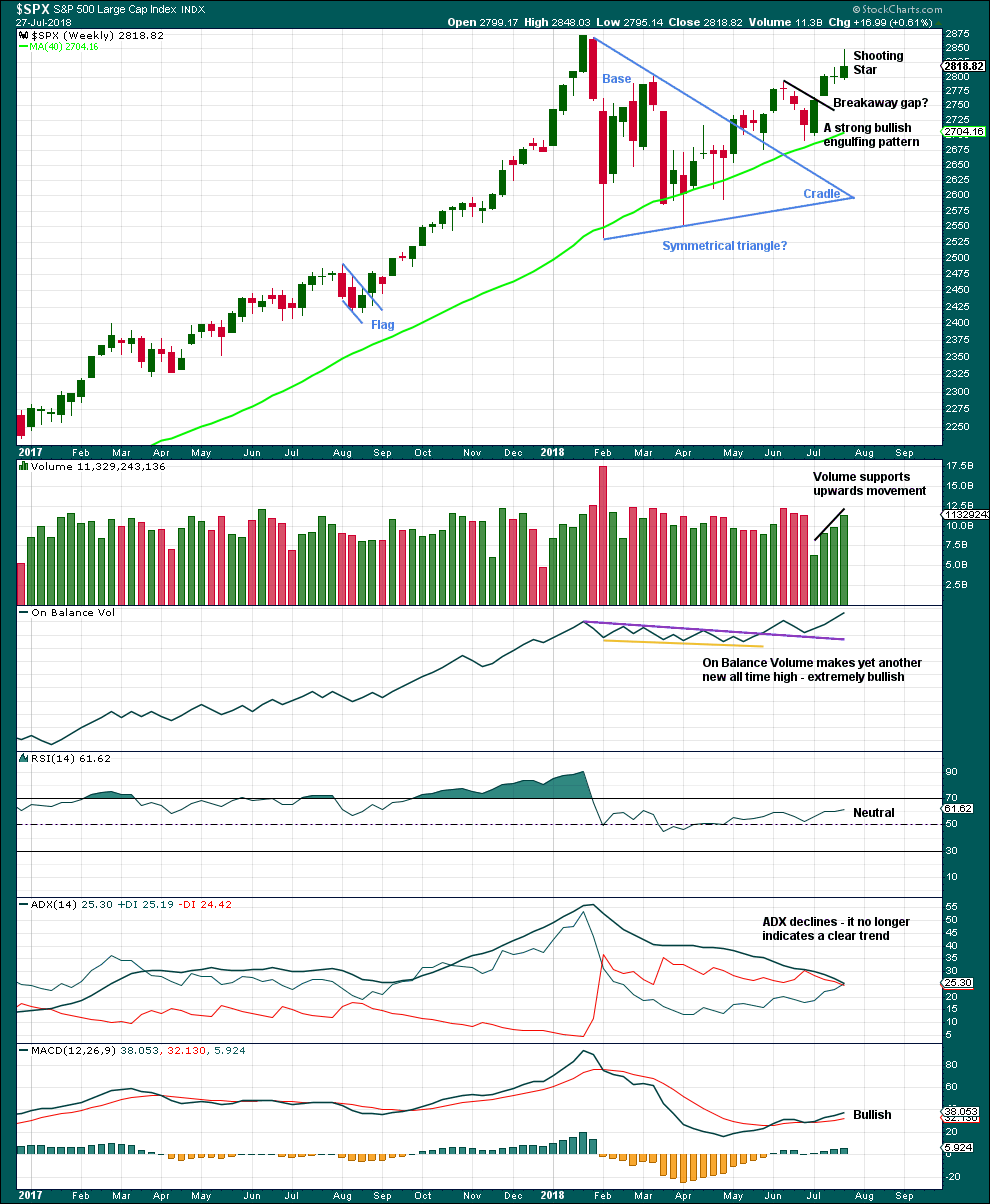
Click chart to enlarge. Chart courtesy of StockCharts.com.
Recent new highs for On Balance Volume remains very bullish indeed, but that does not preclude another reasonable pullback within this developing upwards trend. It is still expected that price is very likely to make new all time highs, but it will not move in a straight line.
A Doji candlestick followed now by a Shooting Star, which did not gap higher, is reasonably bearish for the short term. A pullback or small consolidation may result.
Bullish volume and another new all time high from On Balance Volume are very strong bullish signals.
DAILY CHART
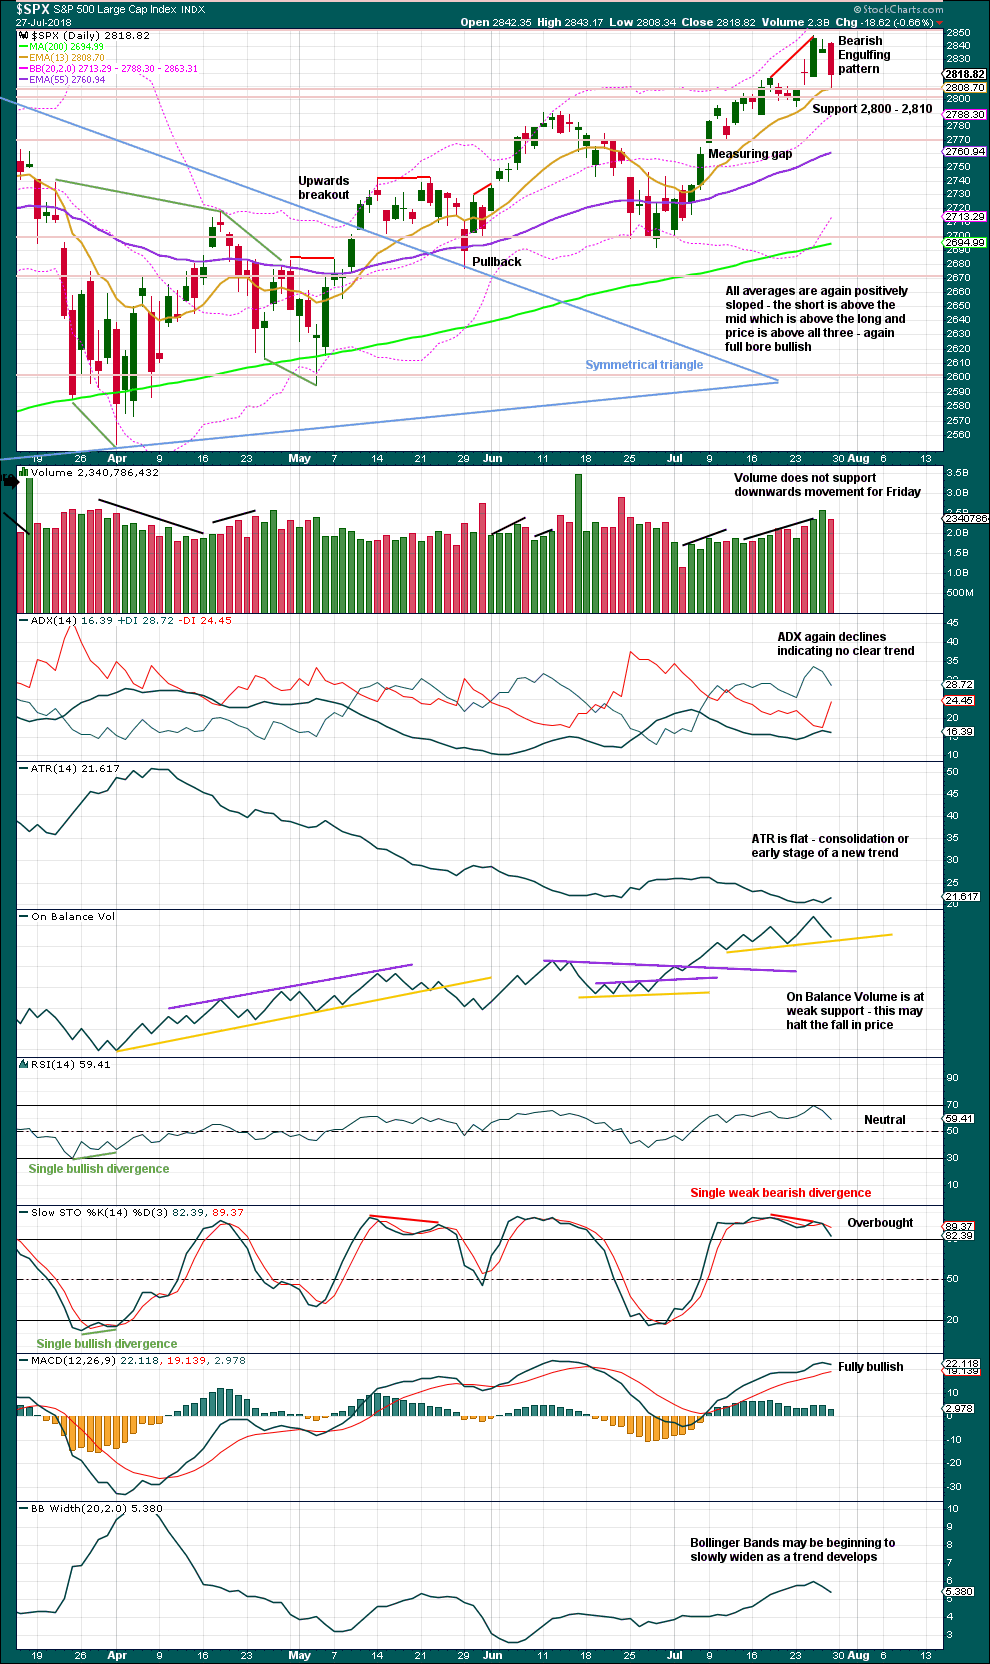
Click chart to enlarge. Chart courtesy of StockCharts.com.
The symmetrical triangle may now be complete. The base distance is 340.18. Added to the breakout point of 2,704.54 this gives a target at 3,044.72. This is above the Elliott wave target at 2,922, so the Elliott wave target may be inadequate.
Since the low on the 2nd of April, 2018, price has made a series of higher highs and higher lows. This is the definition of an upwards trend. But trends do not move in perfectly straight lines; there are pullbacks and bounces along the way.
Stochastics may remain overbought for reasonable periods of time when this market has a strong bull run.
This bull run now has some support from volume and strong support from On Balance Volume making new all time highs.
RSI is almost overbought, and it can remain there for long periods of time for this market.
For the very short term, Thursday’s candlestick may be a Gravestone Doji, which is a bearish reversal pattern. This is now followed by a Bearish Engulfing reversal pattern for Friday. These together are a strong warning that a consolidation or pullback may develop here.
Look for the first strong support at about 2,800 to 2,810. Next strong support below that is about 2,765.
VOLATILITY – INVERTED VIX CHART
WEEKLY CHART
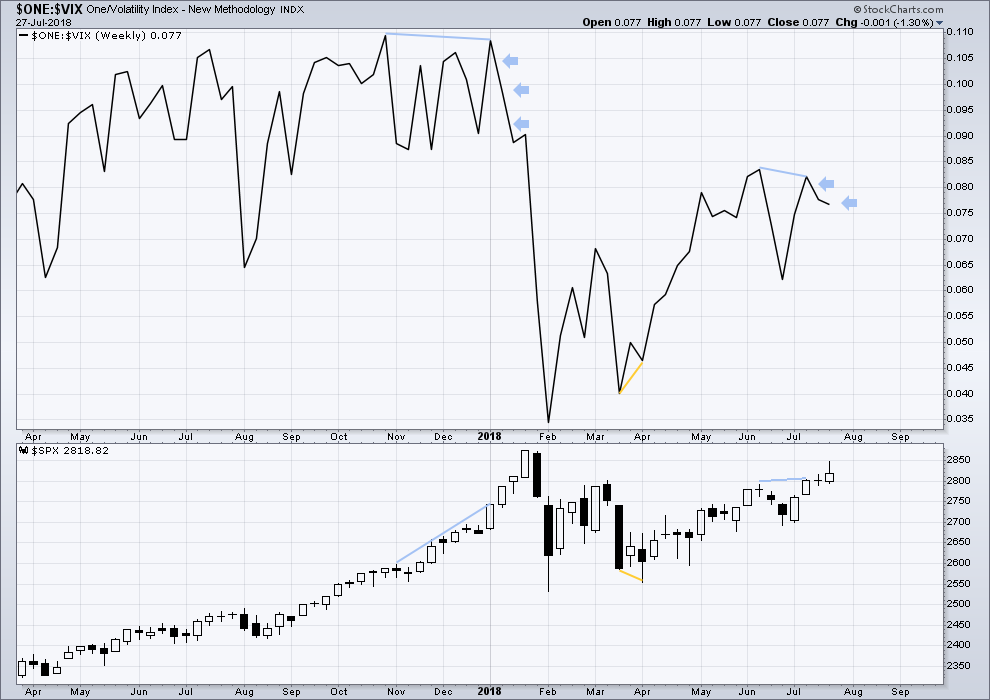
Click chart to enlarge. Chart courtesy of StockCharts.com. So that colour blind members are included, bearish signals
will be noted with blue and bullish signals with yellow.
To keep an eye on the all time high for inverted VIX a weekly chart is required at this time.
Notice how inverted VIX has very strong bearish signals four weeks in a row just before the start of the last large fall in price. At the weekly chart level, this indicator may be useful again in warning of the end of primary wave 3.
There is bearish divergence at this time between swing highs of inverted VIX and price, and now two weeks in a row of upwards movement from price and downwards movement from inverted VIX. This is now a reasonable warning of a possible pullback or consolidation, but it is not as strong a warning as that back in January. The last two weeks of upwards movement in price is not particularly strong (completing a Doji and a Shooting Star, not strong upwards candlesticks), so this divergence is not as significant.
DAILY CHART
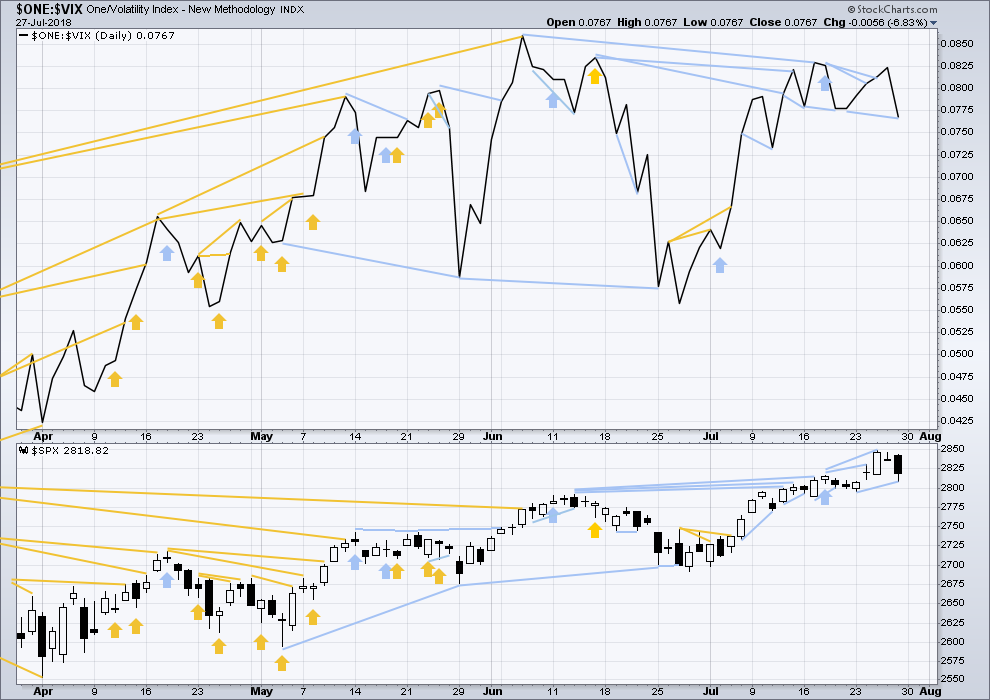
Click chart to enlarge. Chart courtesy of StockCharts.com. So that colour blind members are included, bearish signals
will be noted with blue and bullish signals with yellow.
Normally, volatility should decline as price moves higher and increase as price moves lower. This means that normally inverted VIX should move in the same direction as price.
There is new short term bearish divergence today between price and inverted VIX: inverted VIX has made a new low below its prior swing low six sessions ago, but price has not made a corresponding new low.
There is now a cluster of bearish signals from inverted VIX.
BREADTH – AD LINE
WEEKLY CHART
Click chart to enlarge. Chart courtesy of StockCharts.com.
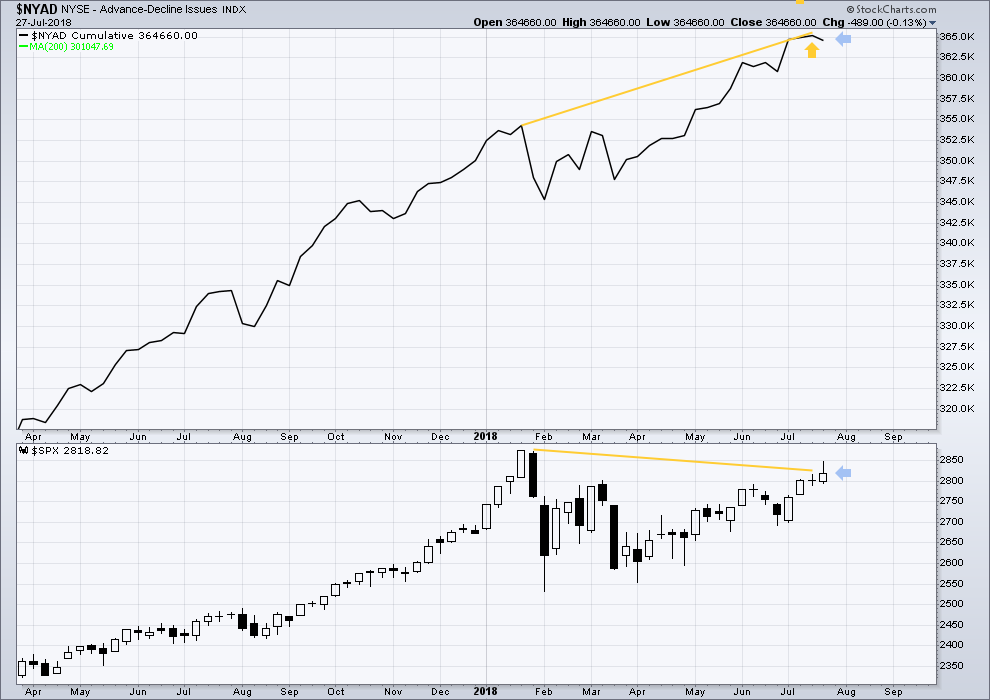
When primary wave 3 comes to an end, it may be valuable to watch the AD line at the weekly time frame as well as the daily.
At this stage, there is very strong bullish divergence between price and the AD line at the weekly time frame. With the AD line making new all time highs, expect price to follow through with new all time highs in coming weeks.
Price moved higher this week, but the AD line moved lower. This single week divergence is bearish for the short term.
DAILY CHART
Click chart to enlarge. Chart courtesy of StockCharts.com.
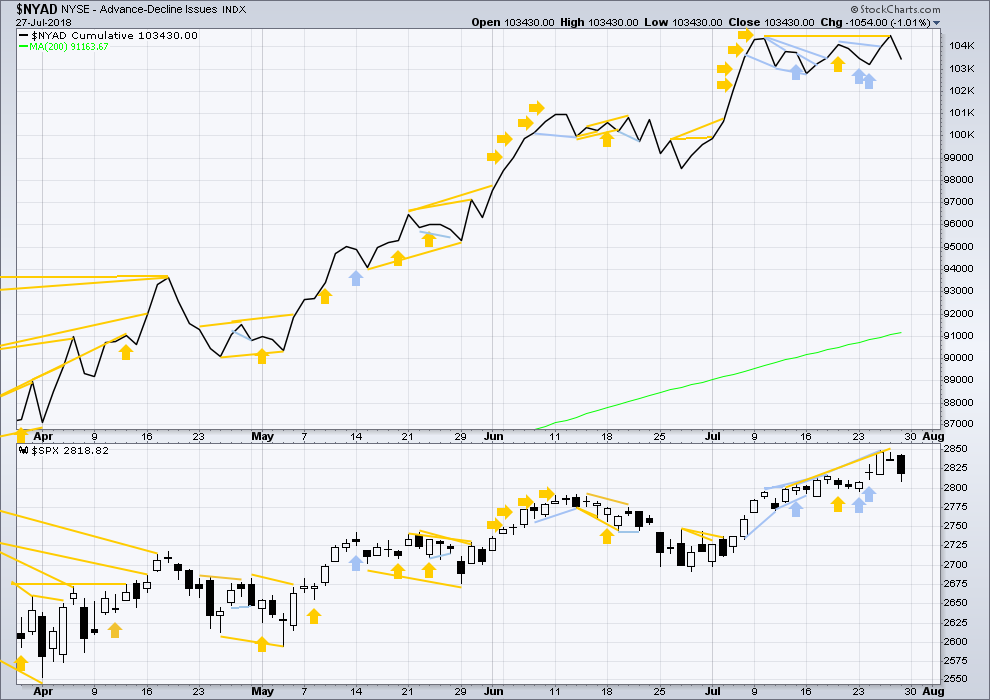
There is normally 4-6 months divergence between price and market breadth prior to a full fledged bear market. This has been so for all major bear markets within the last 90 odd years. With no longer term divergence yet at this point, any decline in price should be expected to be a pullback within an ongoing bull market and not necessarily the start of a bear market. New all time highs from the AD line means that any bear market may now be an absolute minimum of 4 months away. It may of course be a lot longer than that. My next expectation for the end of this bull market may now be October 2019.
Breadth should be read as a leading indicator.
A new all time high from the AD line on Thursday remains very bullish. For the short term, there is no bearish divergence between price and the AD line at the daily chart time frame.
Small caps have made another slight new all time on Friday. Mid caps made a new all time high on the 10th of July. Only large caps have to follow through; they do usually lag in the latter stages of a bull market.
DOW THEORY
The following lows need to be exceeded for Dow Theory to confirm the end of the bull market and a change to a bear market:
DJIA: 23,360.29.
DJT: 9,806.79.
S&P500: 2,532.69.
Nasdaq: 6,630.67.
Only Nasdaq at this stage is making new all time highs, with another new all time high on Friday of last week. DJIA and DJT need to make new all time highs for the ongoing bull market to be confirmed.
Charts showing each prior major swing low used for Dow Theory may be seen at the end of this analysis here.
Published @ 03:54 a.m. EST on 28th July, 2018.

updated hourly chart
I’m going to label this correction minute iv, while it remains above minute i price territory, because it’s broken out of the channel containing minute iii
it now looks like it may be a close to complete double zigzag
and there’s very little room for it to move into now
Feels like there will be one more quick dip below 2800, probably tomorrow morning. Eyeing that 2790 cluster of Fibs and support…
Not likely. If we break this pivot (in ES), we are going much lower.
Have a great evening all!
VIX raising a caution flag on this presumed reversal. That candle says we might not be quite done….
Pretty clear they are NOT giving up 2800…!
PANW has been an extremely strong tech stock for several years, is in an excellent pullback, has touched the 23.6% @ 193.4, and while there could be more, there may not be if this overall iv wave is short lived. I am watching for hourly polarity inversion now.
Buying SPY Aug 3 280 strike calls for 0.90.
Selling SPY 276/278 bull put credit spread expiring same date for 0.25…hard stop on close undet 279.5….
I think only a final v down is needed on the hourly to complete a 5 wave A down.
I still expect 2789 for that. But then a B up and C down would be coming…and that C down could to 2742 or the 2720 area, seems to me.
That could raise some glaring issues of proportionality imho…
There are conflicting market signals. Recent market highs at steep negative divergences, and flagging action after the impulsive declines would suggest the move down is incomplete. My own personal pivot indicator says when the prior contested pivot is not cleanly taken out in the FIRST impulse down the trend change is NOT confirmed. I’m out. As long as 2800 holds, the bears are going nowhere….
The volume profile for SPY. The next “node” (peak) down is 279. The a giant valley that I really don’t expect price to even attempt to cross to get to the “gravity point” at 272. Note that just above is a bit of a valley too: don’t expect price going up to linger around 282-283, it should zoom right by to high prices/higher volume areas.
Bulls holding onto 2800 pivot. Time for the bears to retreat as this correction is done.
Exiting remaining short trades.
Selling another 1/4 of DIA 255 puts, holding TZA calls and remaining UVXY calls as well.
This wide and broad clipping of the vastly over inflated valuations of the FAANGM (and TWTR, and the payment processors V/MA/PYPL/SQ) stocks without crushing the overall market is, IMO, very healthy for the market. The market can’t go up without those stocks at least going sideways if not up, and they were far too overextended to keep moving. So we should come out of this little correction in much better shape I think. There’s also continued general downward movement in bonds and strong action in finance, so I’d say everything is looking more rosy than even 2 weeks ago. And all those names I just mentioned are likely to set up well for longs soon. I have next to zero concern about sell offs coming outside the scope of Lara’s main count. All this action is a minor correction, and a bit larger correction of the vastly overextended issues. Healthy!
Think big picture people. The facebook implosion triggered a slew of margin calls for leveraged positions. Profitable positions, including FAANG stocks not yet imploding, are going to be sold.
All the payment processors that have been so incredible hot (V, MA, SQ, PYPL) are selling off fairly strongly. Should be good set ups for longs coming on some of these.
If SPX surrenders the 2800 pivot on a closing basis we will likely revisit 2750.
It has to break 2789 (the 38% retrace) first, and if it gets there, I think it likely holds. But who nose.
Merely looking at fib retracements is not always reliable. They know traders are watching those levels.
You get much more reliable insight by watching the contested price levels, and 2800 is a big one. If they loose it, price goes to the next contested area. Just my two pennies… 🙂
There are 3-4 significant price pivots right in the area of 2789. It is a “contested area”, and the volume profile for SPY shows it is more contested in fact than 2750 area. While there’s a bit of a volume spike at 2750…once below 2789, the REAL contested area and where price I would expect to end up is 2720. Yes, you do have to look deeper.
Well, looks like it’s gonna be one of those day. Very muted action save for NDX. Will be watching these next few days for an SPX bottom/reversal around 2790.
I agree with that likely bottom/turn zone Bo. A 38% fibo there and a bunch of pivots.
A turn and buy triggers on FB at 164 might be good, that’s the 78.6% retrace of the March-July up swing. I might try that; the (derived) fibo bounce provides an excellent super tight risk management point.
Today seems to be all about oil and finance (under which are rising rates/falling bonds). Tech is getting rotated out of big time. Mixed market -> iv wave overall.
So far, the SPX trend line continues to hold. Will be interesting to see if that lasts. If price were to break it and drop to the next trend line down, it would at this moment be around 2745. Yikes.
Interested in short setup? BA daily. Tagged the 78.6% with a bearish reversal candle.
Although that is a classic cup and handle pattern on your BA
Noted Fred. While this is set up…there’s no real sell trigger yet, and the market may not cooperate on the short side. And XLI has been relatively strong. So we’ll see.
I got on board short via puts. I had to go with a lower delta than I prefer in order to get decent spreads. In the money already, looking for quite a bit more.
Missed the BA . The classic Cup and H , kept me out . now down 6 . Nice call K
For some of you, especially if you are option traders, this post is going to be quite useful, and perhaps even surprising. If it doesn’t make some lights go on, don’t sweat it. Granted with only six months of results we are looking at a small data set, the results still are quite impressive.
As I indicated earlier, one thing I wanted to ascertain was whether or not option pricing models considered a lunar effect on market price. Since an event like a full moon is so repeatedly date specific, the usual concern with option Greek metrics becomes a moot point. Things like theta, (premium decay rate), and rho, interest rate sensitivity) are completely inconsequential.
For the option buyer timing his purchase based on lunar cycles, the only thing that is of real importance is delta, the in- the -money expectation of the contract at expiration. Considering the well established correlation of market moves with lunar cycles, it is nothing short of astonishing that it does not appear that the pricing model prices in this phenomenon!
This does not mean market makers are completely unaware of the phenomenon. I have noticed for quite some time now that market makers will telegraph their expectation of an imminent increase in volatility, and with remarkable prescience, by dramatically widening spreads on VIX options, sometimes well ahead of the actual move. Nonetheless, the actual delta of option contracts appear to not be affected. If what I have concluded is correct, it is one of the few trading scenarios, beside credit spreads, that gives the trader a clear and actionable advantage. Happy Trading! 🙂
I’m wondering now if the alternate is the one and we’ve just finished (iv).
Look at the “flagging” action after the decline…