
A small inside day gives a candlestick pattern that may suggest short term movement for the next one to very few sessions.
Another signal today from the AD line adds confidence to the Elliott wave count at the daily chart level and the bigger picture.
Summary: A new all time high from On Balance Volume yesterday and a new all time high from the AD line today is extremely bullish.
For the very short term, price may pullback to about 2,828 and thereafter continue to new highs.
The next short term target is about 2,878; a consolidation lasting about one to two weeks may be expected at about this target. Following that, another consolidation lasting about two weeks may be expected about 2,915.
The invalidation remains at 2,743.26.
The mid to longer term target is at 2,922 (Elliott wave) or 3,045 (classic analysis). Another multi week to multi month correction is expected at one of these targets.
The final target for this bull market to end remains at 3,616.
Always practice good risk management. Always trade with stops and invest only 1-5% of equity on any one trade.
New updates to this analysis are in bold.
The biggest picture, Grand Super Cycle analysis, is here.
Last historic analysis with monthly charts is here, video is here.
ELLIOTT WAVE COUNT
WEEKLY CHART
Click chart to enlarge.
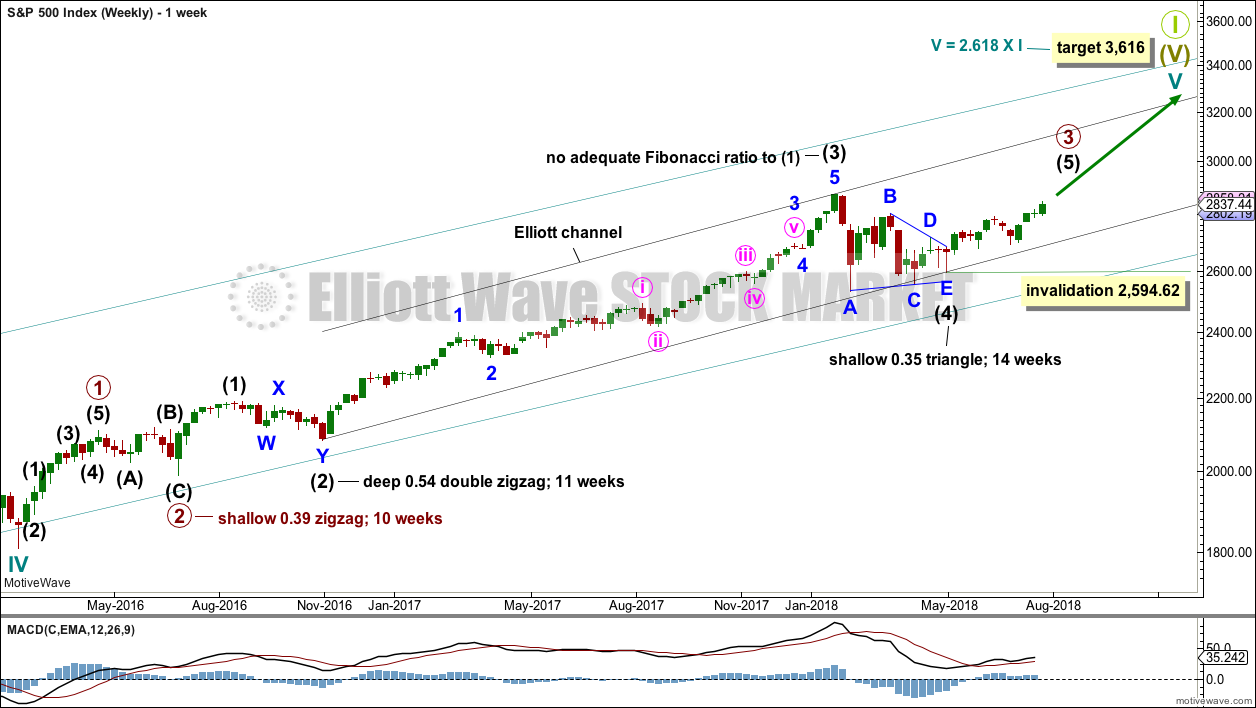
Cycle wave V must complete as a five structure, which should look clear at the weekly chart level and also now at the monthly chart level. It may only be an impulse or ending diagonal. At this stage, it is clear it is an impulse.
Within cycle wave V, the third waves at all degrees may only subdivide as impulses.
Intermediate wave (4) has breached an Elliott channel drawn using Elliott’s first technique. The channel is redrawn using Elliott’s second technique: the first trend line from the ends of intermediate waves (2) to (4), then a parallel copy on the end of intermediate wave (3). Intermediate wave (5) may end either midway within the channel, or about the upper edge.
Intermediate wave (4) may now be a complete regular contracting triangle lasting fourteen weeks, one longer than a Fibonacci thirteen. There is perfect alternation and excellent proportion between intermediate waves (2) and (4).
Within intermediate wave (5), no second wave correction may move beyond the start of its first wave below 2,594.62. However, the lower edge of the black Elliott channel drawn across the ends of intermediate degree waves should provide very strong support for any deeper pullbacks, holding price well above the invalidation point while intermediate wave (5) unfolds.
At this stage, the expectation is for the final target to me met in October 2019.
A multi week to multi month consolidation for primary wave 4 is expected on the way up to the final target.
The last bullish fifth wave of minor wave 5 to end intermediate wave (3) exhibited commodity like behaviour. It was strong and sustained. It is possible that the upcoming wave of minor wave 5 to end intermediate wave (5) to end primary wave 3 may exhibit similar behaviour, so we should be on the lookout for this possibility.
DAILY CHART
Click chart to enlarge.
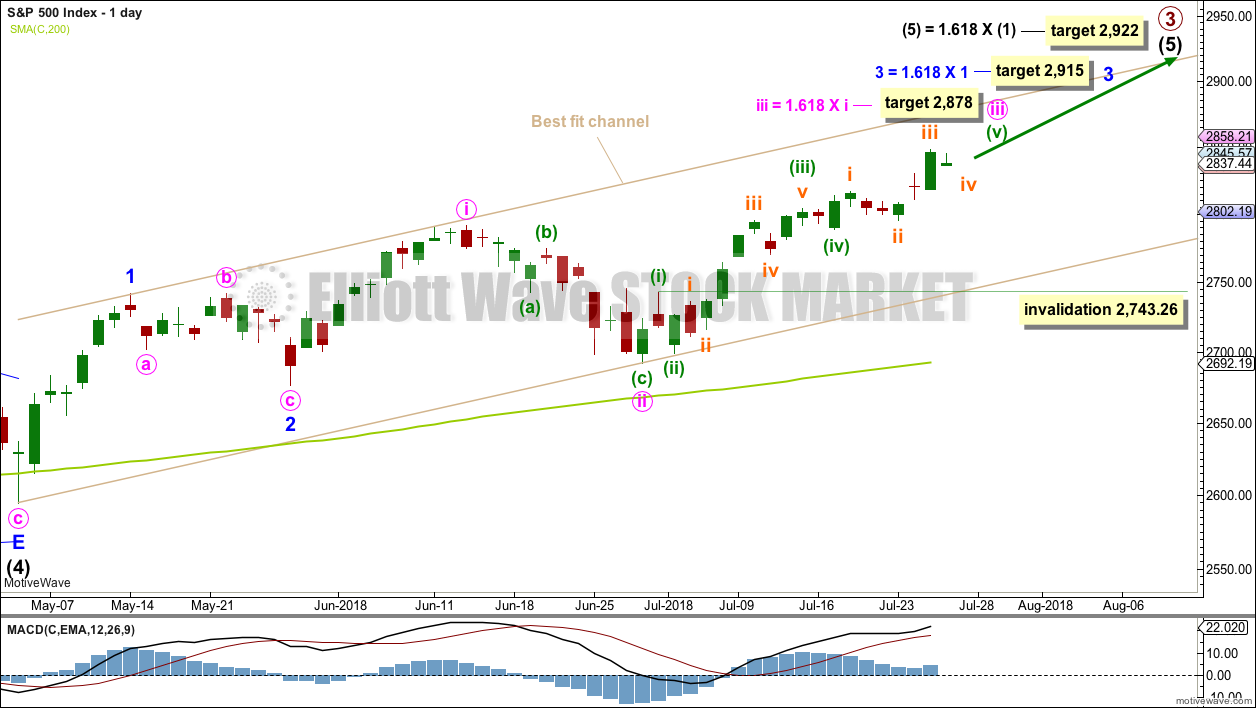
Intermediate wave (5) would be very likely to make at least a slight new high above the end of intermediate wave (3) at 2,872.87 to avoid a truncation.
Intermediate wave (3) exhibits no Fibonacci ratio to intermediate wave (1). It is more likely then that intermediate wave (5) may exhibit a Fibonacci ratio to either of intermediate waves (1) or (3). The most common Fibonacci ratio would be equality in length with intermediate wave (1), but in this instance that would expect a truncation. The next common Fibonacci ratio is used to calculate a target for intermediate wave (5) to end.
A target is now calculated for minute wave iii to end, which expects to see the most common Fibonacci ratio to minute wave i. Minute wave iii may last a few weeks. When it is complete, then minute wave iv may last about one to two weeks in order for it to exhibit reasonable proportion to minute wave ii. Minute wave iv must remain above minute wave i price territory.
Minute wave iii may have passed its middle strongest portion. It has nearly now moved far enough above the end of minute wave i yet to allow room for minute wave iv to unfold and remain above minute wave i price territory. I have considered whether or not I should pull the invalidation point up to the end of minute wave i, but that should not be done until minute wave iii can be seen as a complete structure. At this stage, subminuette wave v still needs to unfold at the hourly chart level.
A target is calculated for minor wave 3 to end, which expects to see the most common Fibonacci ratio to minor wave 1. Minor wave 3 may last several weeks in total and should look like an impulse at the daily chart level. When it is complete, then minor wave 4 may last about one to two weeks in order for it to exhibit reasonable proportion to minor wave 2. Minor wave 4 must remain above minor wave 1 price territory.
Within minute wave iii, minuette wave (i) is complete as labelled. Minuette wave (iv), if it continues lower, may not move into minuette wave (i) price territory below 2,743.26. The invalidation point will be left at the high of minuette wave (i) to allow for the possibility that minuette wave (iii) may have ended at the last high and minuette wave (iv) may now unfold.
A best fit channel is added in taupe to this chart. It contains all of intermediate wave (5) so far. The lower edge may provide support for any deeper pullbacks. The upper edge may provide resistance.
HOURLY CHART
Click chart to enlarge.
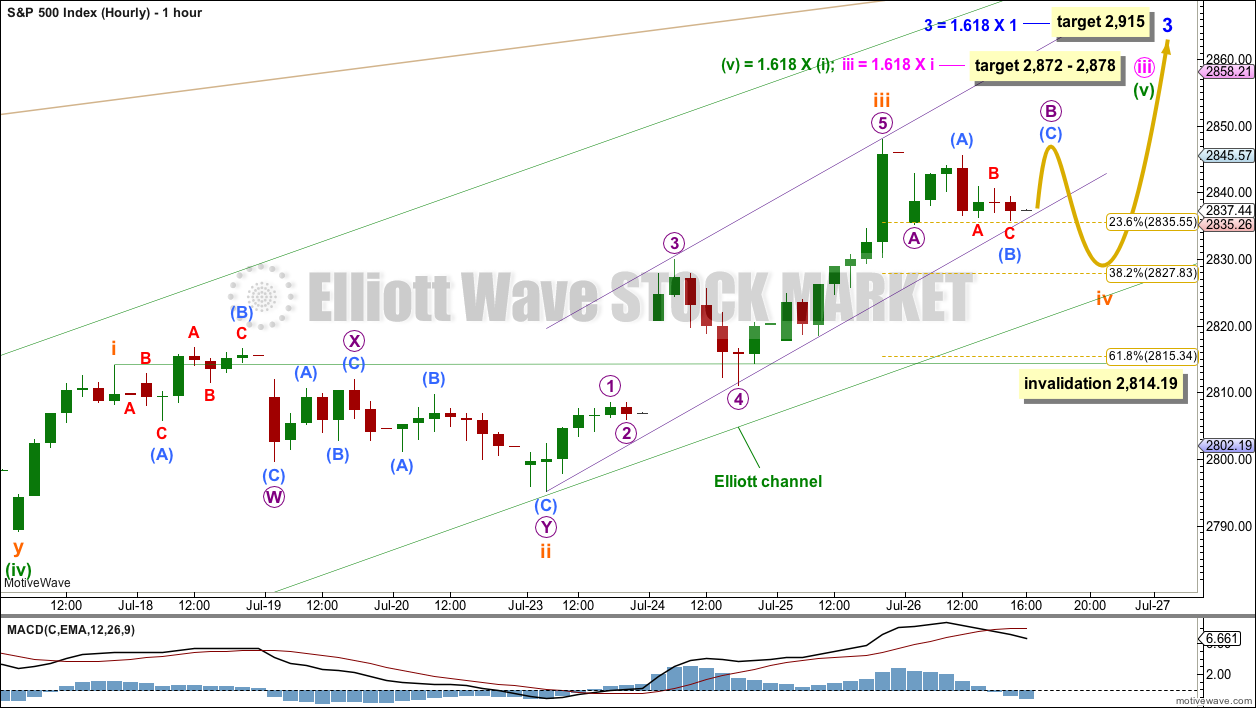
The target for minute wave iii to end is now widened to a rather large 6 point zone, now calculated at two degrees. Favour the lower edge of the target zone as it is calculated at a lower degree.
When subminuette waves i, ii, iii and iv within minuette wave (v) are complete, then the target may be calculated at a third degree. At that stage, it may be refined to a smaller range.
Subminuette wave iii could be over at yesterday’s high. Subminuette wave iii does not exhibit a Fibonacci ratio to subminuette wave i, but it is longer than 1.618 the length of subminuette wave i.
Subminuette wave ii subdivides best as a deep 0.77 double combination, lasting three sessions on the daily chart. Given the guideline of alternation, subminuette wave iv may most likely be a zigzag, which tend to be quicker structures than double combinations. Subminuette wave iv may be shallow (in relation to subminuette wave iii).
Subminuette wave iv may have begun today and may continue for another one to very few days to most likely end about the 0.382 Fibonacci ratio, which is within the price territory of the fourth wave of one lesser degree.
Subminuette wave iv is labelled as a zigzag, because that is the most likely structure for it to complete as. However, it does not need to do so. It may move only a little sideways to complete as a small triangle, or it may complete as another corrective structure.
If this short term analysis is wrong, look out now for surprises to the upside. With On Balance Volume and the AD line continuing to make new all time highs on the daily chart, there is underlying strength to this market and it is reasonable to expect price to follow with new all time highs.
Subminuette wave iv may not move into subminuette wave i price territory below 2,814.19.
When subminuette wave iv is complete, then the upwards trend should resume on up to higher targets.
TECHNICAL ANALYSIS
WEEKLY CHART
Click chart to enlarge. Chart courtesy of StockCharts.com.
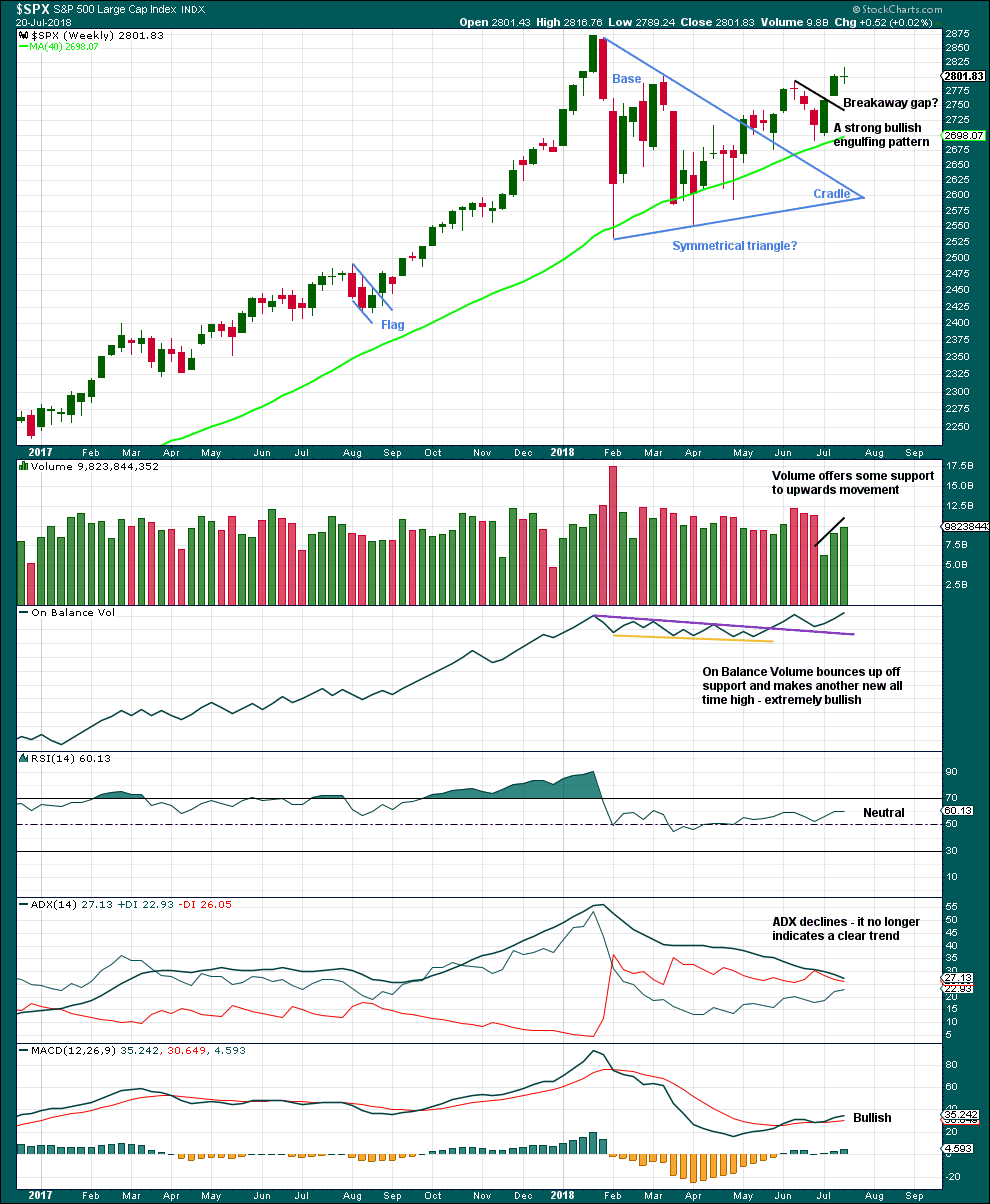
Much weight will be given in this analysis to the new all time high from On Balance Volume. Price usually follows where On Balance Volume leads. It is very reasonable here to expect a new all time high from price in coming weeks.
With volume also supporting another upwards week, this chart is very bullish.
The doji candlestick this week on its own is not a reversal signal. Doji represent a pause and can occur within a trend. There are a few examples in the prior bull run of doji on the weekly chart which were followed by more upwards movement and no reasonable pullback.
DAILY CHART
Click chart to enlarge. Chart courtesy of StockCharts.com.
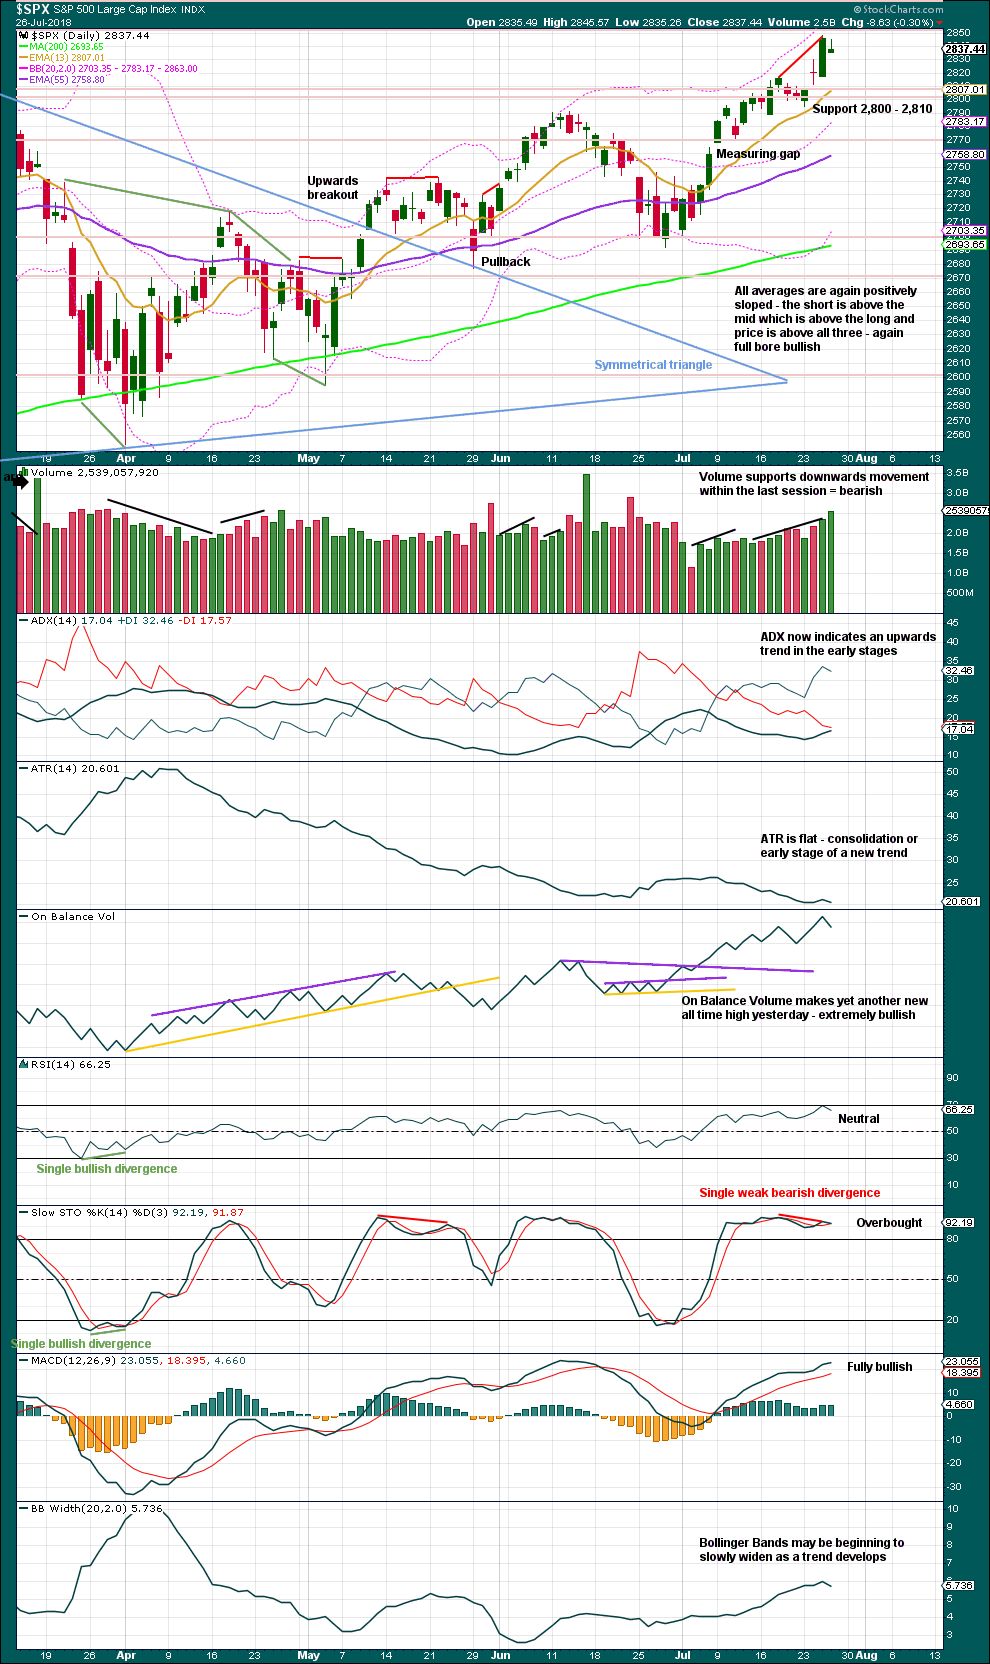
The symmetrical triangle may now be complete. The base distance is 340.18. Added to the breakout point of 2,704.54 this gives a target at 3,044.72. This is above the Elliott wave target at 2,922, so the Elliott wave target may be inadequate.
Since the low on the 2nd of April, 2018, price has made a series of higher highs and higher lows. This is the definition of an upwards trend. But trends do not move in perfectly straight lines; there are pullbacks and bounces along the way. A higher high last week adds some confidence to this trend.
Bearish divergence between Stochastics and price is weakened. Stochastics may remain overbought for reasonable periods of time when this market has a strong bull run.
This bull run now has some support from volume and strong support from On Balance Volume making new all time highs.
RSI is almost overbought, and it can remain there for long periods of time for this market.
ADX yesterday gives the strongest signal it can give: when the black ADX line rises from low levels and below both directional lines and reaches 15 or above and is increasing, then it indicates a new trend in the early stages. This trend is upwards.
For the very short term, today’s candlestick may be a Gravestone Doji, which is a bearish reversal pattern. Support today from volume for downwards movement is also bearish for the short term. This may offer a little support to the hourly chart, which expects some downwards movement for another one to very few sessions here.
VOLATILITY – INVERTED VIX CHART
WEEKLY CHART
Click chart to enlarge. Chart courtesy of StockCharts.com. So that colour blind members are included, bearish signals
will be noted with blue and bullish signals with yellow.
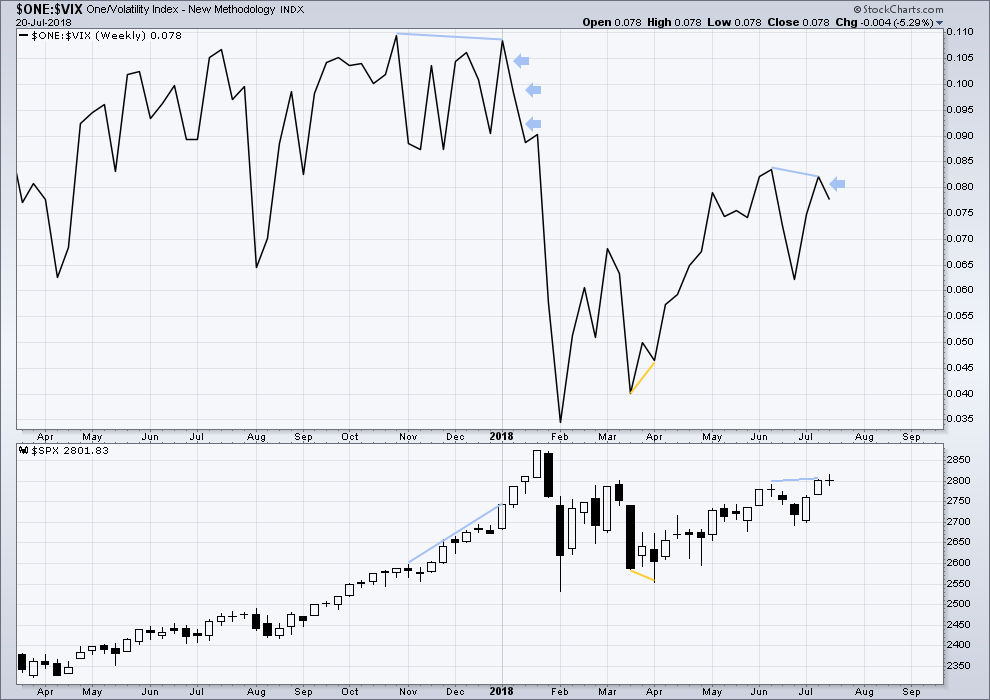
To keep an eye on the all time high for inverted VIX a weekly chart is required at this time.
Notice how inverted VIX has very strong bearish signals four weeks in a row just before the start of the last large fall in price. At the weekly chart level, this indicator may be useful again in warning of the end of primary wave 3.
Price moved higher last week, but inverted VIX moved lower. This divergence is bearish. A single week of this bearish divergence is not a very loud warning though.
DAILY CHART
Click chart to enlarge. Chart courtesy of StockCharts.com. So that colour blind members are included, bearish signals
will be noted with blue and bullish signals with yellow.
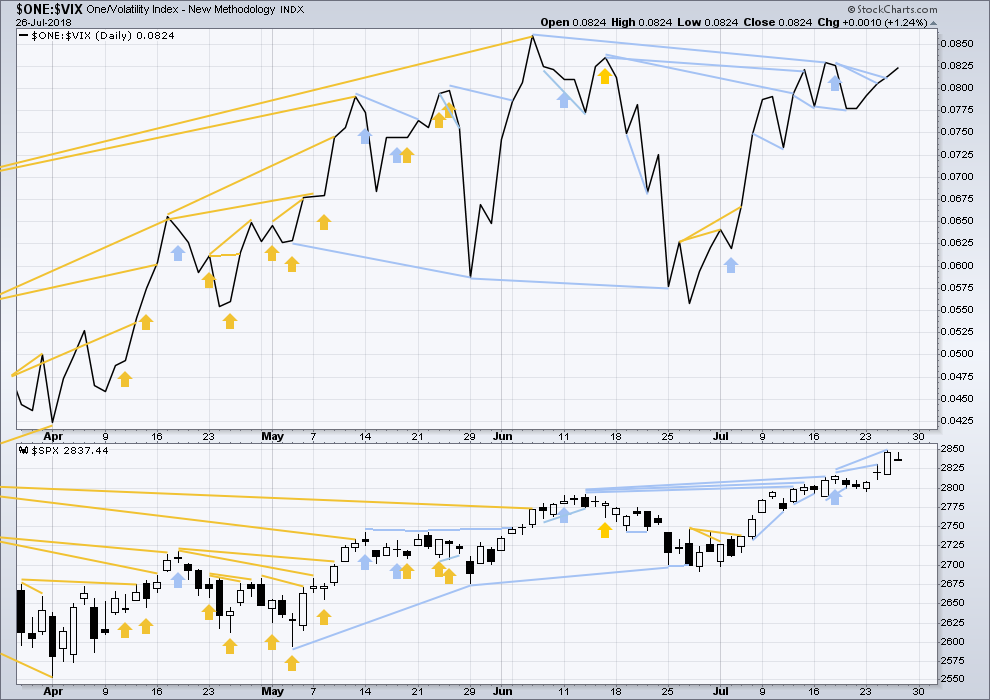
Normally, volatility should decline as price moves higher and increase as price moves lower. This means that normally inverted VIX should move in the same direction as price.
There is now a cluster of bearish signals between inverted VIX and price. There is still short term bearish divergence, but today it has weakened.
BREADTH – AD LINE
WEEKLY CHART
Click chart to enlarge. Chart courtesy of StockCharts.com.
When primary wave 3 comes to an end, it may be valuable to watch the AD line at the weekly time frame as well as the daily.
At this stage, there is very strong bullish divergence between price and the AD line at the weekly time frame. With the AD line making new all time highs, expect price to follow through with new all time highs in coming weeks.
Yet another new all time high last week from the AD line is again extremely bullish.
DAILY CHART
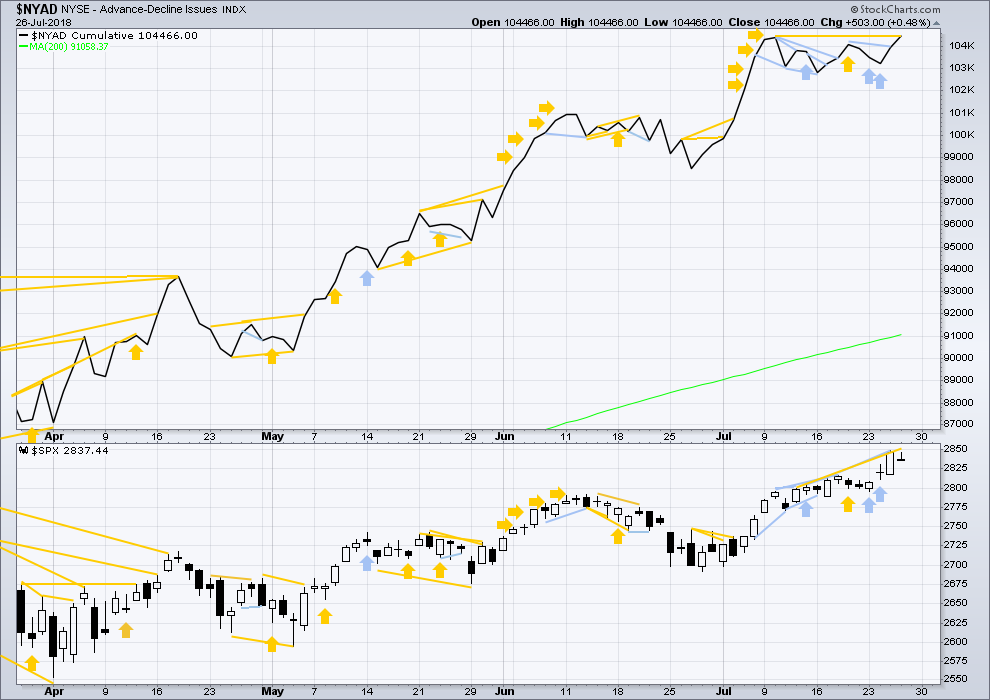
Click chart to enlarge. Chart courtesy of StockCharts.com.
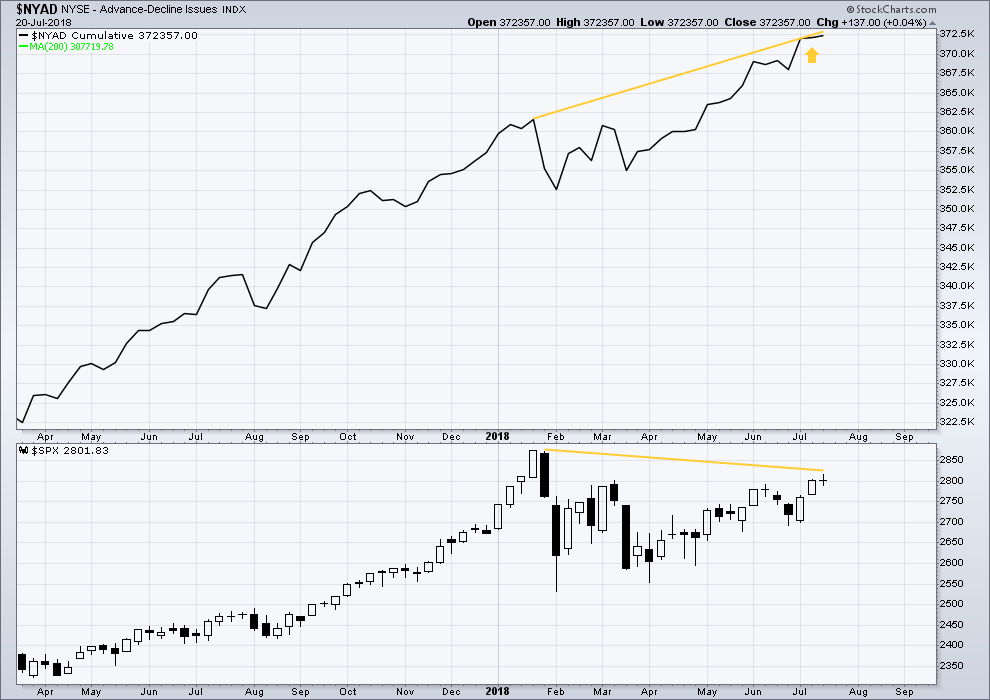
There is normally 4-6 months divergence between price and market breadth prior to a full fledged bear market. This has been so for all major bear markets within the last 90 odd years. With no longer term divergence yet at this point, any decline in price should be expected to be a pullback within an ongoing bull market and not necessarily the start of a bear market. New all time highs from the AD line means that any bear market may now be an absolute minimum of 4 months away. It may of course be a lot longer than that. My next expectation for the end of this bull market may now be October 2019.
Breadth should be read as a leading indicator.
Most recent bearish divergence between price and the AD line has so far failed to be followed by any downwards movement, so it is considered it may have failed. The AD line makes a new all time high on the daily chart today, which is an extremely strong bullish signal. Price may reasonably be expected to follow through in coming weeks.
Small caps have made another slight new all time. Mid caps made a new all time high. Only large caps have to follow through; they do usually lag in the latter stages of a bull market.
DOW THEORY
The following lows need to be exceeded for Dow Theory to confirm the end of the bull market and a change to a bear market:
DJIA: 23,360.29.
DJT: 9,806.79.
S&P500: 2,532.69.
Nasdaq: 6,630.67.
Only Nasdaq at this stage is making new all time highs, with another new all time high on Friday of last week. DJIA and DJT need to make new all time highs for the ongoing bull market to be confirmed.
Charts showing each prior major swing low used for Dow Theory may be seen at the end of this analysis here.
Published @ 07:30 p.m. EST.
Hourly chart updated:
This looks too big to be at submineutte degree.
Minute wave iv may have arrived earlier than expected, with minute iii exhibiting no Fibonacci ratio to minute i.
If that is the case then there is only a little room for it to move into. It may be a sideways chop for a few days, a combination or triangle.
I’m going to now try an alternate which sees this correction as minuette wave (iv) within an incomplete minute iii.
Lara, do the QQQ’s have a better chart to determine if we make a full five wave structure?
Probably not, as the volume is lighter.
Higher volume = clearer EW structures.
That’s why I like Gold so much for EW analysis… and why I do not do EW counts for individual equities nor ETFs anymore. Their volume I have found is just not heavy enough for reasonable looking EW structures.
I mean, even the S&P500 reasonably often has fives that look like threes. That rarely happens for Gold, and so I suspect it’s to do with volume.
Once again, class, I gotta stand up and say… we have one good teacher here!
That’s very kind indeed Curtis!
Thank you
I gotta run. Setting a contingency order to buy SPY 279.50 puts on any move below 280.00
I am confident the bulls will defend the 2800.00 level if this is a short-lived decline.
Have a wonderful week-end everyone!
If we take out 2795.14 today that would be….”noteworthy”.
DJI 25,371.11, this morning’s low, is also a line in the sand the banksters have to hold to survive the week-end. Can they?
Here is what I see. A spirited attempt this morning to use suppressed vol to arrest the market decline and they got waxed, big time. This means to buy back this decline they are going to have to dump a LOT of cash. They don’t want this baby closing at or close to the lows…or Monday will be very ugly…
Verne,
Any reason why you choose to go with UVXY options and not the underlying except of leverage a lot more through options compared to underlying?
It is really not an instrument you want to hold for too long.
In short term trading account I use options almost exclusively exactly because of the added leverage. As you know, you control a lot more shares with far less commitment of capital.
Prices finding support on gaps up from July 25. If this move down is going deeper, look for that area to be decisively breached by the close. It would be funny of this low of sorts is what was signaled by the current lunar cycle.
Much lower lows were indicated in the coming weeks/months. The panic selling is not yet started and there is no news/event to trigger that either ..atleast it seems heading into the weekend.
That is the problem isn’t it? The scary absence of any fear whatsoever in this market. Even in this era of CB juiced markets, that is never a good sign. VIX traded below 12.00 this morning. That is complete insanity and shows a market totally disconnected from reality.
AMZN being pinned to 1820 for options expiration today, Monday will be whole different story.
Haha! A nice trick that…!
Speaking of lunar cycles, what are thoughts on gold? I’m starting to build a long position, looking for a correction to about 1245-1250 area…
Anyone following gold on this forum, or gold miners? Lara’s gold forum is awefully quite…
I am a bit under-water on GDX 21 strike calls. I may have been a bit early but I was prepared for a nasty bankster bear raid so I gave em a lot of time to expiration.
GDX just pierces through support at 21.30 but closes above this. It’s either up and away from here to above 22 or we go down further to 20.80-20.90.
Good luck Verne. It’s good to know I’ve got a veteran trader seeing the same I’m seeing
Wait till AMZN goes flat or negative, panic will set in…target for AMZN is all the way down to $1,600…It has been rising in anticipation of earnings…
The dirty little secret about those stocks is how much leverage is baked into those numbers. When price finally starts to unravel, hear me now and believe me later….it gonna get UGLY, BIGLY! 🙂
I know I am going to kick myself but selling another 1/4 of UVXY calls. Never leave profits sitting in this market I always say and I need to eat my own cooking…. 🙂
The situation speaks for itself. I don’t think the trend line holds here; too much downward momentum. See my EW chart posted earlier for my best guess at the count situation (minute wave iii up complete, minute iv launching now). And money is likely to paint a bar completely under the 5 period EMA on the daily. As I said before, those two indicators are significant.
Overall, as I see things, price has come up and is turning at the 1.62% extension (it didn’t quite tag it, but close enough for government and market work), which is extremely common, so much so that I was hoping for a closer touch so I could short it precisely, but oh well. The more important action was cashing in on vulnerable longs. Done!!!
SPX price is now dancing across the top of that trend line on the 5 minute. Will it hold? I dunno. Probably not, but…maybe.
Good weekend all, off to my sister’s beach house in Cambria CA for a weekend with my wife who has been off tending to aging mother for several weeks now.
Monday will bring new tidings…and fresh $$$!!!!
Very nice pop on TZA calls. I went all the way into September so I’m gonna let ’em ride.
Took the money and ran like a bat out of you know where on IWM puts. You know what they say about pigs…! 🙂
Verne,
Does this make you a believer in lunar cycles. 🙂
Believe my friend, I am sitting bolt upright! lol!
I cannot tell you how often I dismissed folk who brought this up in my own arrogance. Eating some crow today that’s for sure…. 🙂
Taking profits on the dive on half my positions. Waiting to see how she bounces.
Nice haul!!! Bryan is incredible. I have no idea how he makes these calls.
I was looking at my underwater SOXS trade this morning and thinking “that went nowhere fast!” And then…Yowza! 🙂
Who is Bryan?
A good friend, mentor, and options master… 🙂
A super super legit derivatives specialist. I can vouch as well.
Well….ain’t this interesting? RR_001 your comment below was somewhat prophetic it would appear…
This full moon business is a bit looney, no? 🙂
True that most full moons in 2018 have lined up with big down days… but I can’t discern any longer underlying pattern beyond a day or two. Would have been a good day trade I suppose.
As far as the discussion about breadth, there is no expectation for negative divergence until the bull market is only a few months from ending. Breadth peaked in July 2007 during the last cycle, about 3 months from the S&P’s peak.
The difficulty I have always had with that argument is the assumption that this market’s demise would happen the same way as previous ones did. I know the odds favor it because of history, but there has never been a market quite like this one, and we simply cannot assume is HAS to end a certain way. In addition, there have been all kinds of other very bothersome signs that caused me to question how reliable market signals we used to place high confidence in could still be unquestioningly trusted. Just my two cents.
I agree the market certainly does not HAVE to end like other ones. But remember, the classic “This time it’s different!” critique works both ways. I don’t think it’s particularly logical to make that argument from either the bull or the bear perspective.
Agreed. We trade what we see, not what we think…! 🙂
“Somewhere there’s music
How faint the tune
Somewhere there’s heaven
How high the moon” 🙂
Current count hanging on for dear life now with invalidation at 2814.19… what would be the preferred alternate for a break below that?
yeah…. who has a count ?
i posted mine. fwiw. minute wave iii complete now. if correct, price should stay above the minute i top at 2791.47 as this minute iv plays out.
Short trades really starting to pop.
I have a HUGE problem.
If the next lunar cycle sees a market low, this thing could be just getting started and that cycle will include a partial solar eclipse. The experts are saying that could be VERY significant.
I think I will remain disciplined and take profit at pre-determined targets until I have more data about this lunar business.
I mentioned LULU as a possible quality short a few days ago. It’s now breaking below it’s tight sideways “way up in the stratosphere” range. It could really tank from here.
Glad I loaded a long vol trade earlier. Those wide spreads once again signaled a move higher. They totally dissed me this morning as I tried to add to my position at a sweet price. Rats! I shoulda bit the bullet and paid ’em! I knew that is what they were up to!
We have the gap higher in both UVXY and VXX. They were forced to unwind a leveraged bear raid on those instruments so they are probably going higher and some risk parity trades are going to have to be adjusted. Amazing what is going on!
My bearish paranoia is going off right now.
I can count 5 minuette waves up on the daily. While this isn’t Lara’s count and may have issues at the more detailed level, I like to err on the side of caution. I’m lightening up appreciably, particularly in shorter term bullish option positions. A iv here should only go to the range of 2794-2816, but it could go lower, and I like to buy low, not watch bought positions go low.
Could be wrong, new highs early next week! But I look at that and say “well, the logical top of this daily level swing up is very close anyway, so I’m not necessarily giving up a lot” by getting out of some of these positions early (mostly at small profits fortunately).
We’ll see.
Every minute that goes by, I’m happier and happier with my decision and exits. Got more than target profit in the til for the day, and waaaaaay lighter going into what is looking more and more like a short term top and deeper sell off going into next week.
That took some nimble trading. Plan was to hold short puts as a cushion against draw down on my short trades on the last wave up. When Nasdaq turned early I bought back short puts for a small profit and not a moment too soon! Very tricksy market! 🙂
XLF is pushing up against it’s most conservative downtrend line on the daily chart. And the price is right in the range of multiple pivot highs over the last few months. As goes XLF right now, so goes SPX. This is one to keep an eye on. A turn down here probably means a larger turn down for the general market than we’ve seen so far.
Unless we get a spectacular dive into the close, it would appear that the current full moon will have accompanied some sort of interim market high. Let’s see if the 1 high, 2 lows pattern continue with August and September lows. Verne reporting for Lunatic News! 🙂
Lol!!! Good MOOOOOORRRRRNNNING, fellow Lunatics!
I will again recommend The Wizard of OZ with Dark Side of the Moon as sound track. Hit “play” at exactly the third lion roar. You know you have it right if at exactly all the major scene changes in the first 20 minutes or so, there is perfectly timed change in music. Pay attention to the little things: “balance on the perfect wave, you race towards an early grave” as Dorothy walks the fence and falls into the pig pit. “Who knows which is witch, and who is who?” as the camera cuts between dorothy and the wicked witch. “Black!!!” as they focus on the witch. “And blue!” as they focus on dorothy in her blue plaid dress. “The lunatic is on the grass” during the scarecrow’s crazy dance. “and the man with the gun”, as the camera focuses on the scarecrow holding a pistol. Or (my favorite) after 2 1/3 times through the soundtrack (use auto play for the whole disk if possible, the disk needs to be run repetitively through the whole movie), as dorothy is waking up in bed back home, the singing is “Home! Home again! I like to be here when I can.” There are 30 more synchronicitys to find, easy.
Fascinating!
Those who say “random chance” haven’t given it a listen. And fact is, Pink Floyd did a few soundtracks in the years prior to DSoTM; they knew soundtracks. The album itself gives the huge hint re: the prism and rainbow. Of course they deny deny deny because if they said “yes”…KNOCK KNOCK comes MGM asking for BILLIONS in royalties!!! Lol!!
I’m to the point where I prefer the move with the DSoTM soundtrack. It’s really pretty awesome.
that’s fascinating Kevin!
I love love Pink Floyd
Very strange situation. VXN tracking NDX weakness. Other indices sure to follow so why are VXX and UVXY in the red? Efficient markets? Clearly not! 🙂
INTC sell off after earnings should set up an excellent buy opportunity upcoming (few weeks from now probably). I’ll be watching for INTC to hit and turn off the 62% fibo at 42.6 (it’s at 47.6 now). I’ll jump that one! Look at all the swing low support on the weekly at 47.6 back in Dec-Feb.
We are straddling it. 🙂
Excellent call on INTC going below 48 a few days ago Kevin. When you mentioned it I thought it would be very unlikely… Here we are!
Yes I agree, it would be a great long opportunity very soon…
Ferocious attempt underway to juice risk parity trade.
There should be no need with great GDP numbers one would think…
A gap up in VXX and UVXY would be noteworthy. They are exremely rare intra-day and signal short term suppresion failure…
EEM is getting interesting. This is a daily chart. Obviously a major down trend, but price is pushing up to the trend line now after massaging the 38% fibo. If the market enters a larger 4 real soon now, this might be a fine little short. On the other hand, if/when that TL breaks etc., and the larger conditions are bullish, could be a good long. EEM option liquidity is HUGE, by the way. This is a very highly traded product.
TWTR may find support in prior gap area around 37.98, so a close above should see a relief bounce. If not, we probably take out 35 and head lower…
Give me $30 please on TWTR..:)
Wish granted! 🙂 🙂 🙂
31.07 is very likely (78.6% retrace of April-June wave up). Price sitting on 61.8% but given momentum, that’s not likely to hold.
If 31.07 breaks, then 26.7 is likely, the April pivot low. But I’d put better than even money on 31.07 holding, myself.
I don’t know that it is necessarily meaningful now but every single time I have seen VIX spreads baloon like this vol went on a tear….
Oopsie! Missed an “l”.
My spelling teacher would not be at al amused! 🙂
Wassup with those VIX spreads??!!
I have nevet seen them so wide! Yikes!!
I looked at past Feb drop and noticed that A-D for Dec. 2017 and Jan. 2018 did not indicate Feb. Selloff. With trade war in full bloom, I expect a similar behaviour heading into fall.
Yep. I have noticed the same thing. I am not sure why but some market signals have warranted a bit of caution of late. A lot of mine have been very misleading and it has made me extremely cautious.
You wouldn’t really expect it to for corrections in an ongoing bull trend…
Bloomberg is reporting that at 119 billion, the loss posted by FB is the largest ever for a US traded company. Insiders, including Zukerface himself, has steadily unloaded shares for months. Here is what the MSM will not tell you. That kind of dive happens only in very specific situations, namely, LEVERAGED EXITS.
If you apply this possibility to the broader market then you know why I have always felt this market in my opinion, warrants great caution.
It is particularly sobering as stops are completely useless when something like that happens. A good reminder of the importance of position sizing….
Verne,
Agree on Amazon but timing has been tough. Look at SHOP as it might start downside sooner as air is getting thinner for it…jmho
Yep. Not a lot of pop on this one but I think the other shoe has yet to drop. Up around 4% and for such expensive options it will most likely be a wash.
Much better results for TWTR! 🙂
There are some strange goings on with VIX option chains for the second and third weeks of August. Take a look.
Somebody is expecting trouble!
Trying to get VIX 12 strike calls pre-market but no fill even at the ask!
Now that is peculiar!
Verne,
I thought options are only in cash market.
You may be right. I was able to submit the order but that’s probably why no pre- market fill.
I was able to trade VXX pre- market but not VIX.
Thanks!
I’m seeing the impulse up from Jul 23 a little differently at the moment, as a more well defined impulse of microwaves, with micro 4 just about complete. Perhaps I’m just looking with bull eyes though. This model calls for rather quick and strong uptrending.
The ellipses mark the two targets for the top of micro wave v (top of subminuette wave iii), the first at the 161% of the subminuette wave 1 upswing at 2854, and the second at the ATH at 2872. Interestingly (but not explicitly shown), the ratio analysis for micro wave v vs. i and micro wave v vs. iii both put targets for micro wave 5 completion very close to both these fibo levels (and inside the ellipses). When different targets overlap like that the become much stronger prognosticators. So watch for a turn down at these levels, and a larger correction from there (in this model, it would be a several day subminuette iv matching the recent subminuette ii action, probably a sharper zigzag as identified by Lara).
If price cuts below 2829.99 this model is toast.