Yesterday’s main Elliott wave count expected more upwards movement.
Also, yesterday’s analysis stated that I struggled to see a bearish alternate, despite bearish signals from the AD line. Today, a strong upwards day fits the Elliott wave count perfectly.
Summary: A new all time high from On Balance Volume today is very bullish. A new and very short term target is now at 2,860, where a brief pullback may occur that may most likely last only one day but could last up to three or four days.
Thereafter, the next short term target is about 2,878; a consolidation lasting about one to two weeks may be expected at about this target. Following that, another consolidation lasting about two weeks may be expected about 2,915.
The invalidation point may now be moved up to 2,743.26.
The mid to longer term target is at 2,922 (Elliott wave) or 3,045 (classic analysis). Another multi week to multi month correction is expected at one of these targets.
The final target for this bull market to end remains at 3,616.
Always practice good risk management. Always trade with stops and invest only 1-5% of equity on any one trade.
New updates to this analysis are in bold.
The biggest picture, Grand Super Cycle analysis, is here.
Last historic analysis with monthly charts is here, video is here.
ELLIOTT WAVE COUNT
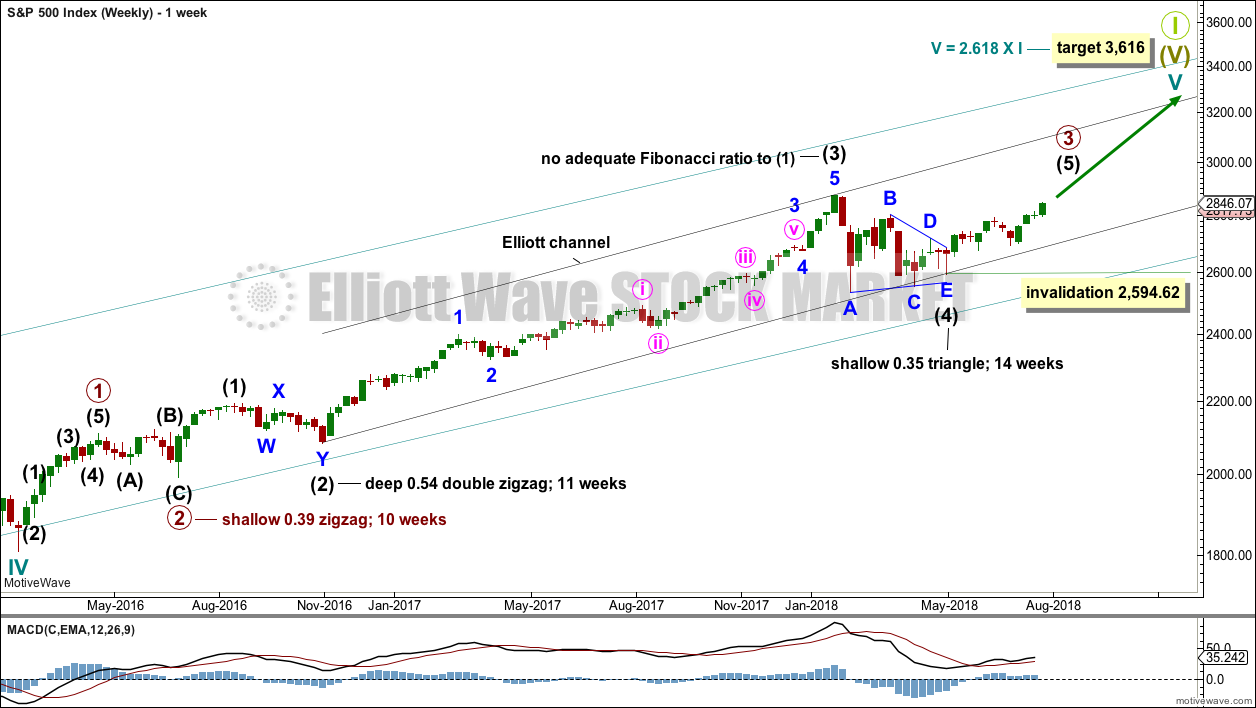
WEEKLY CHART
Cycle wave V must complete as a five structure, which should look clear at the weekly chart level and also now at the monthly chart level. It may only be an impulse or ending diagonal. At this stage, it is clear it is an impulse.
Within cycle wave V, the third waves at all degrees may only subdivide as impulses.
Intermediate wave (4) has breached an Elliott channel drawn using Elliott’s first technique. The channel is redrawn using Elliott’s second technique: the first trend line from the ends of intermediate waves (2) to (4), then a parallel copy on the end of intermediate wave (3). Intermediate wave (5) may end either midway within the channel, or about the upper edge.
Intermediate wave (4) may now be a complete regular contracting triangle lasting fourteen weeks, one longer than a Fibonacci thirteen. There is perfect alternation and excellent proportion between intermediate waves (2) and (4).
Within intermediate wave (5), no second wave correction may move beyond the start of its first wave below 2,594.62. However, the lower edge of the black Elliott channel drawn across the ends of intermediate degree waves should provide very strong support for any deeper pullbacks, holding price well above the invalidation point while intermediate wave (5) unfolds.
At this stage, the expectation is for the final target to me met in October 2019.
A multi week to multi month consolidation for primary wave 4 is expected on the way up to the final target.
The last bullish fifth wave of minor wave 5 to end intermediate wave (3) exhibited commodity like behaviour. It was strong and sustained. It is possible that the upcoming wave of minor wave 5 to end intermediate wave (5) to end primary wave 3 may exhibit similar behaviour, so we should be on the lookout for this possibility.
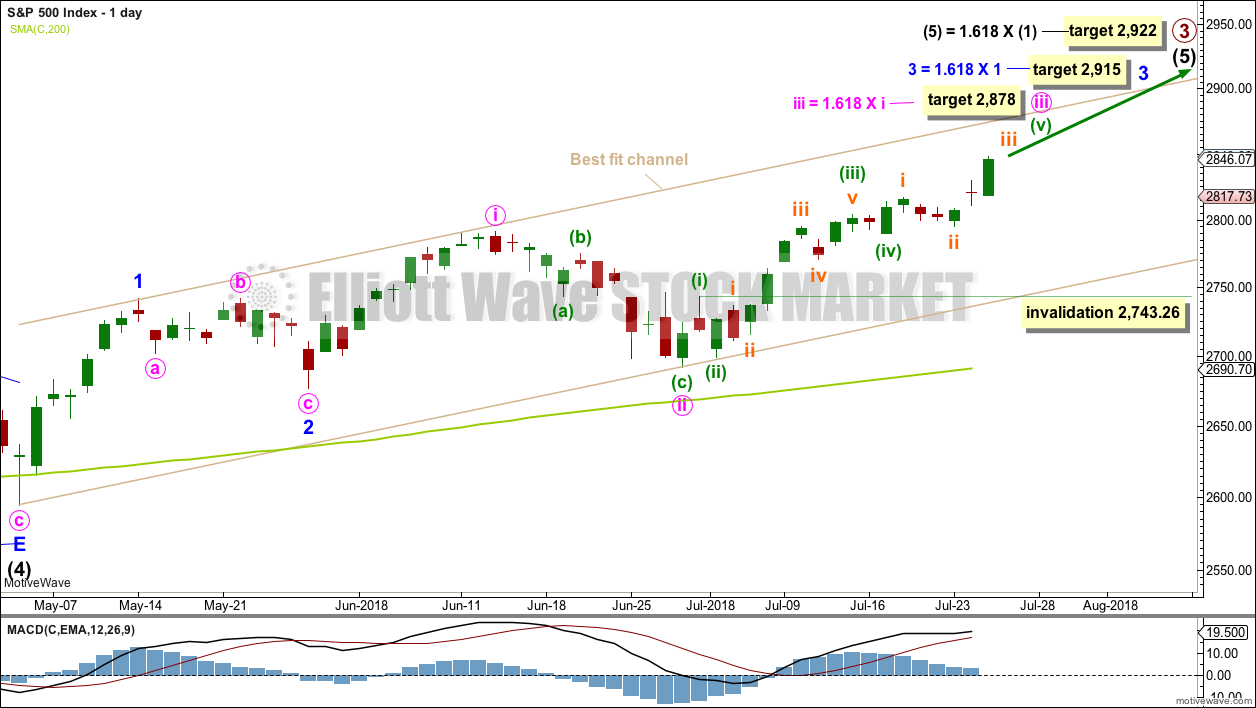
DAILY CHART
Intermediate wave (5) would be very likely to make at least a slight new high above the end of intermediate wave (3) at 2,872.87 to avoid a truncation.
Intermediate wave (3) exhibits no Fibonacci ratio to intermediate wave (1). It is more likely then that intermediate wave (5) may exhibit a Fibonacci ratio to either of intermediate waves (1) or (3). The most common Fibonacci ratio would be equality in length with intermediate wave (1), but in this instance that would expect a truncation. The next common Fibonacci ratio is used to calculate a target for intermediate wave (5) to end.
A target is now calculated for minute wave iii to end, which expects to see the most common Fibonacci ratio to minute wave i. Minute wave iii may last a few weeks. When it is complete, then minute wave iv may last about one to two weeks in order for it to exhibit reasonable proportion to minute wave ii. Minute wave iv must remain above minute wave i price territory.
Minute wave iii may have passed its middle strongest portion. It has nearly now moved far enough above the end of minute wave i yet to allow room for minute wave iv to unfold and remain above minute wave i price territory. I have considered today whether or not I should pull the invalidation point up to the end of minute wave i, but that should not be done until minute wave iii can be seen as a complete structure. At this stage, subminuette waves iv and v still need to unfold at the hourly chart level.
A target is calculated for minor wave 3 to end, which expects to see the most common Fibonacci ratio to minor wave 1. Minor wave 3 may last several weeks in total and should look like an impulse at the daily chart level. When it is complete, then minor wave 4 may last about one to two weeks in order for it to exhibit reasonable proportion to minor wave 2. Minor wave 4 must remain above minor wave 1 price territory.
Within minute wave iii, minuette wave (i) is complete as labelled. Minuette wave (iv), if it continues lower, may not move into minuette wave (i) price territory below 2,743.26. The invalidation point will be left at the high of minuette wave (i) to allow for the possibility that minuette wave (iii) may have ended at today’s high and minuette wave (iv) may now unfold.
A best fit channel is added in taupe to this chart. It contains all of intermediate wave (5) so far. The lower edge may provide support for any deeper pullbacks. The upper edge may provide resistance.
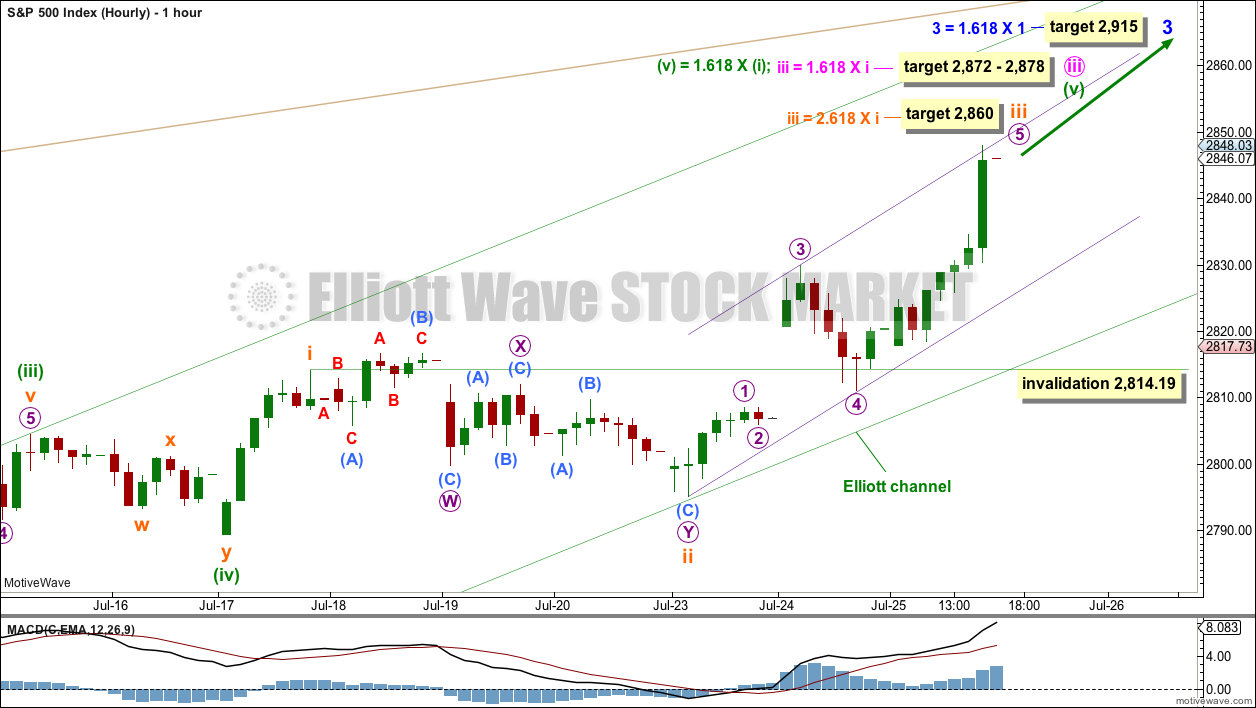
HOURLY CHART
The target for minute wave iii to end is now widened to a rather large 6 point zone, now calculated at two degrees. Favour the lower edge of the target zone as it is calculated at a lower degree.
When subminuette waves i, ii, iii and iv within minuette wave (v) are complete, then the target may be calculated at a third degree. At that stage, it may be refined to a smaller range.
Subminuette wave iii could be over tomorrow. Subminuette wave iii has passed 1.618 the length of subminuette wave i, so the next Fibonacci ratio in the sequence is used to calculate a target.
When subminuette wave iii is complete, then subminuette wave iv should begin. Use the smallest and steepest purple channel drawn about subminuette wave iii. When this channel is breached by downwards or sideways movement, that may be an indication that subminuette wave iii is over and subminuette wave iv may have begun.
Subminuette wave ii subdivides best as a deep 0.77 double combination, lasting three sessions on the daily chart. Given the guideline of alternation, subminuette wave iv may most likely be a zigzag, which tend to be quicker structures than double combinations. Subminuette wave iv may be shallow (in relation to subminuette wave iii) and may last only one day. It could of course be a little longer than that. It may be a quick sharp little pullback.
Subminuette wave iv may not move into subminuette wave i price territory below 2,814.19.
When subminuette wave iv is complete, then the upwards trend should resume on up to higher targets.
TECHNICAL ANALYSIS
WEEKLY CHART
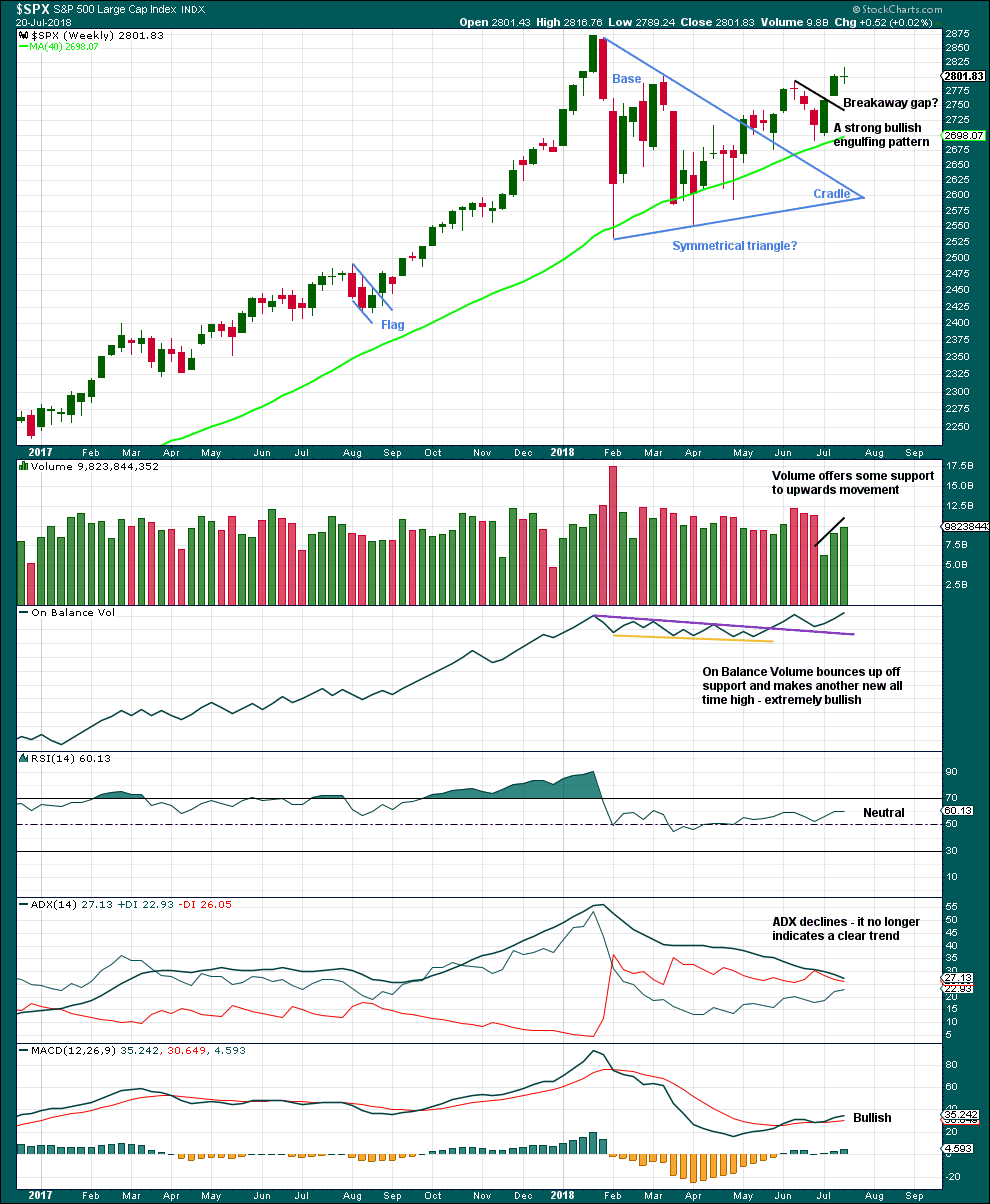
Click chart to enlarge. Chart courtesy of StockCharts.com.
Much weight will be given in this analysis to the new all time high from On Balance Volume. Price usually follows where On Balance Volume leads. It is very reasonable here to expect a new all time high from price in coming weeks.
With volume also supporting another upwards week, this chart is very bullish.
The doji candlestick this week on its own is not a reversal signal. Doji represent a pause and can occur within a trend. There are a few examples in the prior bull run of doji on the weekly chart which were followed by more upwards movement and no reasonable pullback.
DAILY CHART
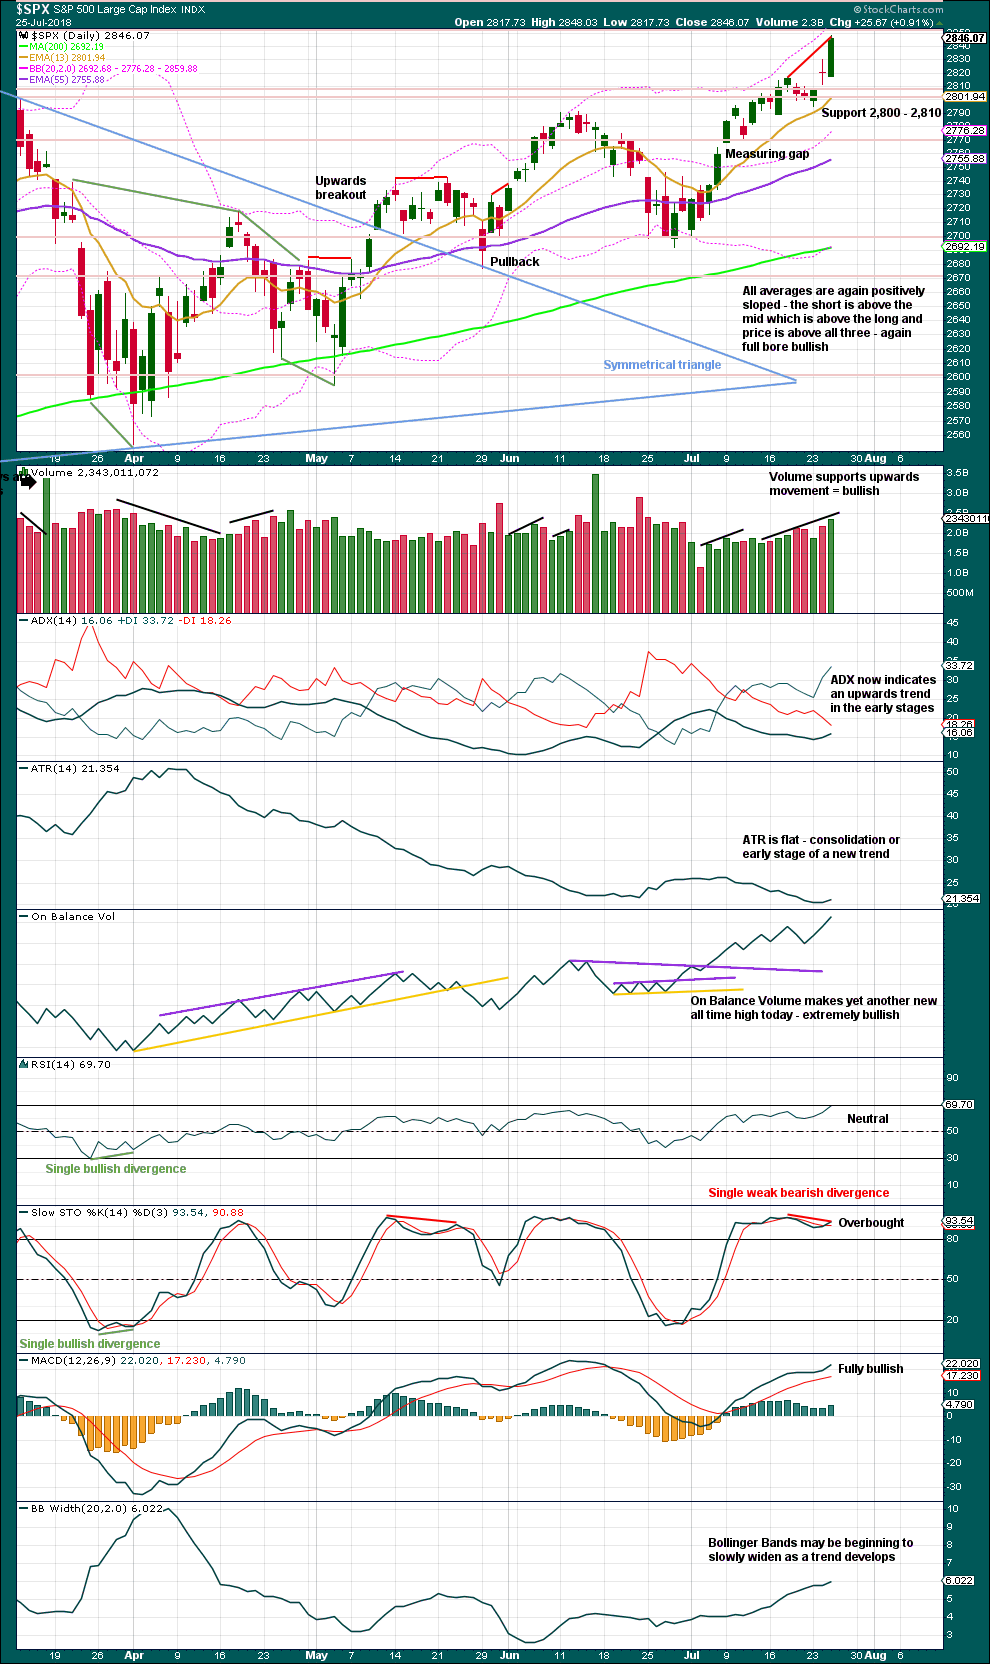
Click chart to enlarge. Chart courtesy of StockCharts.com.
The symmetrical triangle may now be complete. The base distance is 340.18. Added to the breakout point of 2,704.54 this gives a target at 3,044.72. This is above the Elliott wave target at 2,922, so the Elliott wave target may be inadequate.
Since the low on the 2nd of April, 2018, price has made a series of higher highs and higher lows. This is the definition of an upwards trend. But trends do not move in perfectly straight lines; there are pullbacks and bounces along the way. A higher high last week adds some confidence to this trend.
The measuring gap gives a short term target at 2,838. The gap has offered support. This target has now been met and passed without any pullback or consolidation, so use the higher target calculated by the symmetrical triangle.
Bearish divergence between Stochastics and price is today weakened. Stochastics may remain overbought for reasonable periods of time when this market has a strong bull run.
This bull run now has some support from volume and strong support from On Balance Volume making new all time highs.
RSI is almost overbought, and it can remain there for long periods of time for this market.
ADX today gives the strongest signal it can give: when the black ADX line rises from low levels and below both directional lines and reaches 15 or above and is increasing, then it indicates a new trend in the early stages. This trend is upwards.
VOLATILITY – INVERTED VIX CHART
WEEKLY CHART
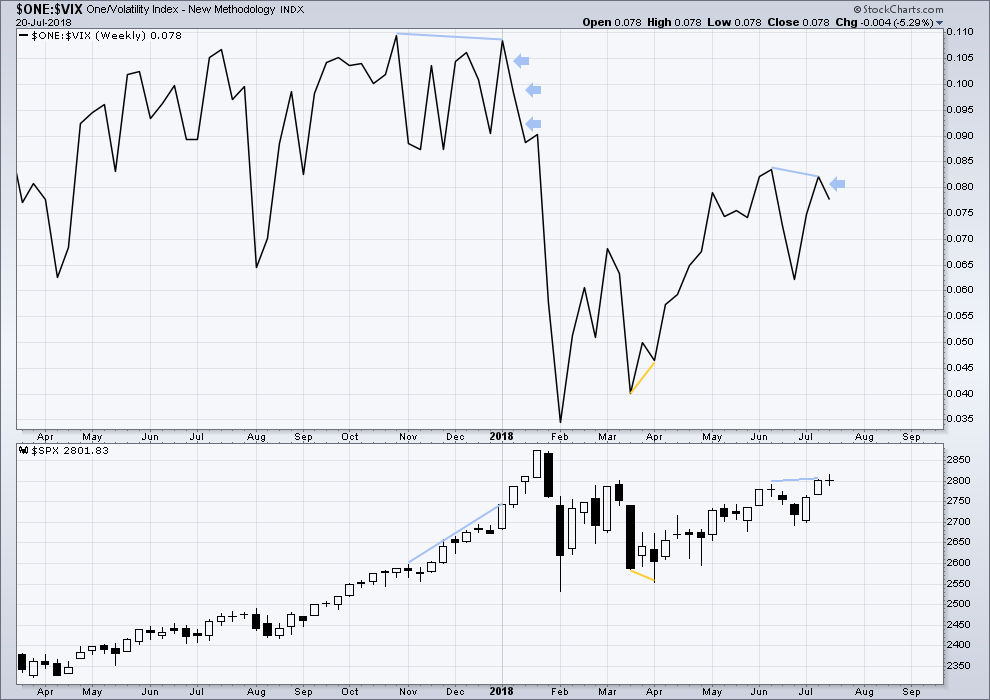
Click chart to enlarge. Chart courtesy of StockCharts.com. So that colour blind members are included, bearish signals
will be noted with blue and bullish signals with yellow.
To keep an eye on the all time high for inverted VIX a weekly chart is required at this time.
Notice how inverted VIX has very strong bearish signals four weeks in a row just before the start of the last large fall in price. At the weekly chart level, this indicator may be useful again in warning of the end of primary wave 3.
Price moved higher last week, but inverted VIX moved lower. This divergence is bearish. A single week of this bearish divergence is not a very loud warning though.
DAILY CHART
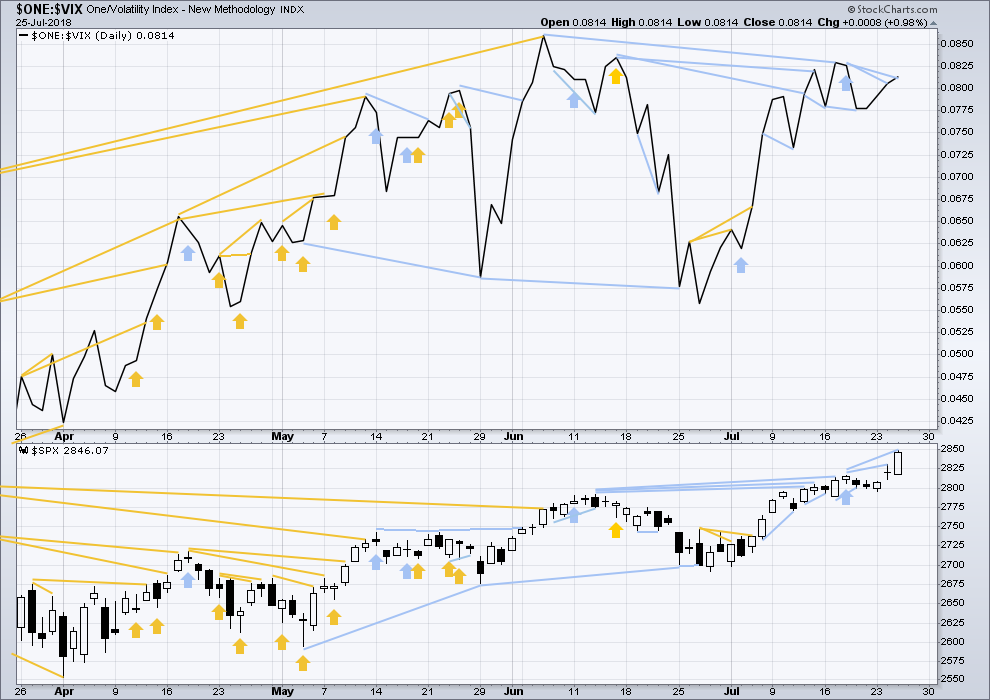
Click chart to enlarge. Chart courtesy of StockCharts.com. So that colour blind members are included, bearish signals
will be noted with blue and bullish signals with yellow.
Normally, volatility should decline as price moves higher and increase as price moves lower. This means that normally inverted VIX should move in the same direction as price.
Price has made another high above the prior high six sessions ago, but inverted VIX has still not made a corresponding new high. This divergence is bearish and persistent so far.
There is also mid and longer term bearish divergence.
The last bearish short term signal noted yesterday has not been followed by any downwards movement, so it is considered to have failed. If inverted VIX makes a new high above the last high six sessions ago, then current short term bearish divergence would simply disappear.
BREADTH – AD LINE
WEEKLY CHART
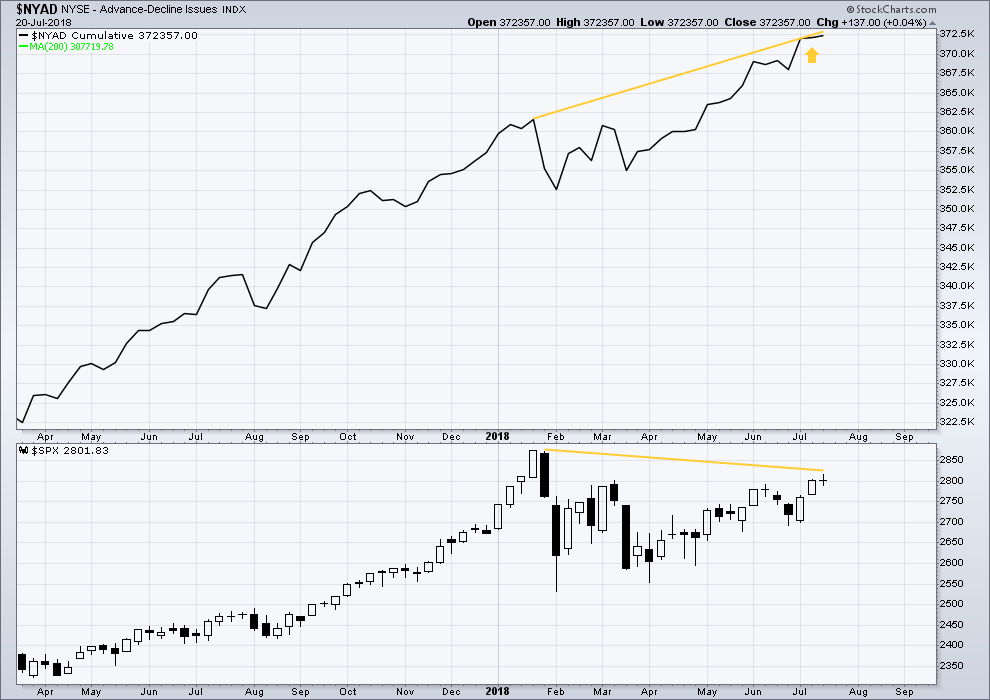
Click chart to enlarge. Chart courtesy of StockCharts.com.
When primary wave 3 comes to an end, it may be valuable to watch the AD line at the weekly time frame as well as the daily.
At this stage, there is very strong bullish divergence between price and the AD line at the weekly time frame. With the AD line making new all time highs, expect price to follow through with new all time highs in coming weeks.
Yet another new all time high last week from the AD line is again extremely bullish.
DAILY CHART
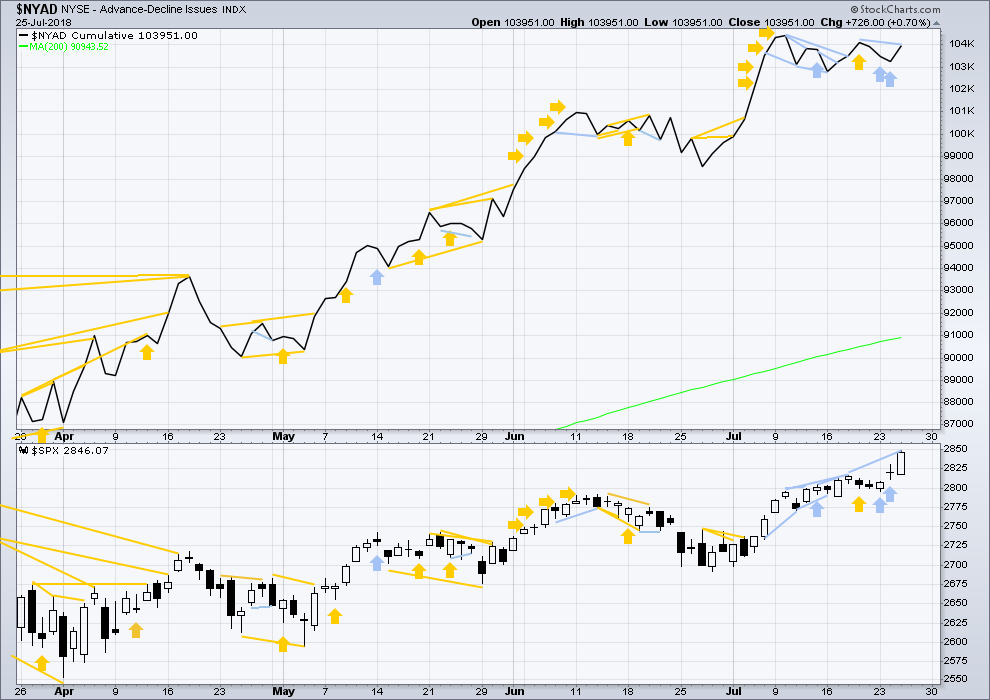
Click chart to enlarge. Chart courtesy of StockCharts.com.
There is normally 4-6 months divergence between price and market breadth prior to a full fledged bear market. This has been so for all major bear markets within the last 90 odd years. With no longer term divergence yet at this point, any decline in price should be expected to be a pullback within an ongoing bull market and not necessarily the start of a bear market. New all time highs from the AD line means that any bear market may now be an absolute minimum of 4 months away. It may of course be a lot longer than that. My next expectation for the end of this bull market may now be October 2019.
Breadth should be read as a leading indicator.
Overall, recent new all time highs from the AD line remain extremely bullish for the longer term trend.
Price may reasonably be expected to follow through in coming weeks.
Bearish single day divergence noted in yesterday’s analysis is considered now to have failed; it was not followed by any downwards movement from price.
There is short term divergence between price and the AD line today: price has made a new high above the prior high 5-6 sessions ago, but the AD line has not. This rise in price does not yet have a corresponding rise in market breadth. This divergence is bearish for the short term.
Small caps have made another slight new all time. Mid caps made a new all time high. Only large caps have to follow through; they do usually lag in the latter stages of a bull market.
DOW THEORY
The following lows need to be exceeded for Dow Theory to confirm the end of the bull market and a change to a bear market:
DJIA: 23,360.29.
DJT: 9,806.79.
S&P500: 2,532.69.
Nasdaq: 6,630.67.
Only Nasdaq at this stage is making new all time highs, with another new all time high on Friday of last week. DJIA and DJT need to make new all time highs for the ongoing bull market to be confirmed.
Charts showing each prior major swing low used for Dow Theory may be seen at the end of this analysis here.
Published @ 10:15 p.m. EST.

updated hourly chart:
I know that the small narrow channel hasn’t been breached, but the size of this consolidation now looks too big to be part of subminuette iii. It looks like subminuette iv, which may be a triangle.
Higher targets and invalidation points remain the same.
The 15 min candle on ES is a rocket!
Yep. Today a triangle fourth. Sold DIA 253 puts against long puts I hope to buy back on thrust out of four manana…
Yabba dabba doo, just noticed LUV going off like a rocket. Hey, I hold a bull call spread! I like to take profits on those once they get above about 55% of maximum. Not always, but in situations like this; LUV has popped from 52-56 in a day, and could be back at 52 easy in a few more days. Ring it!!!
I hope others are making $$ out there. I’m having a good ‘ol time myself. I LOVE LOVE LOVE SPX impulsive action, like we’ve had since that horrible overly long and deep iv completed!
Sounds like you’re getting love from LUV… enjoy it mister. Most of your recommendations and chart work are solid!
Once again, TLT is in a weekly squeeze (9 periods now), and appears to have initiated a break out of it to the downside. 116 is quite likely; much further over time is very possible. I’m on it short term, intermediate term, and longer term.
could be a contracting triangle iv as well, in which case, the low here is likely to be at 2837.
oops that was supposed to go down below in the SPX thread but whatever.
Looks now like indeed it WAS a triangle subminuette iv, and the v is breaking out now to the upside. No guarantees but that’s how I see it at the moment. in which case, 2854 tomorrow….
From last night’s update:
“Given the guideline of alternation, subminuette wave iv may most likely be a zigzag, which tend to be quicker structures than double combinations. Subminuette wave iv may be shallow (in relation to subminuette wave iii) and may last only one day. It could of course be a little longer than that. It may be a quick sharp little pullback.”
On the SPX hourly today’s action sure looks like a complete A-B of an overall ABC zigzag down. The C is just getting going. Should bring another excellent buying opportunity.
If this is indeed a simple ABC down and C is just getting started, then a likely turn spot for C is 2834, where a couple of overlapped retrace fibo’s like along with a pivot high from late yesterday. Here’s the 5 minute.
Series of bull flags in UVXY.
It is looking like this lunar cycle will bring a full moon turn on a high this Friday.
The pattern since the full moon high in January has been two consecutive full moon lows. This is suggesting a possible move lower in markets heading into the next cycle ending August 26, when we will also see a partial solar eclipse. I used to dismiss these lunar correlations as balderdash until I actually plotted a few market highs and lows against the lunar cycle and the results were surprisingly statistically noteworthy. Every full moon this year has been very close to a market turn. I cannot explain the correlation, I just know it exists.
Your sample size is too small to give you correlations with any statistical significance.
True. The only reason I even bothered is lunatic trader has 100 years worth of data and I designed a very rudimentary experiment for my own satisfaction. A viable theory must be testable, repeatable, and predictive. I wanted some recent data. A market turn tmorrow and again on August 26 would be impressive. Data going back a few years is also statistically significant, with about 80% of significant turns within two or three days. New moons are also interesting.
There is also the well-known Puetz Window, also statistically significant.
Awesome, good luck with it.
I’ll stick to what I know works for me. EW + fractal structure + trend line breaks + polarity inversion. My mumbo jumbo is probably no better or worse than astronomical events, lol!!!
Verne,
You are not the only one who trusts lunar cycles. McCellan Financials folks use this as well.
I am a complete novice, with only the last 6 months of my own very simple attempts at correlation. I think we get a sharp move up out of the triangle fourth to finish three tomorrow…not too bad
It will be interesting if five up completes the coming week….
This is one of the most interesting comments I’ve read in a while. Thanks Verne for pointing this out. It will be interesting to see what happens…
For now I’m on the sidelines waiting for some sort of a 4th wave correction to start. Too many times I’ve tried to ride a 5th wave up, only for the count to change to “the 5th wave ended where I thought was end of the 3rd wave…” lol 🙂
Buying to open DIA August 10 255 strike puts for 1.5
UVXY August 31 10.00 strike calls for 0.90
Chris PM is showing life. Holding my call ratio backspread, and added a bull call vertical.
Did someone suggest CMCSA as a quality long set up a day ago?
Thank you Kevin – great call !
Guten Morgen!
I got the O.K. to share our FB earnings straddle with the members here before the close yesterday but for some reason I was unable to post so I am truly so sorry about that guys. It turned out to be our biggest trade this year as we juiced it with some options on futures. We see an even more bearish chart in Bezos and company and expect more carnage in the sector.
Have a great day trading everyone!
Nice score there Rabbit!!
A close trading friend of mine cashed $30k in put options last night in the after market. Ka-Ching!!!
As for AMZN, I dunno. That company is arguably unprecedented re: growth through adjacencies (i.e., automated groceries, AMZN for prescriptions, etc.). Best of luck!
Look at the chart….
Verne,
Agree on Amazon but timing has been tough. Look at SHOP as it might start downside sooner as air is getting thinner for it…jmho