
Upwards movement continues as the main Elliott wave count expects. Targets remain the same.
Summary: The Elliott wave count requires more upwards movement overall, but there are now warning signs that it could be wrong. Bearish divergence from the AD line, now for two days in a row, and Stochastics exhibiting bearish divergence while overbought suggest a bigger pullback may begin about here. But I am struggling to see a reasonably bearish wave count for the short term; the new hourly alternate would expect only a very little more downwards movement that must remain above 2,795.14.
Use the best fit channel on the daily chart for possible support for any deeper pullbacks. Pullbacks are an opportunity to join the trend.
The next short term target is about 2,878; a consolidation lasting about one to two weeks may be expected at about this target. Following that, another consolidation lasting about two weeks may be expected about 2,915.
The invalidation point may now be moved up to 2,743.26.
The mid to longer term target is at 2,922 (Elliott wave) or 3,045 (classic analysis). Another multi week to multi month correction is expected at one of these targets.
The final target for this bull market to end remains at 3,616.
Always practice good risk management. Always trade with stops and invest only 1-5% of equity on any one trade.
New updates to this analysis are in bold.
The biggest picture, Grand Super Cycle analysis, is here.
Last historic analysis with monthly charts is here, video is here.
ELLIOTT WAVE COUNT
WEEKLY CHART
Click chart to enlarge.
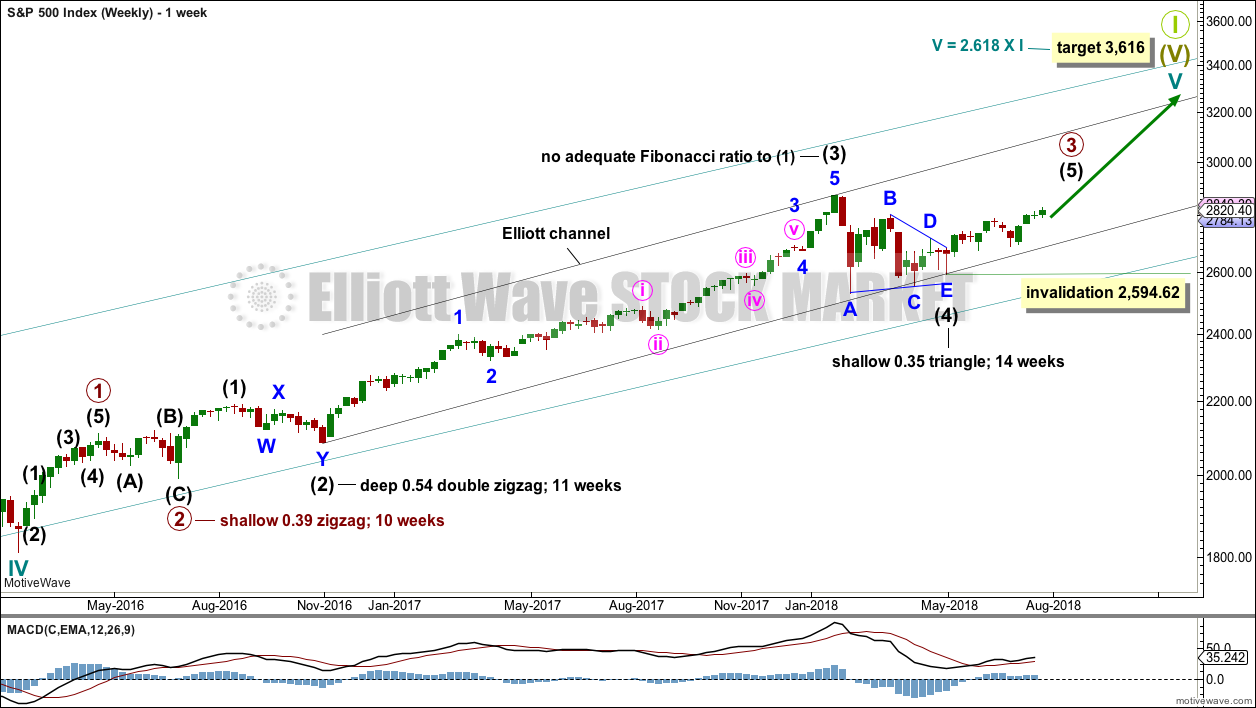
Cycle wave V must complete as a five structure, which should look clear at the weekly chart level and also now at the monthly chart level. It may only be an impulse or ending diagonal. At this stage, it is clear it is an impulse.
Within cycle wave V, the third waves at all degrees may only subdivide as impulses.
Intermediate wave (4) has breached an Elliott channel drawn using Elliott’s first technique. The channel is redrawn using Elliott’s second technique: the first trend line from the ends of intermediate waves (2) to (4), then a parallel copy on the end of intermediate wave (3). Intermediate wave (5) may end either midway within the channel, or about the upper edge.
Intermediate wave (4) may now be a complete regular contracting triangle lasting fourteen weeks, one longer than a Fibonacci thirteen. There is perfect alternation and excellent proportion between intermediate waves (2) and (4).
Within intermediate wave (5), no second wave correction may move beyond the start of its first wave below 2,594.62. However, the lower edge of the black Elliott channel drawn across the ends of intermediate degree waves should provide very strong support for any deeper pullbacks, holding price well above the invalidation point while intermediate wave (5) unfolds.
At this stage, the expectation is for the final target to me met in October 2019.
A multi week to multi month consolidation for primary wave 4 is expected on the way up to the final target.
The last bullish fifth wave of minor wave 5 to end intermediate wave (3) exhibited commodity like behaviour. It was strong and sustained. It is possible that the upcoming wave of minor wave 5 to end intermediate wave (5) to end primary wave 3 may exhibit similar behaviour, so we should be on the lookout for this possibility.
DAILY CHART
Click chart to enlarge.
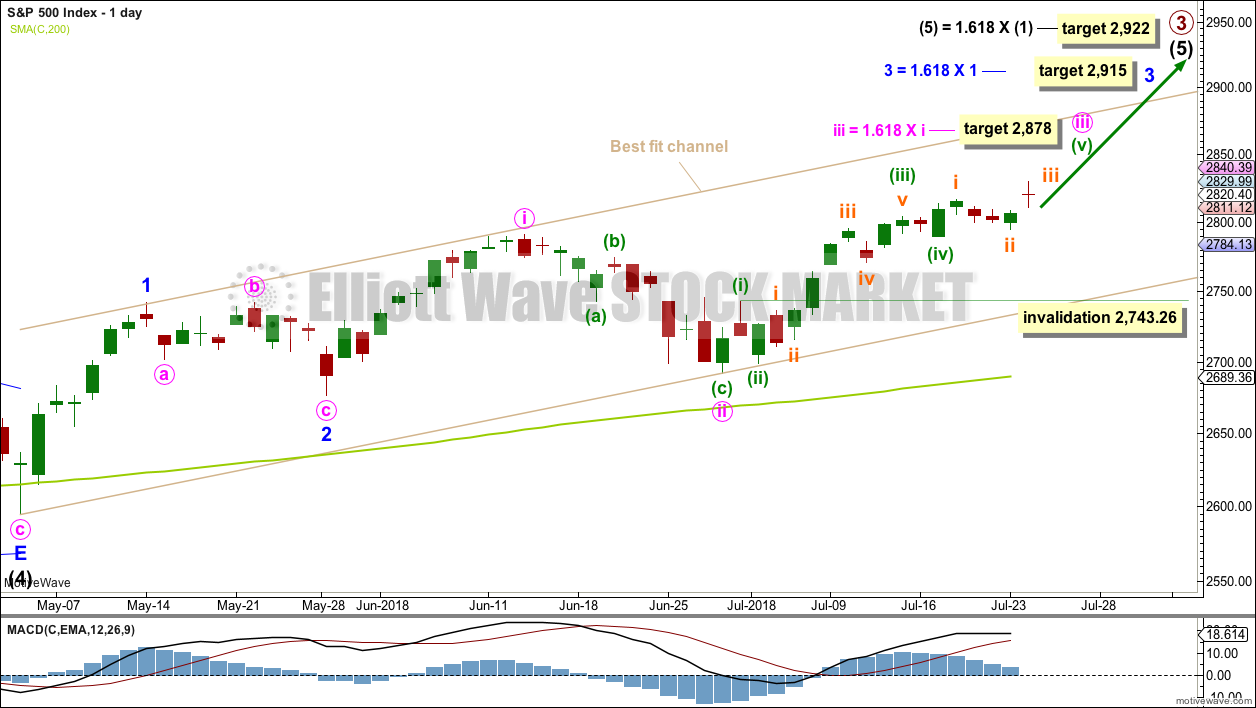
Intermediate wave (5) would be very likely to make at least a slight new high above the end of intermediate wave (3) at 2,872.87 to avoid a truncation.
Intermediate wave (3) exhibits no Fibonacci ratio to intermediate wave (1). It is more likely then that intermediate wave (5) may exhibit a Fibonacci ratio to either of intermediate waves (1) or (3). The most common Fibonacci ratio would be equality in length with intermediate wave (1), but in this instance that would expect a truncation. The next common Fibonacci ratio is used to calculate a target for intermediate wave (5) to end.
A target is now calculated for minute wave iii to end, which expects to see the most common Fibonacci ratio to minute wave i. Minute wave iii may last a few weeks. When it is complete, then minute wave iv may last about one to two weeks in order for it to exhibit reasonable proportion to minute wave ii. Minute wave iv must remain above minute wave i price territory.
Minute wave iii may have passed its middle strongest portion. It has still not moved far enough above the end of minute wave i yet to allow room for minute wave iv to unfold and remain above minute wave i price territory. For that to happen it looks like minuette wave (v) may be a relatively long extension, so that minute wave iii moves higher.
A target is calculated for minor wave 3 to end, which expects to see the most common Fibonacci ratio to minor wave 1. Minor wave 3 may last several weeks in total and should look like an impulse at the daily chart level. When it is complete, then minor wave 4 may last about one to two weeks in order for it to exhibit reasonable proportion to minor wave 2. Minor wave 4 must remain above minor wave 1 price territory.
Within minute wave iii, minuette wave (i) is complete as labelled. Minuette wave (iv), if it continues lower, may not move into minuette wave (i) price territory below 2,743.26. The invalidation point will be left at the high of minuette wave (i) to allow for the possibility that minuette wave (iii) may have ended at today’s high and minuette wave (iv) may now unfold.
A best fit channel is added in taupe to this chart. It contains all of intermediate wave (5) so far. The lower edge may provide support for any deeper pullbacks. The upper edge may provide resistance.
HOURLY CHART

Click chart to enlarge.
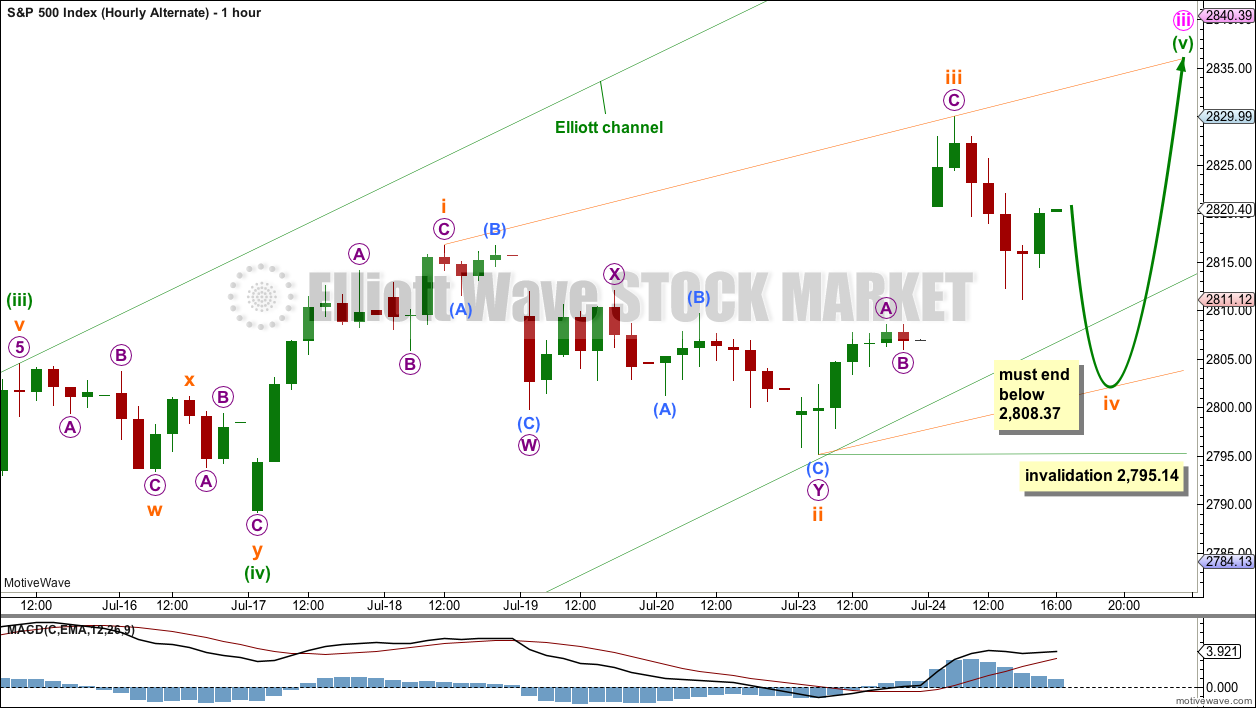
I have tried today to find an Elliott wave count with labelling that shows minuette wave (iii) over at today’s high, but thus far there is nothing I can see with reasonable proportions. My conclusion for the short term is that minuette wave (v) is most likely still unfolding higher.
The target for minute wave iii to end is now widened to a rather large 6 point zone, now calculated at two degrees. Favour the lower edge of the target zone as it is calculated at a lower degree.
When subminuette waves i, ii, iii and iv within minuette wave (v) are complete, then the target may be calculated at a third degree. At that stage, it may be refined to a smaller range.
The target for minute wave iii to end would see it move far enough above the end of minute wave i to allow room for minute wave iv to unfold and remain above minute wave i price territory.
Minuette wave (v) may end about the upper edge of the green Elliott channel. If it behaves like a commodity, then it is possible it could overshoot the upper edge of the channel.
Minuette wave (v) may only be either an impulse or an ending diagonal. This main hourly wave count looks at the possibility of an impulse, which is more common.
Within the impulse, subminuette waves i and ii may be complete and subminuette wave iii may be complete with one new high tomorrow. Subminuette wave iii may only subdivide as an impulse.
Within subminuette wave iii, micro wave 4 may not move into micro wave 1 price territory below 2,808.59.
When a new high may be the end of subminuette wave iii, then the invalidation point for this main hourly wave count must move up to the high of subminuette wave i at 2,814.19. A quick correction for subminuette wave iv may not move back into subminuette wave i price territory.
ALTERNATE HOURLY CHART
Click chart to enlarge.
The other structural possibility for minuette wave (v) is an ending diagonal.
Within this possible ending diagonal, subminuette wave iii is longer than subminuette wave i. This indicates an expanding diagonal.
Within an expanding diagonal, subminuette wave iv must be longer than subminuette wave ii, so it must end below 2,808.37 where it would reach only equality with subminuette wave ii. Subminuette wave iv would most likely end reasonably below this point, so that the diagonal trend lines diverge to meet all Elliott wave rules. Subminuette wave iv may not move beyond the end of subminuette wave ii below 2,795.14.
This wave count now expects downwards movement tomorrow, which has support from two days in a row now of bearish divergence between price and the AD line.
TECHNICAL ANALYSIS
WEEKLY CHART
Click chart to enlarge. Chart courtesy of StockCharts.com.
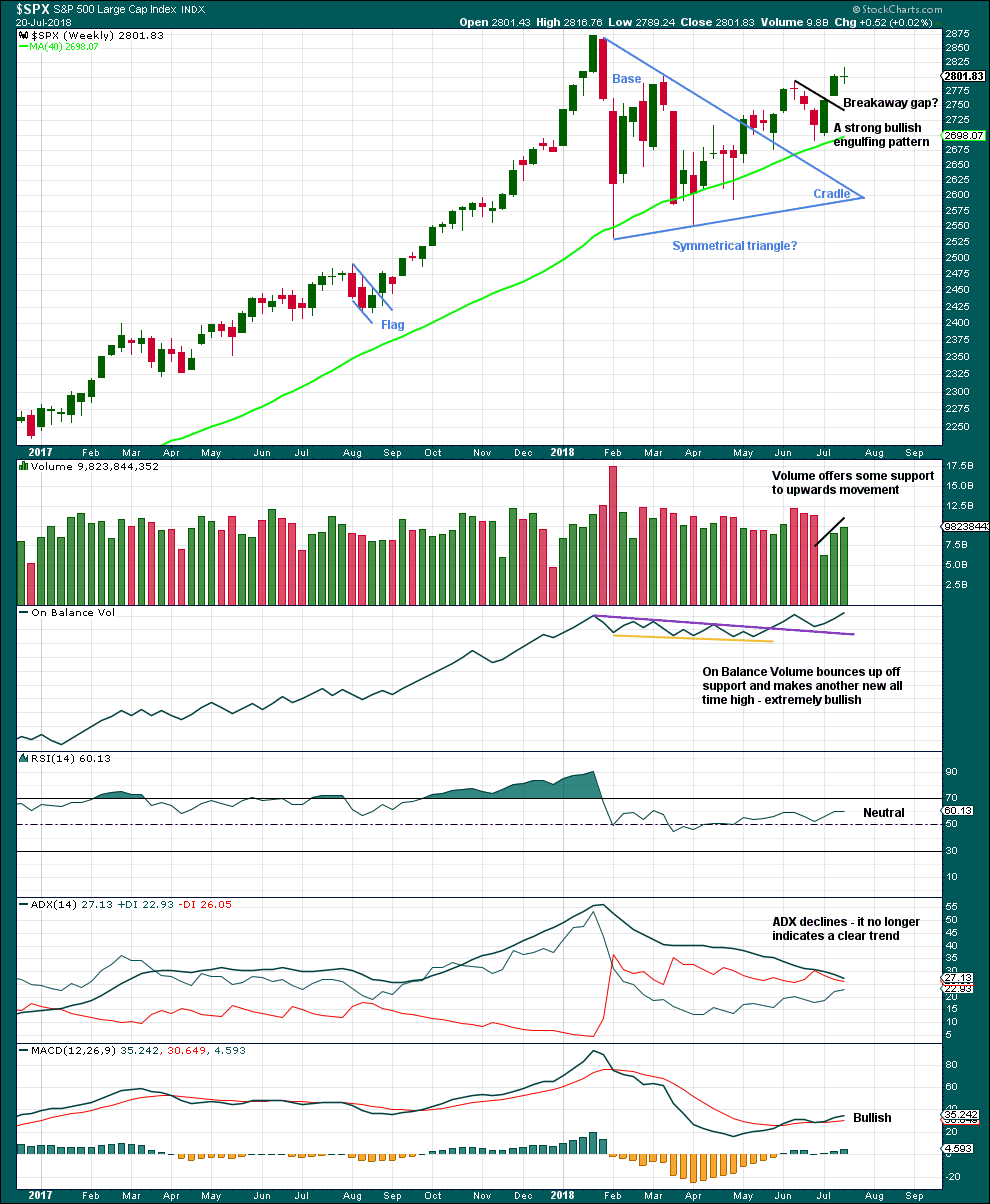
Much weight will be given in this analysis to the new all time high from On Balance Volume. Price usually follows where On Balance Volume leads. It is very reasonable here to expect a new all time high from price in coming weeks.
With volume also supporting another upwards week, this chart is very bullish.
The doji candlestick this week on its own is not a reversal signal. Doji represent a pause and can occur within a trend. There are a few examples in the prior bull run of doji on the weekly chart which were followed by more upwards movement and no reasonable pullback.
DAILY CHART
Click chart to enlarge. Chart courtesy of StockCharts.com.
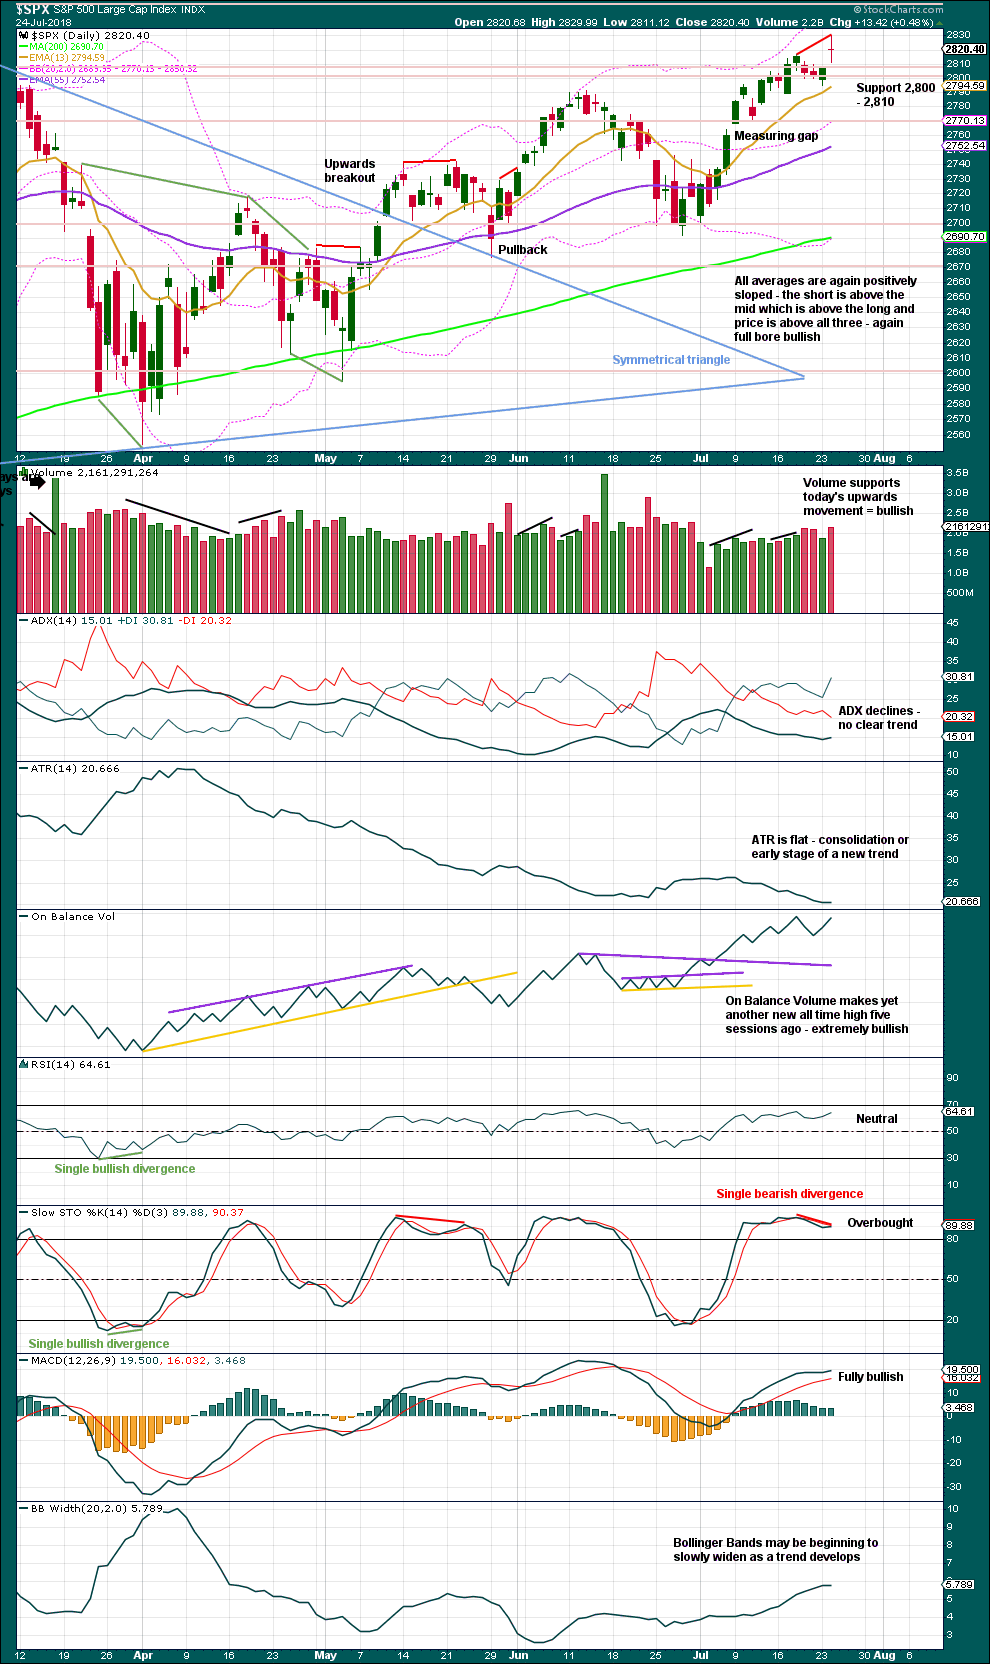
The symmetrical triangle may now be complete. The base distance is 340.18. Added to the breakout point of 2,704.54 this gives a target at 3,044.72. This is above the Elliott wave target at 2,922, so the Elliott wave target may be inadequate.
Since the low on the 2nd of April, 2018, price has made a series of higher highs and higher lows. This is the definition of an upwards trend. But trends do not move in perfectly straight lines; there are pullbacks and bounces along the way. A higher high last week adds some confidence to this trend.
The measuring gap gives a short term target at 2,838. The gap has offered support. It remains open, and the target remains valid. This target may be now met in another one to very few days.
There is room still for price to continue higher: On Balance Volume remains extremely bullish, and RSI is not yet overbought.
Stochastics is now overbought and exhibits clear divergence with price; this is a warning that upwards movement could be over here or very soon. Stochastics may exhibit multiple bearish divergence before a high is in place.
The balance of volume was upwards today; upwards movement within the session has support from rising volume. The doji candlestick on its own is only a pause, not a reversal pattern.
VOLATILITY – INVERTED VIX CHART
WEEKLY CHART
Click chart to enlarge. Chart courtesy of StockCharts.com. So that colour blind members are included, bearish signals
will be noted with blue and bullish signals with yellow.
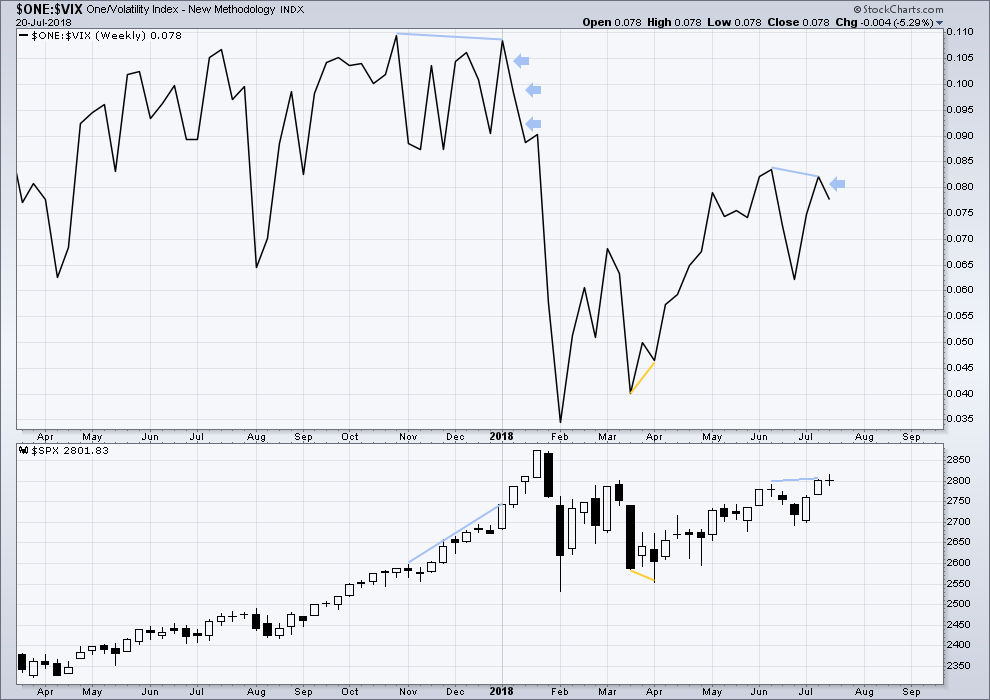
To keep an eye on the all time high for inverted VIX a weekly chart is required at this time.
Notice how inverted VIX has very strong bearish signals four weeks in a row just before the start of the last large fall in price. At the weekly chart level, this indicator may be useful again in warning of the end of primary wave 3.
Price moved higher last week, but inverted VIX moved lower. This divergence is bearish. A single week of this bearish divergence is not a very loud warning though.
DAILY CHART
Click chart to enlarge. Chart courtesy of StockCharts.com. So that colour blind members are included, bearish signals
will be noted with blue and bullish signals with yellow.
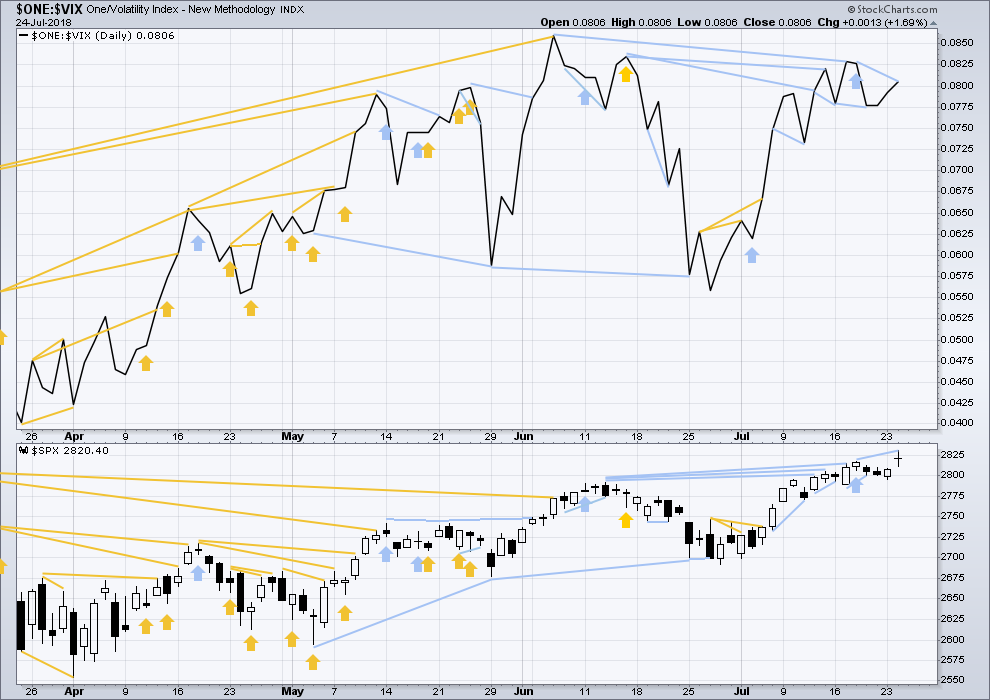
Normally, volatility should decline as price moves higher and increase as price moves lower. This means that normally inverted VIX should move in the same direction as price.
Price has made a new high today above the prior high five sessions ago, but inverted VIX has not. This short term divergence is bearish.
BREADTH – AD LINE
WEEKLY CHART
Click chart to enlarge. Chart courtesy of StockCharts.com.
When primary wave 3 comes to an end, it may be valuable to watch the AD line at the weekly time frame as well as the daily.
At this stage, there is very strong bullish divergence between price and the AD line at the weekly time frame. With the AD line making new all time highs, expect price to follow through with new all time highs in coming weeks.
Yet another new all time high last week from the AD line is again extremely bullish.
DAILY CHART
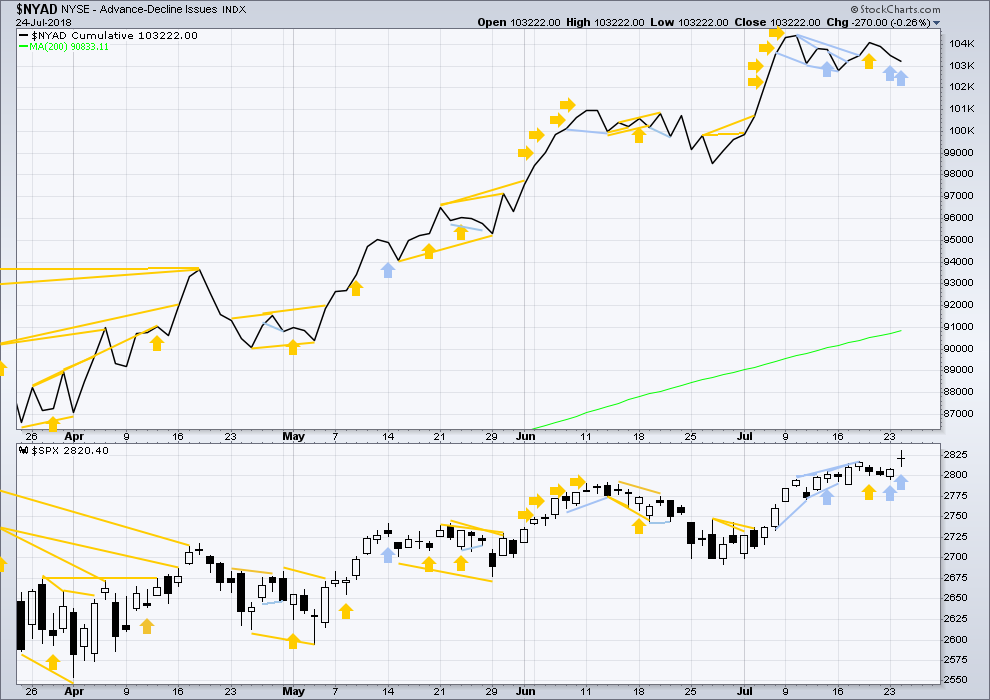
Click chart to enlarge. Chart courtesy of StockCharts.com.
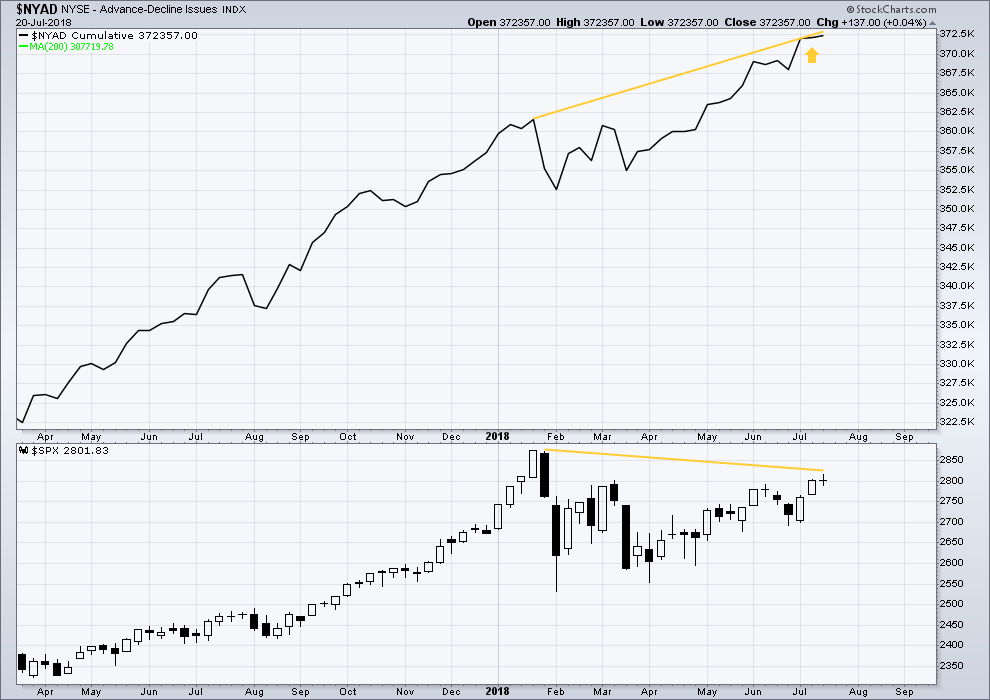
There is normally 4-6 months divergence between price and market breadth prior to a full fledged bear market. This has been so for all major bear markets within the last 90 odd years. With no longer term divergence yet at this point, any decline in price should be expected to be a pullback within an ongoing bull market and not necessarily the start of a bear market. New all time highs from the AD line means that any bear market may now be an absolute minimum of 4 months away. It may of course be a lot longer than that. My next expectation for the end of this bull market may now be October 2019.
Breadth should be read as a leading indicator.
Overall, recent new all time highs from the AD line remain extremely bullish for the longer term trend.
Price may reasonably be expected to follow through in coming weeks.
Price has moved higher for two days in a row now, but market breadth has declined. This divergence is bearish for the short term.
Small caps have made another slight new all time high today, but they now look bearish for the short term with a huge bearish engulfing candlestick pattern. Mid caps made a new all time high. Only large caps have to follow through; they do usually lag in the latter stages of a bull market.
DOW THEORY
The following lows need to be exceeded for Dow Theory to confirm the end of the bull market and a change to a bear market:
DJIA: 23,360.29.
DJT: 9,806.79.
S&P500: 2,532.69.
Nasdaq: 6,630.67.
Only Nasdaq at this stage is making new all time highs, with another new all time high on Friday of last week. DJIA and DJT need to make new all time highs for the ongoing bull market to be confirmed.
Charts showing each prior major swing low used for Dow Theory may be seen at the end of this analysis here.
Published @ 09:00 p.m. EST.
How about that vertical spike in the last half hour of trading?
Looks like FB missed earnings though, which brought a prompt 60 point dive for /NQ. AMZN tomorrow is the last FANG to report. Could determine whether we see ATHs sooner rather than later.
Goodness me. Blow-off top?
Possibly. News leaked that Trump and the EU reached a deal that averts an escalation of the trade war. If it’s substantive we may still have a ways to go. If it amounts to nothing, and if AMZN misses earnings tomorrow, look out below.
hourly chart updated: subminuette iii could now be over. submineutte iv may not move into subminuette i price territory, the invalidation point is moved up now to 2,814.19.
subminuette ii showed up on the daily chart lasting 3 sessions so subminuette iv could also show up on the daily chart.
we could be about to have one to four days of consolidation just ahead.
SPX 2853 (1.618% extension of prior upswing) will pause this market at the very least. I expect several hours consolidation under it, minimum, possibly . You can probably trade off it…I might.
There’s also a symmetric projection at 2843 that could prove to be resistance, as well as 2863. Then the ATH 2873. So it’s really just a mine field of resistance up ahead 20 points. Expect a iv to kick in once there.
Almost there … just another 10 points to 2,843
thanks for your comments and charts today Kevin, it is much appreciated
no thank you for being my muse! I couldn’t trade with the confidence I’ve developed without your diligent work sitting in front of me.
bingo bango bongo week for me mon-tues-wed. Here’s to two more!!! I hope everyone is doing well, taking profits or watching them accumulate.
I have gotten my short term day trading positions to zero here. I’m to the point of taking really short term bites (trading at the 5/1 min chart level), anticipating a larger consolidation starting up reasonably soon. Rather ride that down without baggage!!
I share your sentiment. Lara’s guidance has been absolutely invaluable for me as develop my trading system. I took some profits yesterday and again this afternoon–this vertical S&P spike got someone to bite on a few of my sell orders. Apparently there’s news the USA-EU trade talks went well. Will be interesting to see whether this sticks.
That’s really lovely to hear guys! Thank you for your continued support of my work, this kind of positive feedback makes my day and makes me want to work harder for you all.
For several months now I’ve been holding BLUE. I constantly sell premium against it, sometimes selling calls way up at 190 or 200, sometimes selling puts down at 160 or so. Because BLUE’s volatility is sky high, the price of time premium is sky high, so the return on selling it is sky high. So far it’s all worked out well for me. You have to expect the underlying value will jackhammer all over though, and be okay with it! Another warning: earnings come out around Aug 1.
XLE continuing to send signals of moving up. Hourly squeeze complete with upward movement. Daily squeeze still on, and upward movement. I’m long, as well as long (sold a put) on XOM (the largest XLE component).
CMCSA is in a nice steep correction, and approaching overlapped fibonacci support (32.7-32.9). The daily trend is still up. However, the weekly is arguably in a down trend, so…it’s a mixed up market, really. That said, I would expect at a minimum a decent bounce upcoming, enough for a good bite on the long side. Set up approaching….
well whaddayaknow! CMCSA just dropped into the fibo range and bounced back up out of it. I’m in, bull call spread, Sept expiry, 32.5/35. Not a recommendation, your results may vary.
Days like this in the market must be what is meant by the term “dog days of summer”. That said, after yesterday, and the continuing bull market…I’m not complaining. Still up a bit today, at 1/2 of daily profit target. I could take profitable positions to make it up but that would be counter productive, those need to mature into “more”. Another little push in the market this afternoon and I’ll get the second 1/2 of my target, got a few SPY options for just that purpose.
who said this market was slow? I didn’t say that….false news!
I am seriously considering taking some kind of short position on COST. Highly counter trend, but it’s extremely extended in price, and ready for a breather as I see it. The current hourly action is riding a trend line up, and now squeezing. I may short on a break of the 23% fibo and trend line (which will also polarity invert the swing hi/lo structure back to “down”). My target for unit 1 would be to get to the 61% at 211.6. Unit 2, runner for more with a BE stop. We’ll see this all plays out.
TLT failed at the critical 122.50 zone, and the price action strongly supported the secular down trend thesis in recent action. It’s in a giant trading range now from 116 to 122.50, and at the moment moving up…but the daily trend is definitely down. So I’m watching closely for another good short entry. I’ve been using “synthetic shorts”, buying pretty far out in time (Oct or Dec) puts that are way in the money, with a delta around 0.85. I like that particular weapon. I also hold a put I bought relatively cheap quite awhile ago at 116, it’s underwater but if price can get down to the bottom of this range at 116 it’ll be much prettier.
Suggestions that TLT is going to 128 are pretty much DOA, IMO. Yes it will, someday. Not this year, nor even this decade, me thinks.
What the heck is going on with INTC? Down about 2%. Kevin, what do you think of this at these levels? Earnings are due tomorrow after market close…
I exited my bull call spread on INTC this morning for a small loss. Don’t like this action at all. Mistake to have entered with earnings so close.
That all said, there’s excellent support down at 48, multiple fibos and a major pivot low. A bounce at/after earnings off one of the fibo’s below could be a good entry, as the weekly/month TF’s are strongly bullish.
Looks like INTC has reversed leaving behind a massive long lower wick. Depends on how it closes of course. But earnings may take it to its next leg up also. Who knows. Lol.
But thanks for the info on this and your other posts and updates
you are welcome Ari. If all I did was sit and look at these silly screen I’d go nuts. Gotta yack. And prove I’m nuts, lol!!! Writing down why I’m doing things is helpful, because if I can’t explain in detail why I’m taking a trade and feel confident in my reasoning…maybe I shouldn’t be taking it? There have been times I’ve ended with “delete this and forget this trade!!!”. So it’s valuable to me too. And it’s a thrill when occasionally I help someone make some coin.
My $0.02 to add is that the high today is in no-man’s land. Not as I see it a likely price for a significant pivot. The market likes pivots that reinforce and add new fractal relationships. Above a bit more are the 1.62% extension, two symmetric projection levels, and of course the ATH. I suspect price is going to get up in that zone (2853-73) before any significant sell off starts now. The test was the “retest” of the 2790 zone a day or two ago. The market survived it. We yet another retest is possible, I’ll be very surprised by a break below it.
“Trust in the count Luke!!”
Here’s the view showing what I expect as the next likely turn zone up above (white lines are symmetric projection levels, blue is the 1.62% extension, and the green is the ATH). I want to see (and expect to see) price on this daily chart continuing to ride above the trend line shown, and the 5 period EMA shown as well. Breaks of either (full bar) will cause me to change my tactics quickly.