Yesterday’s analysis warned that a short term pullback may occur to about 2,764. The market did gap open lower, but only to 2,789.24. Thereafter, upwards movement has resumed as the bigger picture expected.
Summary: Overall, expect the upwards trend to continue. Some support from volume today and a new all time high again from On Balance Volume on the daily chart support this view.
There remains bearish divergence between price and the AD line though. If my analysis is wrong for the short term, there may be a pullback to last a very few days coming up sooner than expected.
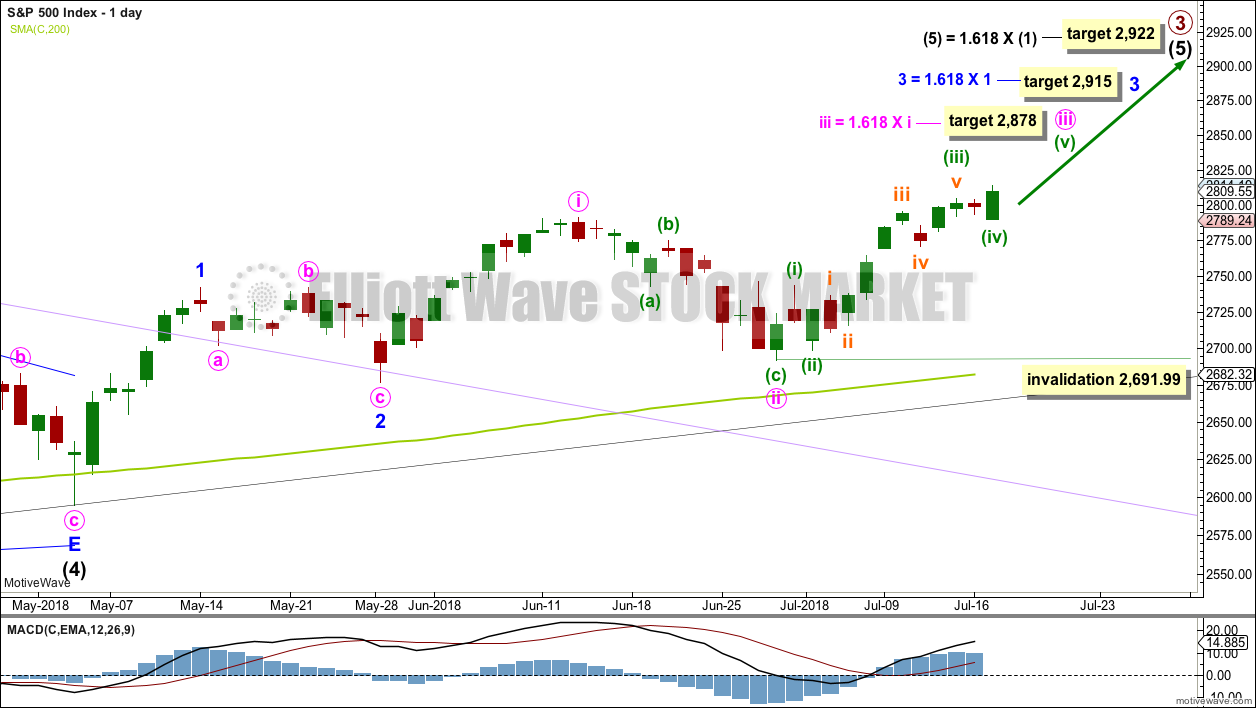
The next short term target is about 2,878; a consolidation lasting about one to two weeks may be expected at about this target. Following that, another consolidation lasting about two weeks may be expected about 2,915.
The invalidation point may now be moved up to the last swing low at 2,691.99.
The mid to longer term target is at 2,922 (Elliott wave) or 3,045 (classic analysis). Another multi week to multi month correction is expected at one of these targets.
The final target for this bull market to end remains at 3,616.
Pullbacks are an opportunity to join the trend.
Always practice good risk management. Always trade with stops and invest only 1-5% of equity on any one trade.
New updates to this analysis are in bold.
The biggest picture, Grand Super Cycle analysis, is here.
Last historic analysis with monthly charts is here, video is here.
ELLIOTT WAVE COUNT
WEEKLY CHART
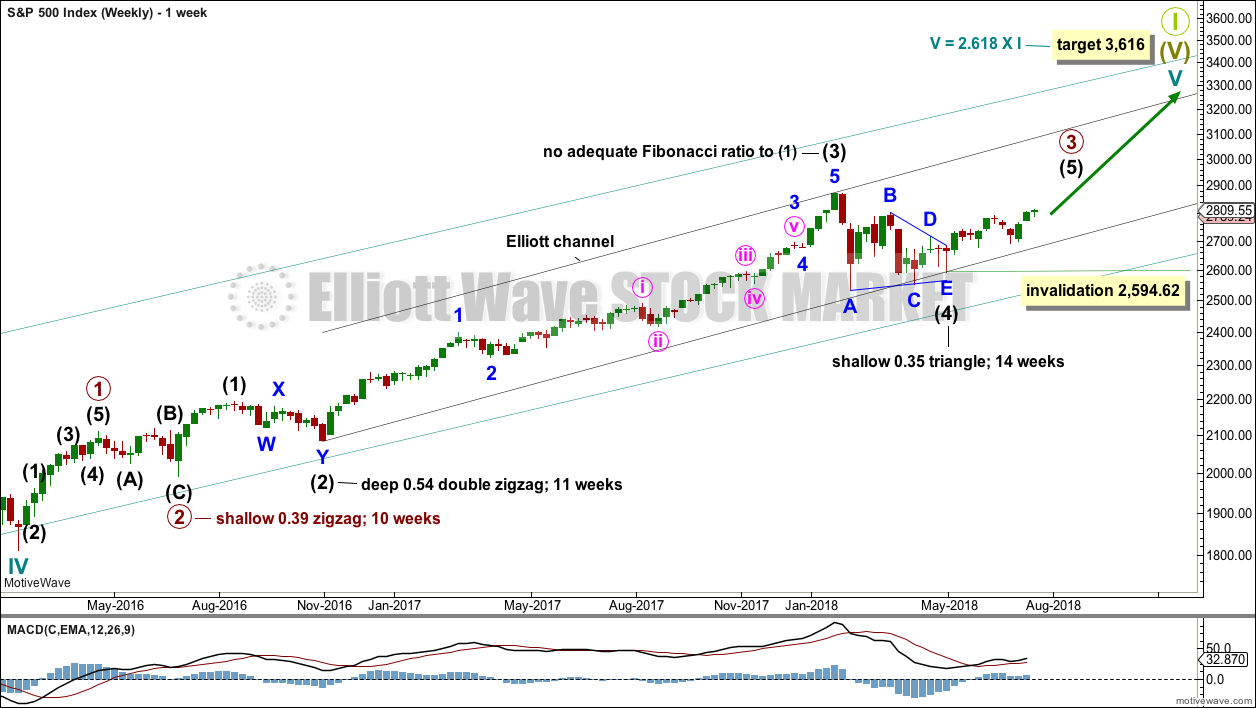
Cycle wave V must complete as a five structure, which should look clear at the weekly chart level and also now at the monthly chart level. It may only be an impulse or ending diagonal. At this stage, it is clear it is an impulse.
Within cycle wave V, the third waves at all degrees may only subdivide as impulses.
Intermediate wave (4) has breached an Elliott channel drawn using Elliott’s first technique. The channel is redrawn using Elliott’s second technique: the first trend line from the ends of intermediate waves (2) to (4), then a parallel copy on the end of intermediate wave (3). Intermediate wave (5) may end either midway within the channel, or about the upper edge.
Intermediate wave (4) may now be a complete regular contracting triangle lasting fourteen weeks, one longer than a Fibonacci thirteen. There is perfect alternation and excellent proportion between intermediate waves (2) and (4).
Within intermediate wave (5), no second wave correction may move beyond the start of its first wave below 2,594.62.
At this stage, the expectation is for the final target to me met in October 2019.
A multi week to multi month consolidation for primary wave 4 is expected on the way up to the final target.
DAILY CHART
It is possible that intermediate wave (4) is a complete regular contracting triangle, the most common type of triangle. Minor wave E may have found support just below the 200 day moving average and ending reasonably short of the A-C trend line. This is the most common look for E waves of triangles.
Intermediate wave (3) exhibits no Fibonacci ratio to intermediate wave (1). It is more likely then that intermediate wave (5) may exhibit a Fibonacci ratio to either of intermediate waves (1) or (3). The most common Fibonacci ratio would be equality in length with intermediate wave (1), but in this instance that would expect a truncation. The next common Fibonacci ratio is used to calculate a target for intermediate wave (5) to end.
Price has clearly broken out above the upper triangle B-D trend line. This indicates that it should now be over if the triangle is correctly labelled.
A trend line in lilac is added to this chart. It is the same line as the upper edge of the symmetrical triangle on the daily technical analysis chart. Price found support about this line.
A target is now calculated for minute wave iii to end, which expects to see the most common Fibonacci ratio to minute wave i. Minute wave iii may last a few weeks. When it is complete, then minute wave iv may last about one to two weeks in order for it to exhibit reasonable proportion to minute wave ii. Minute wave iv must remain above minute wave i price territory.
Minute wave iii may have passed its middle strongest portion a few days ago. Although the structure could possibly be seen as complete at today’s high, it has still not moved far enough above the end of minute wave i yet to allow room for minute wave iv to unfold and remain above minute wave i price territory. For that to happen it looks like minuette wave (v) may be a relatively long extension, so that minute wave iii moves higher.
A target is calculated for minor wave 3 to end, which expects to see the most common Fibonacci ratio to minor wave 1. Minor wave 3 may last several weeks in total and should look like an impulse at the daily chart level. When it is complete, then minor wave 4 may last about one to two weeks in order for it to exhibit reasonable proportion to minor wave 2. Minor wave 4 must remain above minor wave 1 price territory.
The last bullish fifth wave of minor wave 5 to end intermediate wave (3) (this can be seen on the weekly chart now) exhibited commodity like behaviour. It was strong and sustained. It is possible that the upcoming wave of minor wave 5 to end intermediate wave (5) to end primary wave 3 may exhibit similar behaviour, so we should be on the lookout for this possibility.
HOURLY CHART
This will be the only hourly wave count published today. I will keep the alternate updated and will publish it again if it diverges, but for now this main wave count has the best look and best Fibonacci ratios.
The target for minute wave iii to end is now widened to a rather large 6 point zone, now calculated at two degrees. Favour the lower edge of the target zone as it is calculated at a lower degree.
The target for minute wave iii to end would see it move far enough above the end of minute wave i to allow room for minute wave iv to unfold and remain above minute wave i price territory.
Minuette wave (v) may end about the upper edge of the green Elliott channel. If it behaves like a commodity, then it is possible it could overshoot the upper edge of the channel.
Within minuette wave (v), no second wave correction may move beyond the start of its first wave below 2,789.24.
TECHNICAL ANALYSIS
WEEKLY CHART
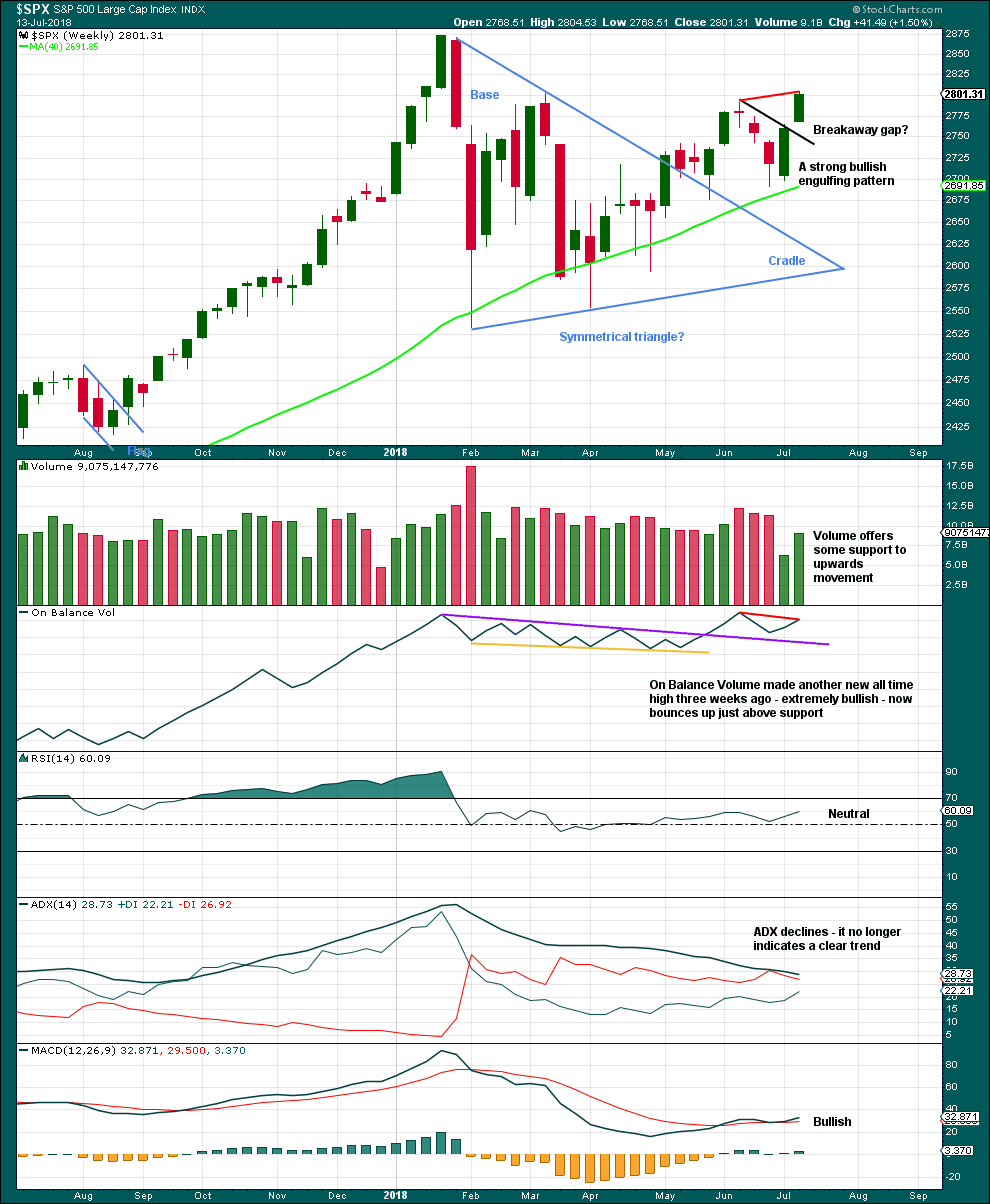
Click chart to enlarge. Chart courtesy of StockCharts.com.
Because the week before last moved price higher but had lighter volume due to the 4th of July holiday, this may affect On Balance Volume. The short term bearish divergence between price and On Balance Volume noted on the chart may not be very significant for this reason.
What may be more significant is another strong upwards week and a gap that may be a breakaway gap. This gap may offer support; breakaway gaps remain open.
DAILY CHART
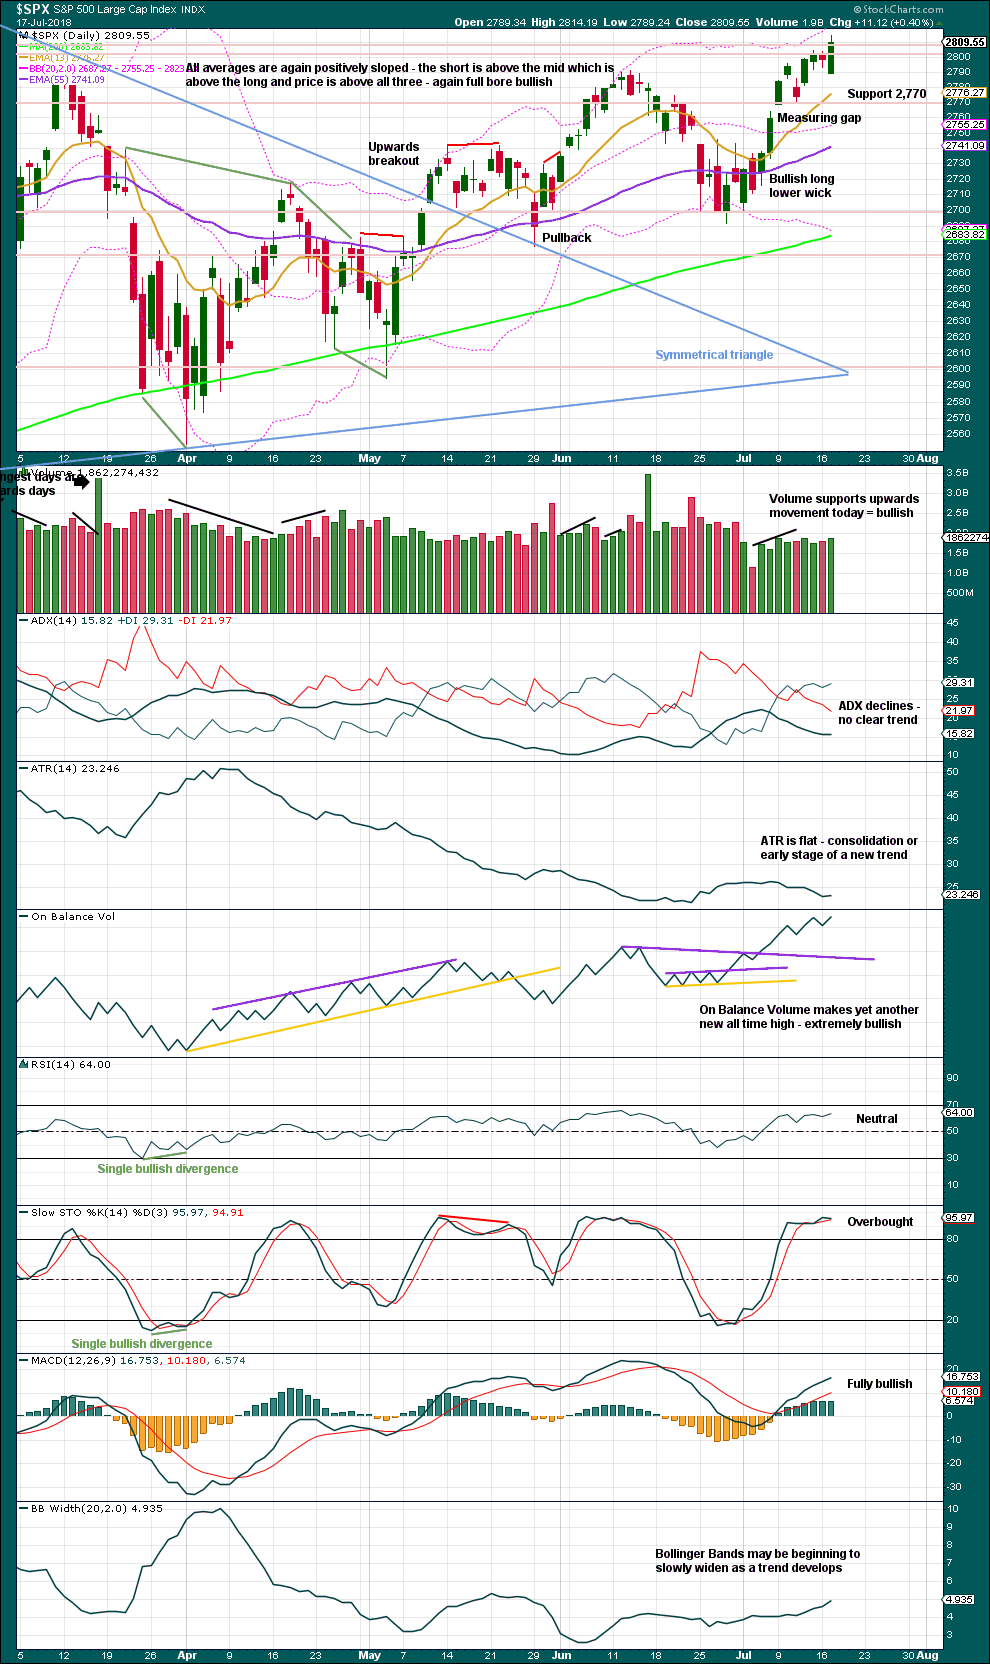
Click chart to enlarge. Chart courtesy of StockCharts.com.
The symmetrical triangle may now be complete. The base distance is 340.18. Added to the breakout point of 2,704.54 this gives a target at 3,044.72. This is above the Elliott wave target at 2,922, so the Elliott wave target may be inadequate.
Since the low on the 2nd of April, 2018, price has made a series of higher highs and higher lows. This is the definition of an upwards trend. But trends do not move in perfectly straight lines; there are pullbacks and bounces along the way. A higher high at the end of last week adds some confidence to this trend.
The measuring gap gives a short term target at 2,838. The gap has offered support. It remains open, and the target remains valid.
On Balance Volume remains extremely bullish with yet another new all time high today on the daily chart.
Stochastics may remain overbought for long periods of time when this market has a strong bullish trend. Only when it reaches overbought and then exhibits clear divergence with price, then it may be useful as an indicator of a possible high in place. That is not the case yet.
VOLATILITY – INVERTED VIX CHART
WEEKLY CHART
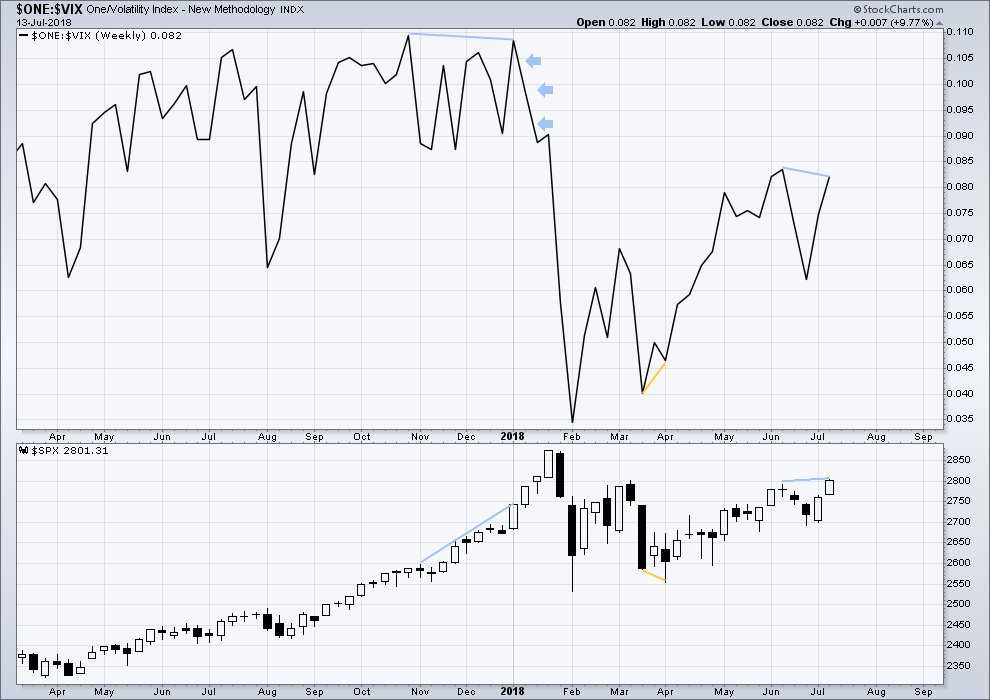
Click chart to enlarge. Chart courtesy of StockCharts.com. So that colour blind members are included, bearish signals
will be noted with blue and bullish signals with yellow.
To keep an eye on the all time high for inverted VIX a weekly chart is required at this time.
Notice how inverted VIX has very strong bearish signals four weeks in a row just before the start of the last large fall in price. At the weekly chart level, this indicator may be useful again in timing the end of primary wave 3.
There is now short term bearish divergence between price and inverted VIX. This divergence is seen on both weekly and daily time frames. It is not very strong.
DAILY CHART
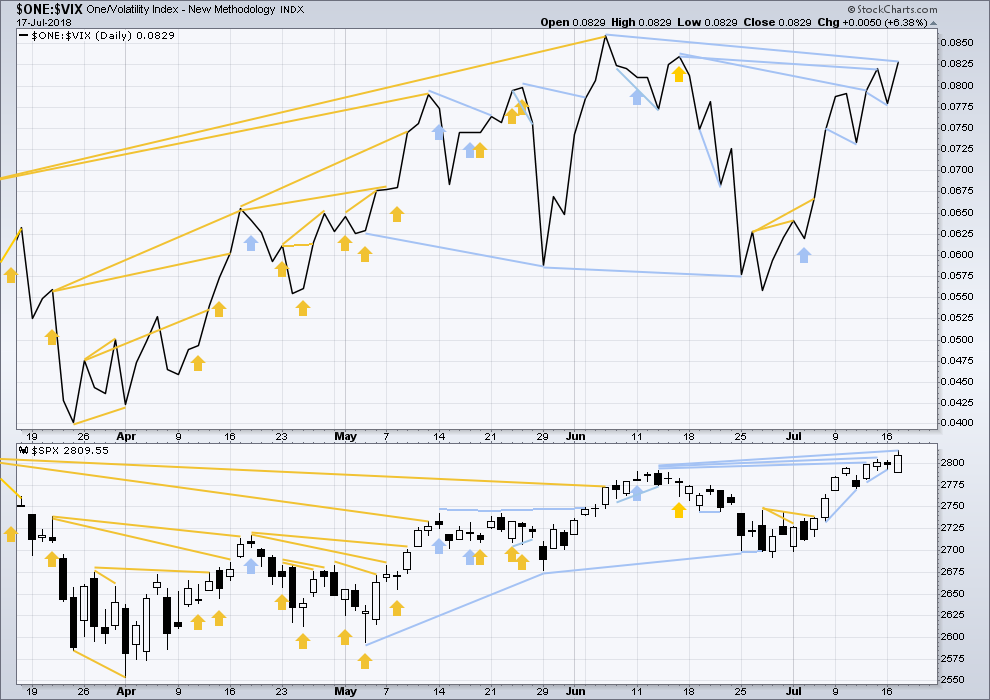
Click chart to enlarge. Chart courtesy of StockCharts.com. So that colour blind members are included, bearish signals
will be noted with blue and bullish signals with yellow.
Normally, volatility should decline as price moves higher and increase as price moves lower. This means that normally inverted VIX should move in the same direction as price.
There is still some mid term bearish divergence between price and inverted VIX: price has made new highs above the prior swing high, but inverted VIX has not. Mid term divergence is not as reliable lately though as short term divergence.
BREADTH – AD LINE
WEEKLY CHART
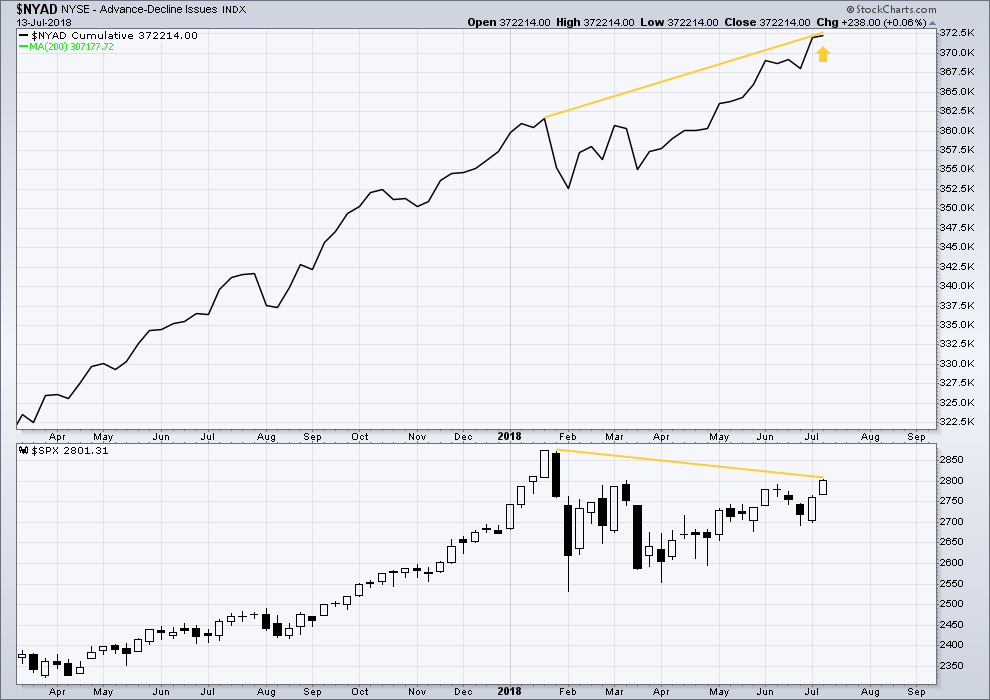
Click chart to enlarge. Chart courtesy of StockCharts.com.
When primary wave 3 comes to an end, it may be valuable to watch the AD line at the weekly time frame as well as the daily.
At this stage, there is very strong bullish divergence between price and the AD line at the weekly time frame. With the AD line making new all time highs, expect price to follow through with new all time highs in coming weeks.
DAILY CHART
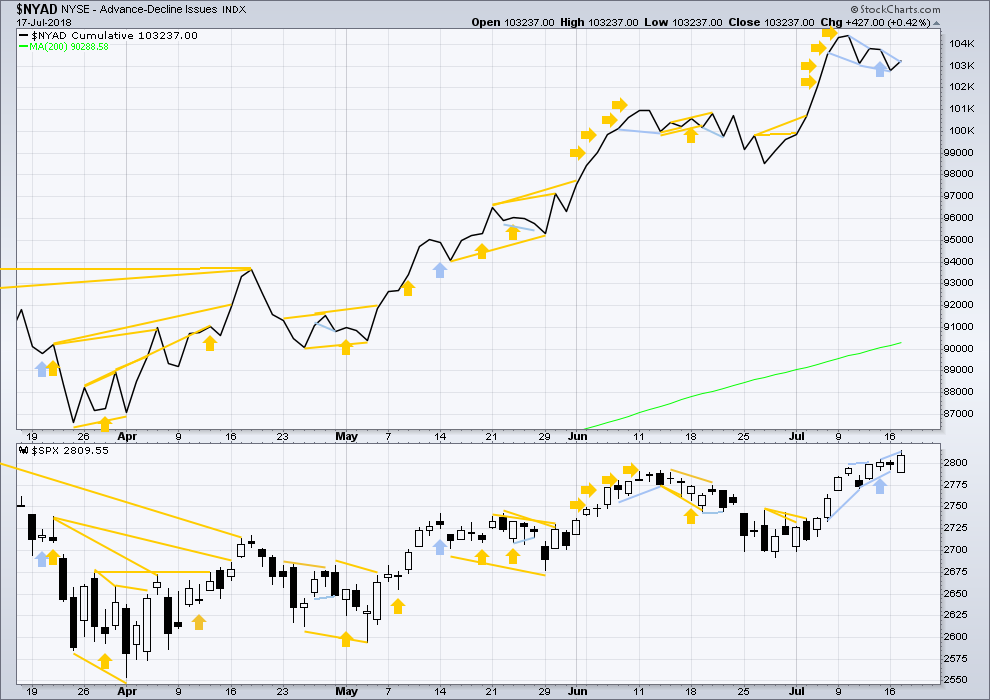
Click chart to enlarge. Chart courtesy of StockCharts.com.
There is normally 4-6 months divergence between price and market breadth prior to a full fledged bear market. This has been so for all major bear markets within the last 90 odd years. With no longer term divergence yet at this point, any decline in price should be expected to be a pullback within an ongoing bull market and not necessarily the start of a bear market. New all time highs from the AD line means that any bear market may now be an absolute minimum of 4 months away. It may of course be a lot longer than that. My next expectation for the end of this bull market may now be October 2019.
Breadth should be read as a leading indicator.
Overall, recent new all time highs from the AD line remain extremely bullish for the longer term trend.
Price may reasonably be expected to follow through in coming weeks.
There is again short term bearish divergence between price and the AD line: price made a new high above the prior high two sessions ago, but the AD line has not made a corresponding new high. This short term divergence may be resolved by one or two days of downwards movement.
DOW THEORY
The following lows need to be exceeded for Dow Theory to confirm the end of the bull market and a change to a bear market:
DJIA: 23,360.29.
DJT: 9,806.79.
S&P500: 2,532.69.
Nasdaq: 6,630.67.
Only Nasdaq at this stage is making new all time highs. DJIA and DJT need to make new all time highs for the ongoing bull market to be confirmed.
Charts showing each prior major swing low used for Dow Theory may be seen at the end of this analysis here.
Published @ 10:32 p.m. EST.

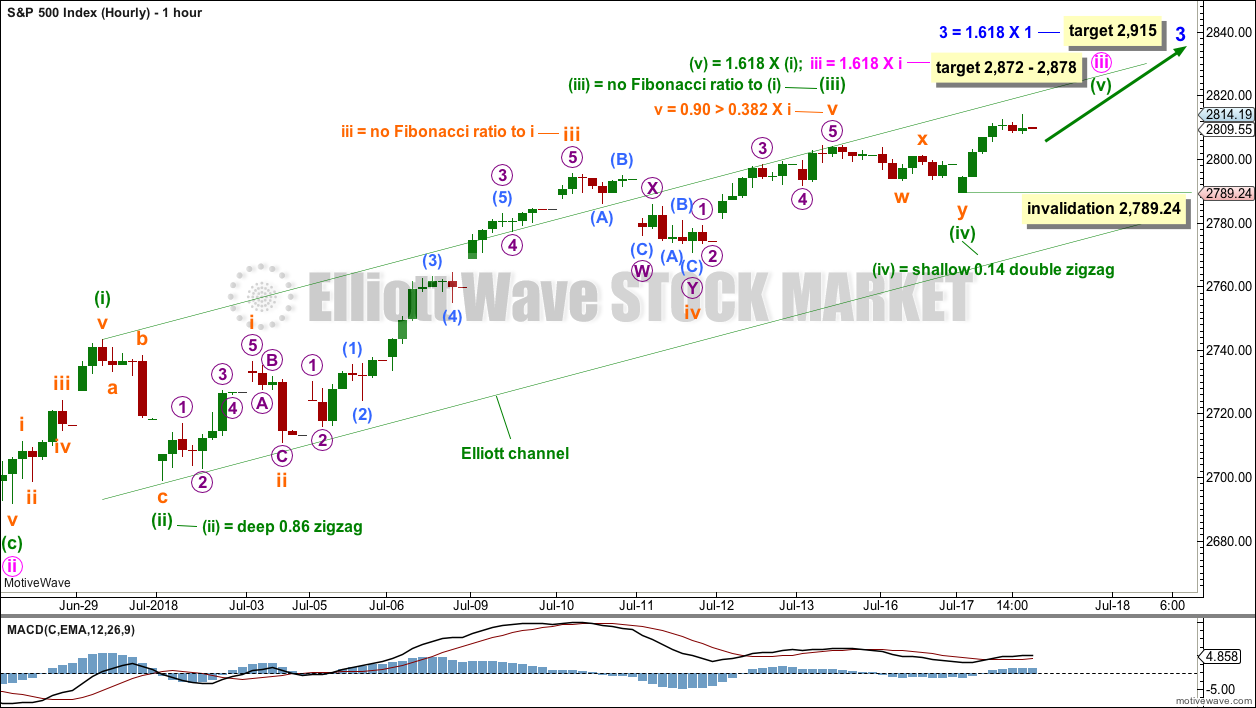
updated hourly chart:
there may now be two first and second waves complete, within this fifth wave of minuette (v) to end minute iii.
that means we may see some increase in upwards momentum tomorrow
it looks like this session is going to close upwards, with a slightly long lower wick but a small real body.
that’s fairly bullish
it means On Balance Volume on the daily chart will make another new all time high
the AD line will move up probably, but not to yet another new all time high so there will still be bearish divergence
I’ll put more weight right here and now on On Balance Volume
I think we need just a few more days of upwards movement at least for minute iii to move far enough above minute i to allow for minute iv to have room to unfold.
ES flew a bull flag today. Target at least 2840.00
Maybe I will get another pop out of those 281 SPY calls after all!
See ya later all!
this must be one of the slowest third waves in history!!
The daily is continuing to ride above the 5 period ema. That’s pretty strong, actually (and any breaking down through it with authority will be a key trigger that its likely over for a bit larger swing down). I know it feels sluggish during the pause/retrace periods.
The price action in VIX today is the kind of thing that makes you realize whoever espoused the theory of “efficient markets” is as clueless as they come! 🙂
Yikes! SPY 281 strike calls crashed and burned…down to a bid of 0.17!!
Glad I unloaded most of ’em. May as well hold the rest just in case.
Looks like the market makers not expecting too much upside from here….
Selling August 3rd UVXY 7.50/8.50 bull put credit spread for 0.25….
Adding more VIX 12 strike contracts for 0.90.
ES started to break down from what looked like a bull pennant and they dumped in the cash. Look at that shadow on the 15 min
*SIGH*
O.K. I bit the bullet and gave ,’em the 0.85 they demanded for reloading VIX 12 strike calls…Scrooges! 🙂
INTC is in week 2 of a squeeze on the weekly, and the chart looks extremely bullish to me should INTC see fresh highs above the recent two weeks worth. The lows were off a 38% of a monthly tf swing, AND a 62% of the swing up since the Feb low. Serious support at 48. I think this stock is very workable on the long side.
Hourly, clean bounce off 38% retrace of multi-day swing up. I will get on it if/as it polarity shifts to “up” by breaking the high a few hours back at 52.
Lowering cost basis on IYT 190 puts. Adding 25 contracts for 2.40.
I have a higher tf trade on IYT. I sold Sept 190 puts a few days ago. IYT is going back up to the 200 area over time (few weeks to few months), IMO.
Yep. I expect it could following the upcoming correction.
I will probably snag a few calls under 183.41 the next few weeks.
Slightly underwater on IYT puts, but it looks like we have an exhaustion gap….
Very wide spread on VIX 12 strike calls at 0.70/1.00. Opening reload bid of 0.75…
Here’s hoping they smash it even lower!
Selling another 1/4 of SPY calls for 0.86…
Bloomberg reporting that VIX futures closed at lowest level in six months. There is NO FEAR! 🙂
https://www.investing.com/news/stock-market-news/vix-futures-close-at-lowest-level-in-six-months-as-fear-vanishes-1534651
Selling half SPY 281 calls for 0.72…holding rest for now….
I sold AG above $8.25 on it’s move to $8.48 and I just Backed up the truck and went “all in” again below $6.85… Next move will be to above $9.75 per share.
They just updated guidance to include their new mine and Profits and Production will surge in 2nd half of 2018.
For San Dimas in 2nd Half of 2018 AISC $6.99 to $8.19 per ounce and Cash Cost $2.71 – $3.74 = HUGE Profits and Cash Flow for AG in 2nd Half of 2018 and MEGA Profits and Cash Flow for AG in 2019. You buy stocks right before an major increase in Profits and Production. This is “THE” perfect time to Buy AG and hold through this next swing up!
An added Bonus would be if Silver Finally breaks above $17 on it’s way to $19 or $20+++ Then the price of AG would be a 3 Bagger min.!
BTW: I am making real good money playing this stock… Almost made back all the losses trying to play the S&P/DJIA the last 7 years and that is saying a lot!
The key is buying a very large position (easy to do with AG)in it at the buy points and selling out right before the peak of the swing.
The Charts & Technicals are working for this stock… 50DMA Crossed over 200DMA and 100DMA Crossed Over the 200DMA and RSI is way oversold at the moment!
Nice trade Joe! Congrats. PMs have been tough to trade lately. I have been strictly selling both bear and bull spreads Waaay out of the money. It looks to me like the weakness and slow grind lower will continue tbh. I do have to say my long time positions in GORO and SA have held up well. Good luck!
They all work together… and that is why AG is such a super buy… the majority of miners held up this week. AG was the anomaly.
AG’s RSI was extended so I sold out… Then the Update for the balance of 2018 to include the San Dimas mine closing came out… and many sold on that news. Buy rumor & sell the news! This pushed RSI to way oversold!
But that Update in Guidance was fantastic news for Profits and Cash Flow going forward so it is “THE” perfect time to load up in AG for the next swing move to $9.75+++ If you believe in the technicals…. they are working for this Stock.
Since you have been so kind to do your due diligence Joe, I’m in.
Picked up a couple hundred August 31 6.00 strike contracts for 1.75. I think we will easily clear 8.00 by expiration and those calls will fetch around 2.40… 🙂
Hi Joseph, I too am adding AG yesterday and today (for personal not our funds(not trading advice). All the miners are stupid cheap and I’ve been in and out of them 6 times this year. Happy to accumulate at this point and not over trade.
Yep! Set it and forget it. I have been holding GORO and SA for years!
SA has monstrous reserves, though undeveloped, and I expect they are going to get bought for a tidy premium one of these days.
GORO actually will let you receive your dividends in the precious metal, Silver or Gold. Its only drawback is you cannot do this in a retirement account (figures!) and you have to set it up through a third party but well worth the effort. You can send it offshore! he he! 🙂
AG is in free fall downward. That said, every trend ends. It’s exactly at the 50% now at 6.71, but the 62% is right at a major pivot low from December, so I suspect strongly that’s going to be visited.
………………………………………………………………………………………
AG Opened under the 200 DMA and Closed above it by .10… I think that test is about complete.
Silver and Gold is what was in free fall… Both today have long wick doji’s. Gold/Silver Ratio is back to 80 to 1… that’s the time to buy silver! and therefore AG!
I suggested AMTD a few days back as a strong stock in a very nice pullback that appeared to be turning back up.
Up 2.8% today, after up 2.5% yesterday. Bam!
Thank you Kevin for the AMTD trade – took it – LOVED IT –
Staying in some of it , sold some this AM
Awesome Fred! Plenty enough for all of us!
Nice! 🙂
Rising wedges everywhere!
“Water! Water everywhere, and all the boards did shrink…
Water water everywhere, nor any drop to drink…!”
S.T.C.
Buying August 17 IYT 190 strike puts for 2.80, 25 contracts.
Somebody is giving away free money with this ridiculous gap up this morning. Who ARE these people???!! 🙂
Sad how the banksters have turned so many of us into day traders. Making swing trades in this market has become virtually impossible, especially so if you lean bearish, so you simply have to scalp market declines in most cases than not. Oh well, it is what it is.
Selling half VIX 12 strike calls for 1.70, holding remaining 50 for now…
Any ideas on why the 50% pop on 12 strike VIX options for next Wednesday? So far they seem to be the only ones! Stupefied!
I only got 30% executed Verne, no liquidity anywhere. So sad……
Yikes! You know what? I knew this would start to happen. Look for it to get worse as you-know-what approaches!
My fills also came in in batches. Quite unusual and happening with increasing frequency!
Very strange! I don’t remember seeing option contracts popping like this on so little market movement. What EXACTLY, do they know?!
Retrace support. Multiple clusters of fibo’s and pivots levels.
I noticed VIX was trading below 12 pre-market and wemt to add to my position. With VIX down 0.18 in premarket, bid on 12 strike calls for next Wednesday are up 0.60 to 1.70. Wassup wid dat??!!
I guess no lower cost basis for moi…. %¥#$$ market makers! 🙂
Is today’s candlestick a bullish engulfing candle?
It would be, if it came after a downwards trend.
In an upwards trend it’s a strong bullish candlestick still.
Yep. That was a fat boy!
Grabbed a few SPY 281 calls expiring this Friday just in case…! 0.50 apiece 🙂
Bearish and bullish engulfing candles need confirmation by price action following their appearance. I have recently seen several Nasdaq bearish engulfing candles negated, with price going on to a higher high. If we surrender SPX 2800 by the close, I will manage long 281 calls with a sale of 279 strikes….