
More upwards movement was expected for Tuesday’s session, which is exactly what happened.
Summary: The AD line and On Balance Volume both continue to make new all time highs. Expect upwards movement to continue.
Today’s candlestick reversal pattern with Stochastics entering overbought territory indicates we may now see a series of small fourth waves begin, so some small range downwards days or doji may now show up in the upwards trend.
The next short term target is about 2,878; a consolidation lasting about one to two weeks may be expected at about this target. Following that, another consolidation lasting about two weeks may be expected about 2,915.
The invalidation point may now be moved up to the last swing low at 2,691.99.
The mid to longer term target is at 2,922 (Elliott wave) or 3,045 (classic analysis). Another multi week to multi month correction is expected at one of these targets.
The final target for this bull market to end remains at 3,616.
Pullbacks are an opportunity to join the trend.
Always practice good risk management. Always trade with stops and invest only 1-5% of equity on any one trade.
New updates to this analysis are in bold.
The biggest picture, Grand Super Cycle analysis, is here.
Last historic analysis with monthly charts is here, video is here.
ELLIOTT WAVE COUNT
WEEKLY CHART
Click chart to enlarge.
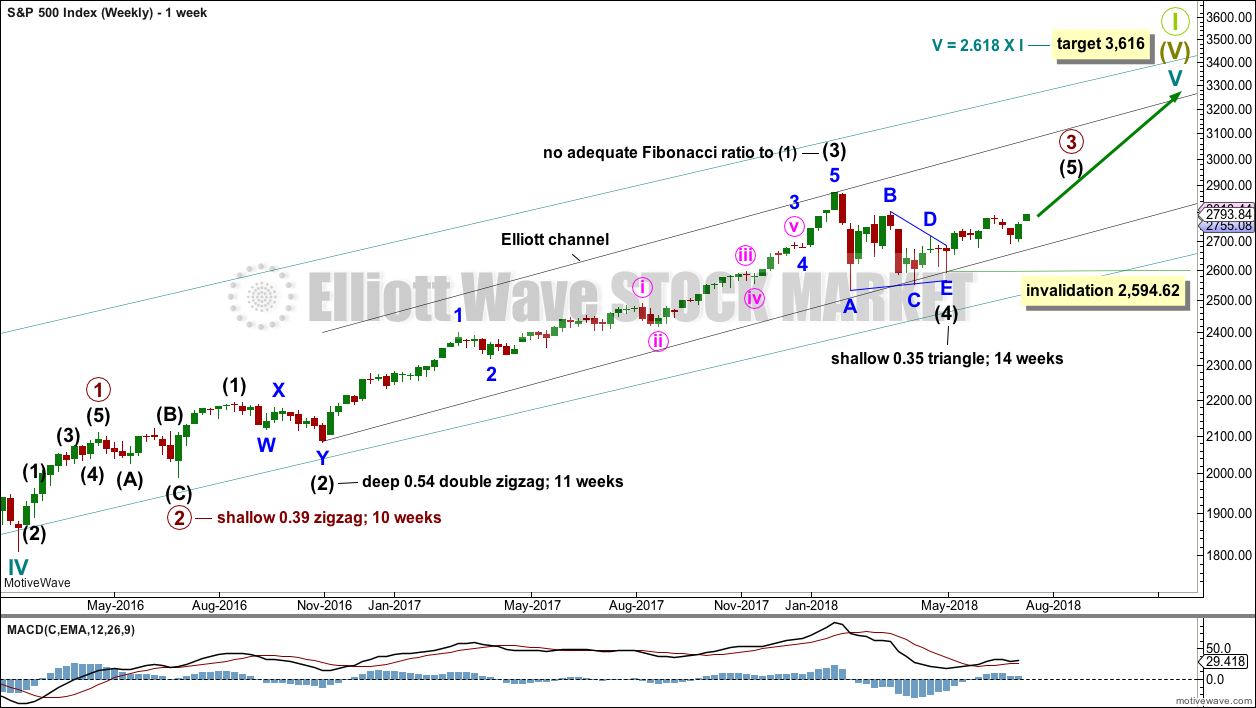
Cycle wave V must complete as a five structure, which should look clear at the weekly chart level and also now at the monthly chart level. It may only be an impulse or ending diagonal. At this stage, it is clear it is an impulse.
Within cycle wave V, the third waves at all degrees may only subdivide as impulses.
Intermediate wave (4) has breached an Elliott channel drawn using Elliott’s first technique. The channel is redrawn using Elliott’s second technique: the first trend line from the ends of intermediate waves (2) to (4), then a parallel copy on the end of intermediate wave (3). Intermediate wave (5) may end either midway within the channel, or about the upper edge.
Intermediate wave (4) may now be a complete regular contracting triangle lasting fourteen weeks, one longer than a Fibonacci thirteen. There is perfect alternation and excellent proportion between intermediate waves (2) and (4).
Within intermediate wave (5), no second wave correction may move beyond the start of its first wave below 2,594.62.
At this stage, the expectation is for the final target to me met in October 2019.
A multi week to multi month consolidation for primary wave 4 is expected on the way up to the final target.
DAILY CHART
Click chart to enlarge.
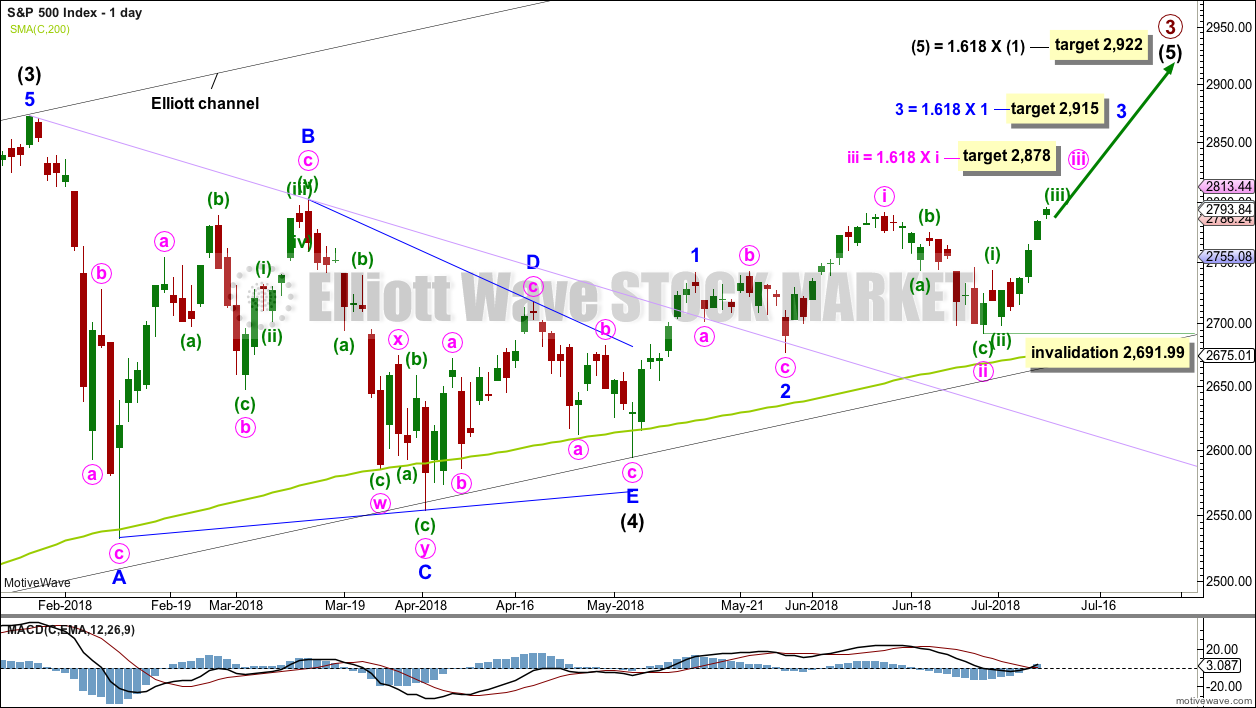
It is possible that intermediate wave (4) is a complete regular contracting triangle, the most common type of triangle. Minor wave E may have found support just below the 200 day moving average and ending reasonably short of the A-C trend line. This is the most common look for E waves of triangles.
Intermediate wave (3) exhibits no Fibonacci ratio to intermediate wave (1). It is more likely then that intermediate wave (5) may exhibit a Fibonacci ratio to either of intermediate waves (1) or (3). The most common Fibonacci ratio would be equality in length with intermediate wave (1), but in this instance that would expect a truncation. The next common Fibonacci ratio is used to calculate a target for intermediate wave (5) to end.
Price has clearly broken out above the upper triangle B-D trend line. This indicates that it should now be over if the triangle is correctly labelled.
A trend line in lilac is added to this chart. It is the same line as the upper edge of the symmetrical triangle on the daily technical analysis chart. Price found support about this line.
A target is now calculated for minute wave iii to end, which expects to see the most common Fibonacci ratio to minute wave i. Minute wave iii may last about two to three weeks. When it is complete, then minute wave iv may last about one to two weeks in order for it to exhibit reasonable proportion to minute wave ii. Minute wave iv must remain above minute wave i price territory.
So far minute wave iii may now have just passed its middle, the strongest portion. Within minute wave iii, no second wave correction may move beyond the start of its first wave below 2,691.99
A target is calculated for minor wave 3 to end, which expects to see the most common Fibonacci ratio to minor wave 1. Minor wave 3 may last several weeks in total and should look like an impulse at the daily chart level. When it is complete, then minor wave 4 may last about one to two weeks in order for it to exhibit reasonable proportion to minor wave 2. Minor wave 4 must remain above minor wave 1 price territory.
HOURLY CHART
Click chart to enlarge.
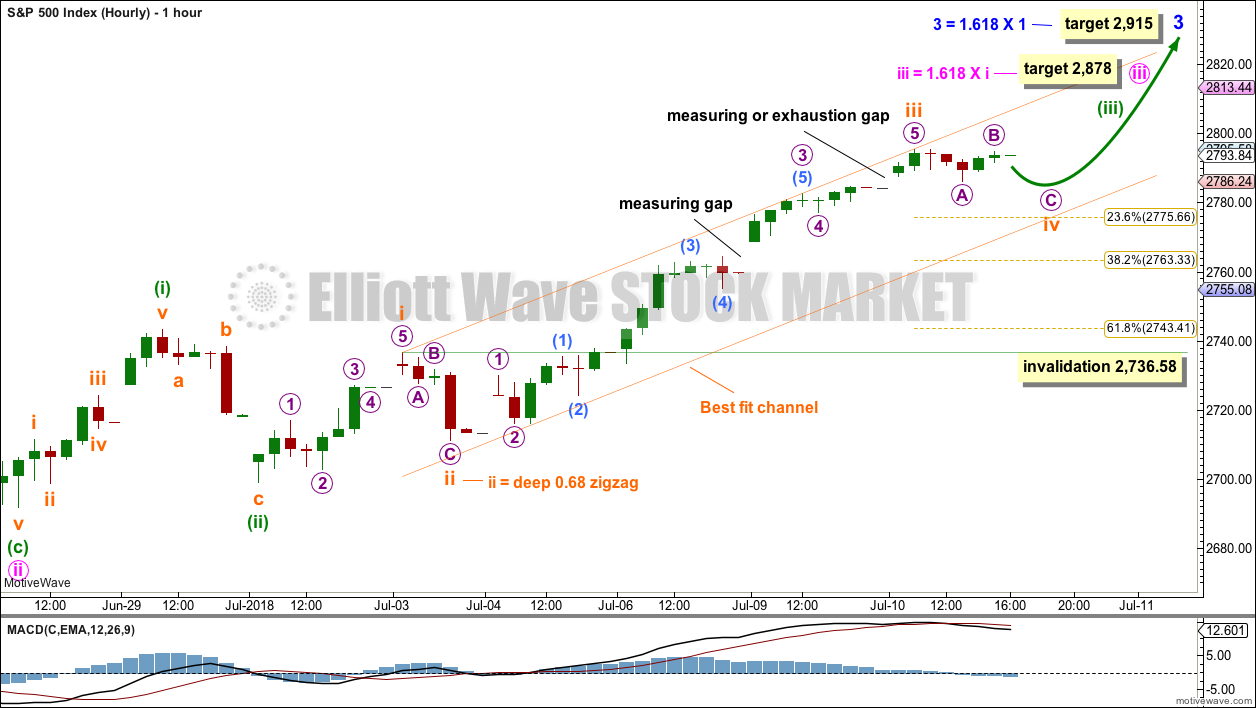
The degree of labelling within subminuette wave iii is moved up one degree today. Subminuette wave iii may now be complete. This would be the middle portion of the whole of intermediate wave (5).
If subminuette wave iii is complete, then subminuette wave iv may unfold over a day or so. Subminuette wave ii lasted just three hours, but shows up on the daily chart as one red daily candlestick. Subminuette wave iv may be a more long lasting kind of correction, and may also show up on the daily chart as a red daily candlestick or a doji.
Subminuette wave ii was a deep zigzag. Given the guideline of alternation, subminuette wave iv would be most likely a shallow flat, triangle or combination.
The last gap remains open. It may provide support if it is a measuring gap. If this last gap is closed, then it would correctly be labelled an exhaustion gap. If that happens, then expect subminuette wave iv to end about the 0.236 Fibonacci ratio at 2,775.66.
Adjust the channel to fit about minuette wave (iii) as shown. The lower edge may provide support for subminuette wave iv.
Subminuette wave iv may not move into subminuette wave i price territory below 2,736.58.
ALTERNATE DAILY CHART
Click chart to enlarge.
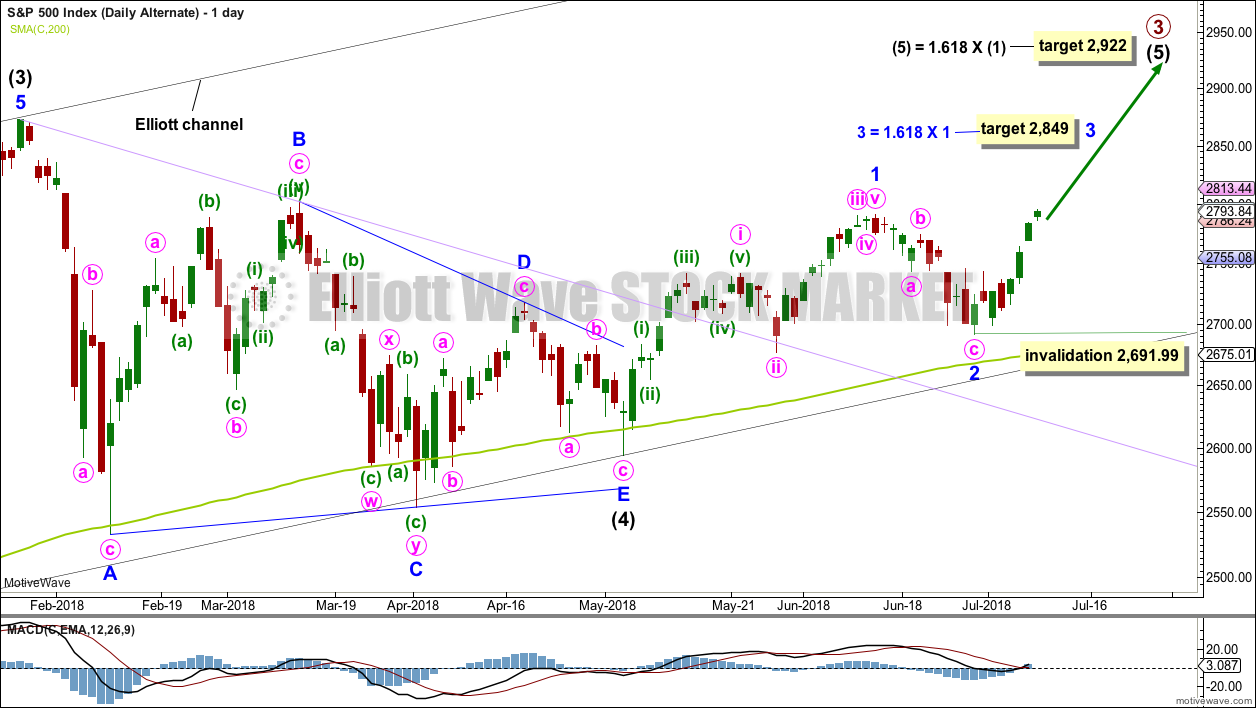
It is possible that minor wave 1 may have been over at the last high. Minor wave 3 may be in its very early stages.
At the daily chart level, this wave count does not have as good a look as the main wave count. Minor wave 1 has a three wave look, but it should look like a five. However, this market does not always have fives that look perfectly like fives, so this possibility should still be considered.
TECHNICAL ANALYSIS
WEEKLY CHART
Click chart to enlarge. Chart courtesy of StockCharts.com.
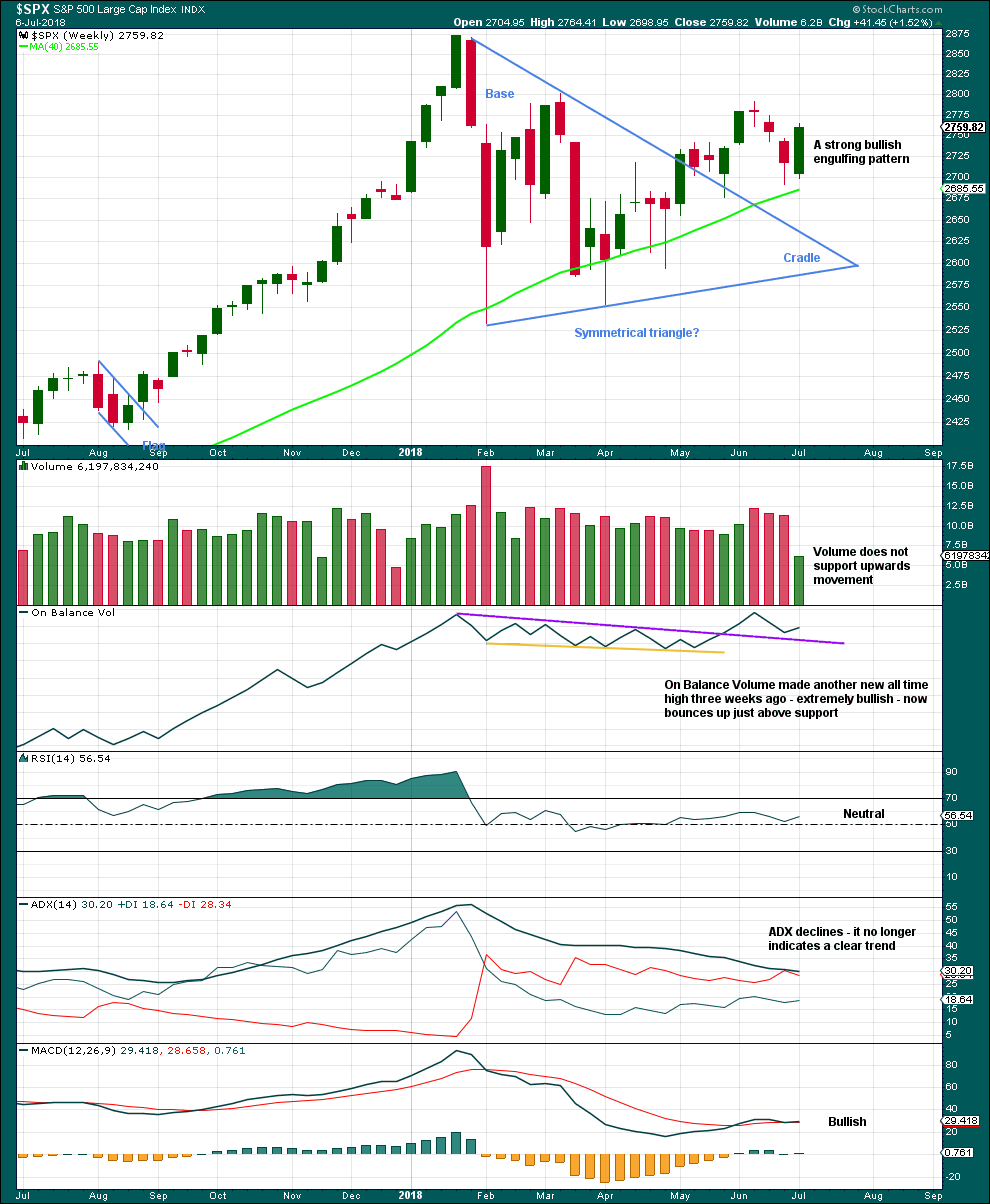
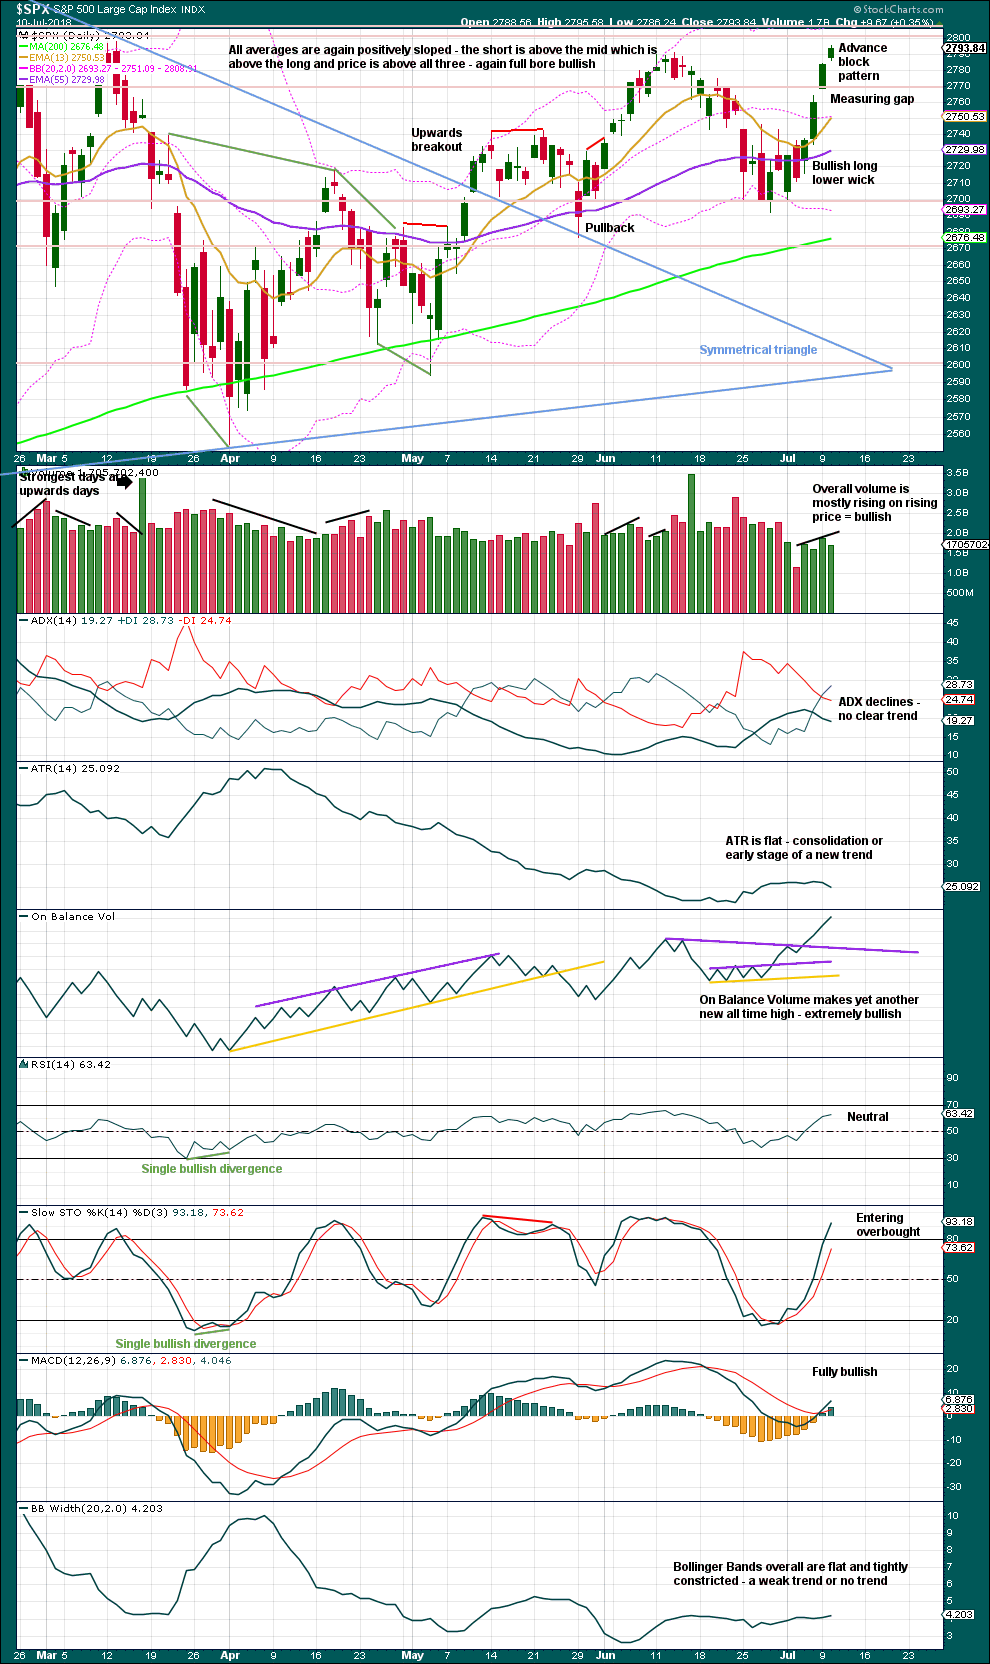
After two weeks of falling price, a strong candlestick reversal pattern on the weekly chart is very bullish.
The lack of volume last week is not of a concern, because it was a short week with one and a half days closed to trading for the 4th of July holiday. We have to look inside the week at daily volume bars to judge the short term volume profile.
DAILY CHART
Click chart to enlarge. Chart courtesy of StockCharts.com.
The symmetrical triangle may now be complete. The base distance is 340.18. Added to the breakout point of 2,704.54 this gives a target at 3,044.72. This is above the Elliott wave target at 2,922, so the Elliott wave target may be inadequate.
Since the low on the 2nd of April, 2018, price has made a series of higher highs and higher lows. This is the definition of an upwards trend. But trends do not move in perfectly straight lines; there are pullbacks and bounces along the way. While price has not made a lower low below the prior swing low of the 29th of May, the view of a possible upwards trend in place should remain.
The measuring gap gives a short term target at 2,838.
Another new all time high from On Balance Volume at the daily chart level is extremely bullish and should be given weight in this analysis. This adds confidence to the Elliott wave count.
The Advance Block pattern with Stochastics entering overbought indicates upwards movement may be slowing about here. Look for resistance and some possible consolidation about 2,800.
VOLATILITY – INVERTED VIX CHART
WEEKLY CHART
Click chart to enlarge. Chart courtesy of StockCharts.com. So that colour blind members are included, bearish signals
will be noted with blue and bullish signals with yellow.
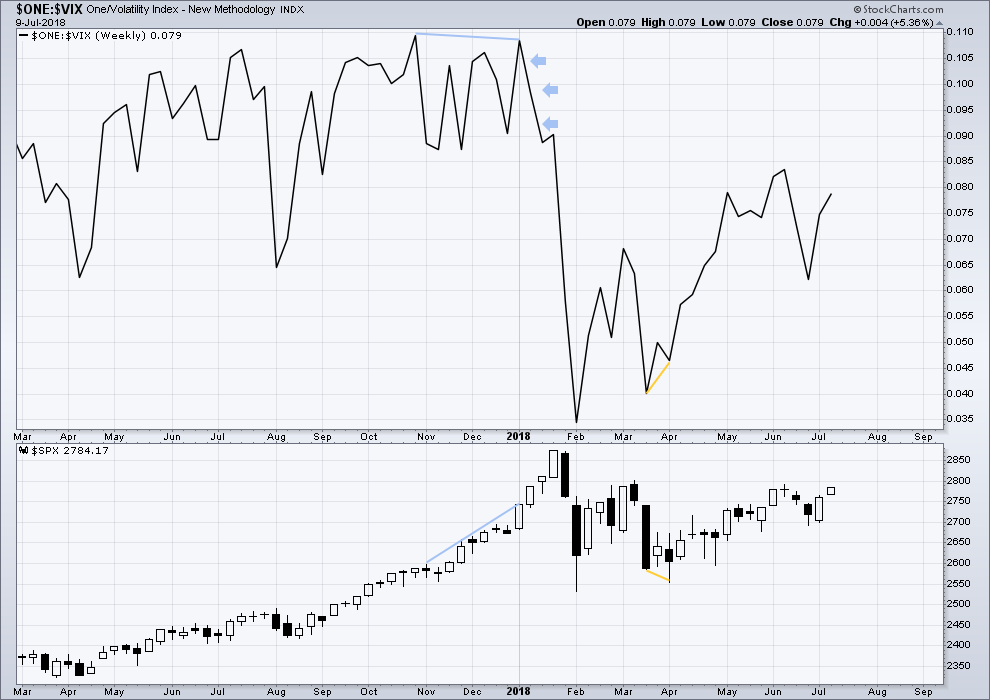
To keep an eye on the all time high for inverted VIX a weekly chart is required at this time.
Notice how inverted VIX has very strong bearish signals four weeks in a row just before the start of the last large fall in price. At the weekly chart level, this indicator may be useful again in timing the end of primary wave 3.
At this stage, at this time frame, there are no short or mid term signals from divergence between inverted VIX and price.
DAILY CHART
Click chart to enlarge. Chart courtesy of StockCharts.com. So that colour blind members are included, bearish signals
will be noted with blue and bullish signals with yellow.
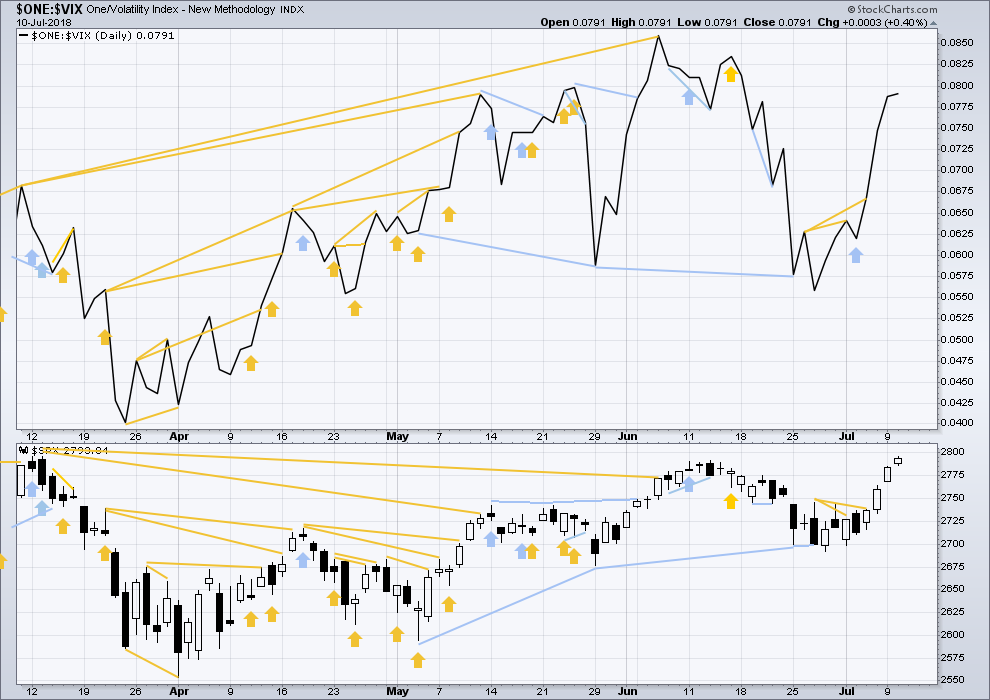
Normally, volatility should decline as price moves higher and increase as price moves lower. This means that normally inverted VIX should move in the same direction as price.
There is mid term bearish divergence between price and inverted VIX: inverted VIX has made a new swing low below the prior swing low of the 29th of May, but price has not. Downwards movement has strong support from increasing market volatility; this divergence is bearish. However, it must be noted that the last swing low of the 29th of May also came with bearish divergence between price and inverted VIX, yet price went on to make new highs.
This divergence may not be reliable. As it contradicts messages given by On Balance Volume and the AD line, it shall not be given much weight in this analysis.
There is no new short term divergence today between price and inverted VIX.
BREADTH – AD LINE
WEEKLY CHART
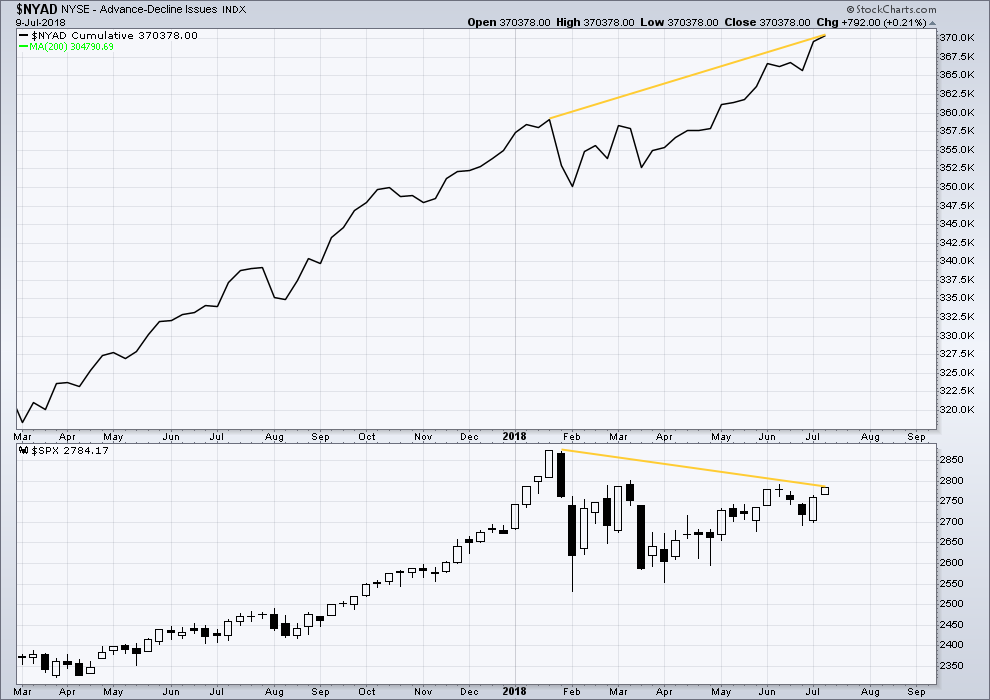
Click chart to enlarge. Chart courtesy of StockCharts.com.
When primary wave 3 comes to an end, it may be valuable to watch the AD line at the weekly time frame as well as the daily.
At this stage, there is very strong bullish divergence between price and the AD line at the weekly time frame. With the AD line making new all time highs, expect price to follow through with new all time highs in coming weeks.
DAILY CHART
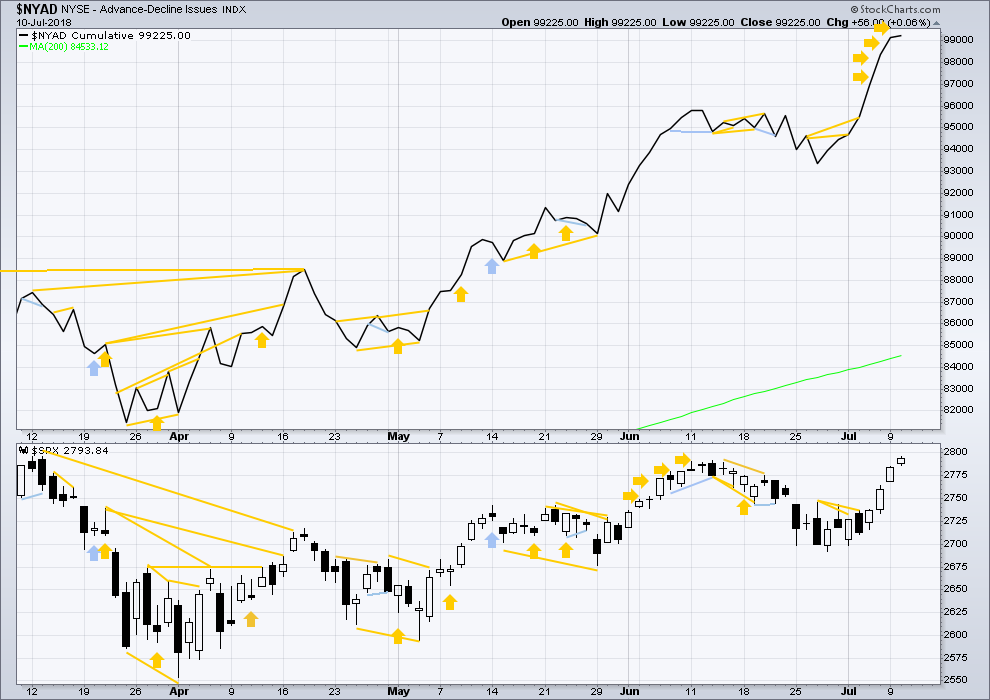
Click chart to enlarge. Chart courtesy of StockCharts.com.
There is normally 4-6 months divergence between price and market breadth prior to a full fledged bear market. This has been so for all major bear markets within the last 90 odd years. With no longer term divergence yet at this point, any decline in price should be expected to be a pullback within an ongoing bull market and not necessarily the start of a bear market. New all time highs from the AD line means that any bear market may now be an absolute minimum of 4 months away. It may of course be a lot longer than that. My next expectation for the end of this bull market may now be October 2019.
All of small, mid and large caps have moved higher last week. Small caps have made new all time highs as recently as 20th of June. The small caps may be leading the market as they tend to in the latter stages of an ageing bull market.
Breadth should be read as a leading indicator.
The AD line has made new all time highs now for four days in a row. This is extremely bullish and strongly supports the main Elliott wave count at the daily and weekly chart levels.
Price may reasonably be expected to follow through in coming weeks.
DOW THEORY
The following lows need to be exceeded for Dow Theory to confirm the end of the bull market and a change to a bear market:
DJIA: 23,360.29.
DJT: 9,806.79.
S&P500: 2,532.69.
Nasdaq: 6,630.67.
Only Nasdaq at this stage is making new all time highs. DJIA and DJT need to make new all time highs for the ongoing bull market to be confirmed.
Charts showing each prior major swing low used for Dow Theory may be seen at the end of this analysis here.
Published @ 08:50 p.m. EST.
The last gap is closed so it’s now correctly labelled an exhaustion gap. The gap before it is still open and still looks most likely to be a measuring gap, it may offer support as it remains open. So price may not move below 2,764.41.
If that analysis of those gaps is correct then subminuette iv should be over here. It will fit as a combination, which provides alternation with the zigzag of subminuette ii.
Oh, the channel isn’t working. That’s unfortunately rather common for this market.
I’ll redraw a wider channel about the larger movement of the whole of minute iii.
Quite a battle around a DJI support shelf in the 24,700.00 area today. The cash session barely managed to reclaim it after the bears sent price below it. Futures suggesting we may go lower prior to resumption of the uptrend…
Looks like a 5-down on both the 5-minute and hourly… that’s troubling. We could meander here a bit with the 4 ending much deeper. Will be interesting to see where China goes tonight and whether they make lower lowers. Oil is holding at the previous low so that’s encouraging at least. VIX not convincingly up here, which leads me to believe this dip won’t get TOO deep, at least… famous last words I know.
EIA reported a 12.5 million barrel draw earlier this morning, which is a massive draw any way to look at it, and oil is down 2.4%… That’s not encouraging. Lol
🙂
Keeping in mind that the monthly trend dominates the weekly, etc, take a look at /CL monthly and weekly. I don’t think there’s anything to be concerned about re: falling oil prices, for the time being. Gyrations yes, but the trend is strongly up and up monthly and weekly.
I don’t know where the sell off will bottom but the next significant resistance below is a cluster of fibos at 2770.5 – 2771.5. A 23% and a (derived fibo) 78%.
Strong bounce off that fibo area! Every incremental bullish sign puts the “end of life” seal that much firmer on this subminuette iv. We’ll see.
I’m starting to build a position again on ABBV… I missed the first leg up, now looks like a wave 2 correction unfolding…
Closed out short leg USO 15.50/16.00 bear call spread today. I think this move down is corrective so I’m holding the 16.00 strike calls….
The good old US of A is now the world’s largest producer…who could have imagined??!!
Boy was I wrong on oil, lol! Good thing I don’t trade /CL. Really took a tumble there.
The good news is this VIX movement is still extremely bullish. Big reversal at the 50dma and 200dma. Also, the failure to take out last nights spooz low is a good sign.
Why troubling? Trade what you see! 🙂
Troubling for the longs I meant… I closed my short position today, which I was building over the last couple of days. Thanks to Lara’s oil analysis 🙂
Definitely not complaining!
I meant Bo… 🙂
Well, the time frame for this move down is too short for me. My timing is just not good enough to take advantage of a potential trend change at that level.
Got it. It is wise to only trade at your comfort level. I have been having a great time with these pullbacks as they are great for getting positioned for resumption of the upward trend via bear call credit spreads. Made a nice haul on DIA 249 puts I opened after RUT quickly closed its opening gap yesterday. We had to actually exercise the in- the- money options as the market makers were trying to take us to the cleaners with truly lousy bids on the contracts! They were not even bidding intrinsic value. It was a riot seeing all those tens of thousands of DIA shares being sold short at the same time. The banksters went nuts and made a huge cash dump when we did it…we covered at around 246.70
Backing and filling under 2800 to complete the subminuette iv.
If the subminuette v is the length of the subminuette i, the target price is very close to 2819, the 127% extension. That’s where I’ll be watching carefully for another turn and the start of minuette iv.
/ZB, ten year bond futures. Price is in a giant volume hole, which should not be stable.
So in theory, it’s just a matter of identifying which of the two volume nodes it’s heading into. How difficult can that be? Once it starts going there’s not likely to be whipsaws.
I’ll find out soon enough.
Cha-Ching (An onomatopoeia, imitative of the sound of a mechanical cash register when an amount is rung up.) More to come? I think so.
They say it’s when you sell that counts Rodney.
Me, my biggest vice (okay not my biggest vice) is making profits count too early. It’s a tough skill, holding on to a runner.
I’ll be looking to leg back in aggressively on early indications this little 4 is over. Once 2800-2803 falls, next stop is 2819, and I’m expecting a short term top there (start of the next larger iv I guess).
No kidding. I took the money and ran after RUT closed that gap open yesterday…whew! 🙂