
Upwards movement was expected for Tuesday’s session. A higher high and a higher low fits the definition of upwards movement, although the candlestick has closed red.
Summary: On Balance Volume and the AD line are very bullish, supporting the main Elliott wave count which expects upwards movement from here.
A new high above 2,757.12 would provide confidence that a low is in place. The target would then be about 2,849; a consolidation lasting about two weeks may be expected at about this target.
A new low below 2,691.99 would indicate the pullback is continuing and should then end at least slightly below 2,676.81. The target is about 2,664.
The invalidation point must remain at 2,594.62.
The mid to longer term target is at 2,922 (Elliott wave) or 3,045 (classic analysis). Another multi week to multi month correction is expected at one of these targets.
The final target for this bull market to end remains at 3,616.
Pullbacks are an opportunity to join the trend.
Always practice good risk management. Always trade with stops and invest only 1-5% of equity on any one trade.
New updates to this analysis are in bold.
The biggest picture, Grand Super Cycle analysis, is here.
Last historic analysis with monthly charts is here, video is here.
ELLIOTT WAVE COUNT
WEEKLY CHART
Click chart to enlarge.
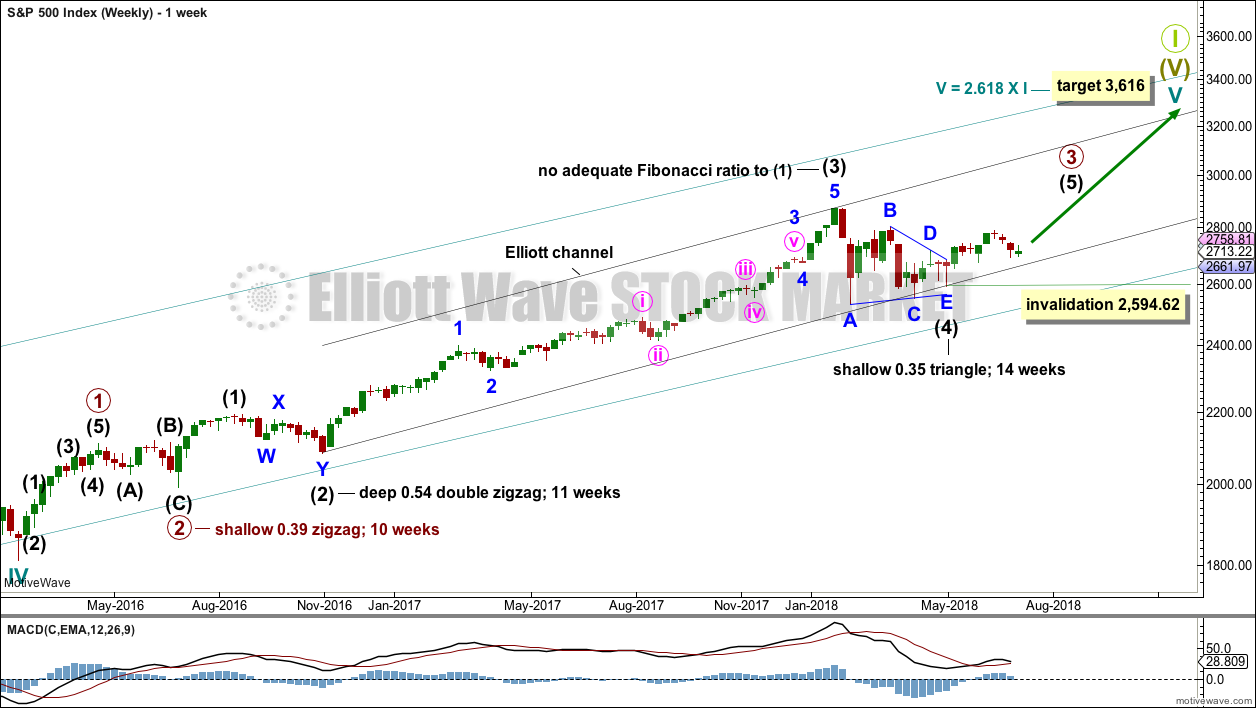
Cycle wave V must complete as a five structure, which should look clear at the weekly chart level and also now at the monthly chart level. It may only be an impulse or ending diagonal. At this stage, it is clear it is an impulse.
Within cycle wave V, the third waves at all degrees may only subdivide as impulses.
Intermediate wave (4) has breached an Elliott channel drawn using Elliott’s first technique. The channel is redrawn using Elliott’s second technique: the first trend line from the ends of intermediate waves (2) to (4), then a parallel copy on the end of intermediate wave (3). Intermediate wave (5) may end either midway within the channel, or about the upper edge.
Intermediate wave (4) may now be a complete regular contracting triangle lasting fourteen weeks, one longer than a Fibonacci thirteen. There is perfect alternation and excellent proportion between intermediate waves (2) and (4).
Within intermediate wave (5), no second wave correction may move beyond the start of its first wave below 2,594.62.
At this stage, the expectation is for the final target to me met in October 2019.
A multi week to multi month consolidation for primary wave 4 is expected on the way up to the final target.
DAILY CHART

Click chart to enlarge.
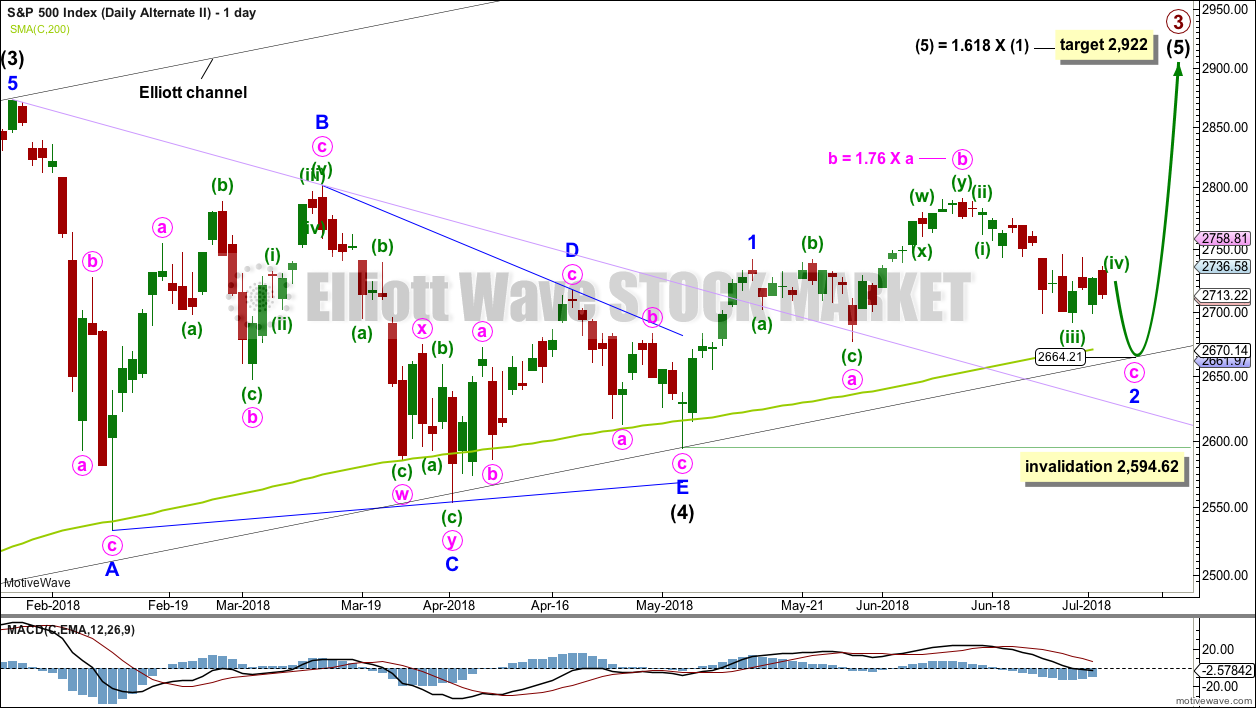
It is possible that intermediate wave (4) is a complete regular contracting triangle, the most common type of triangle. Minor wave E may have found support just below the 200 day moving average and ending reasonably short of the A-C trend line. This is the most common look for E waves of triangles.
Intermediate wave (3) exhibits no Fibonacci ratio to intermediate wave (1). It is more likely then that intermediate wave (5) may exhibit a Fibonacci ratio to either of intermediate waves (1) or (3). The most common Fibonacci ratio would be equality in length with intermediate wave (1), but in this instance that would expect a truncation. The next common Fibonacci ratio is used to calculate a target for intermediate wave (5) to end.
Price has clearly broken out above the upper triangle B-D trend line. This indicates that it should now be over if the triangle is correctly labelled.
A trend line in lilac is added to this chart. It is the same line as the upper edge of the symmetrical triangle on the daily technical analysis chart. Price found support about this line.
Minor wave 1 may have been over at the last high. Minor wave 1 will subdivide as a five wave impulse on the hourly chart; the disproportion between minute waves ii and iv gives it a three wave look at the daily chart time frame. The S&P does not always exhibit good proportions; this is an acceptable wave count for this market.
It looks like minor wave 2 for this first daily wave count should be over here. The structure at lower time frames looks complete. If it does continue lower, then it may complete as a double zigzag. This idea is considered in a new hourly chart below.
A target is calculated for minor wave 3 to end.
Minor wave 2 may not move beyond the start of minor wave 1 below 2,594.62.
HOURLY CHART
Click chart to enlarge.
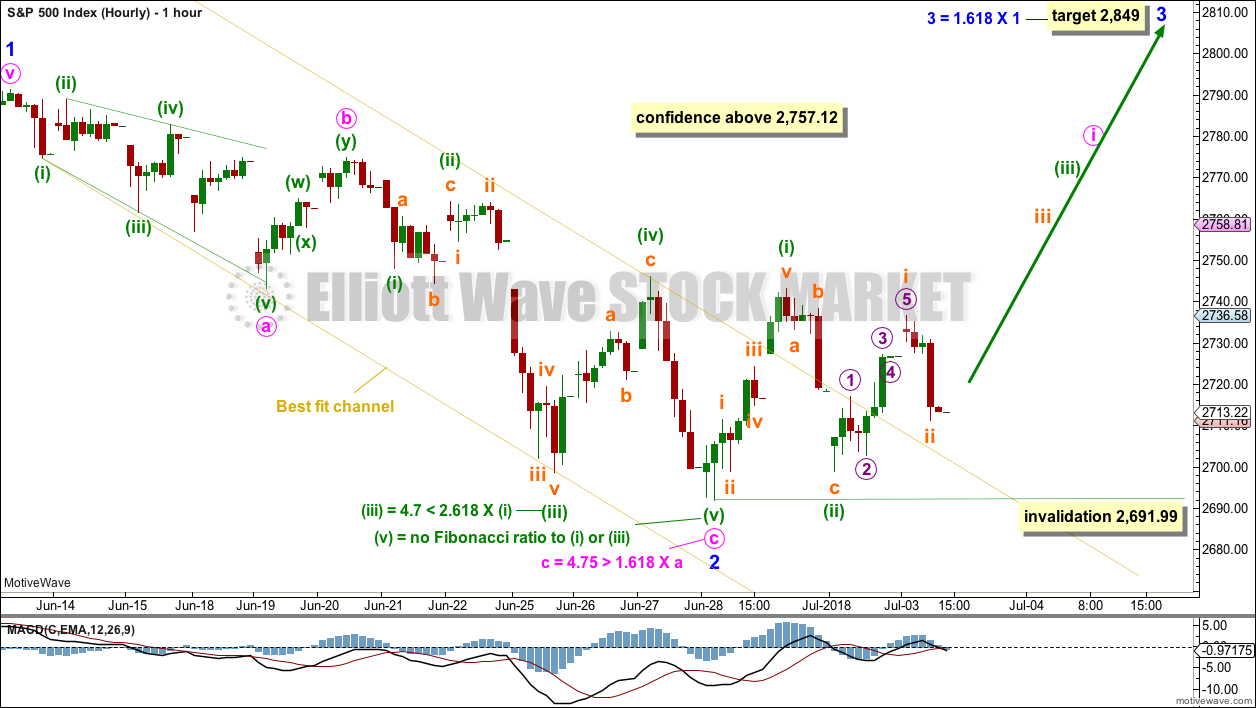
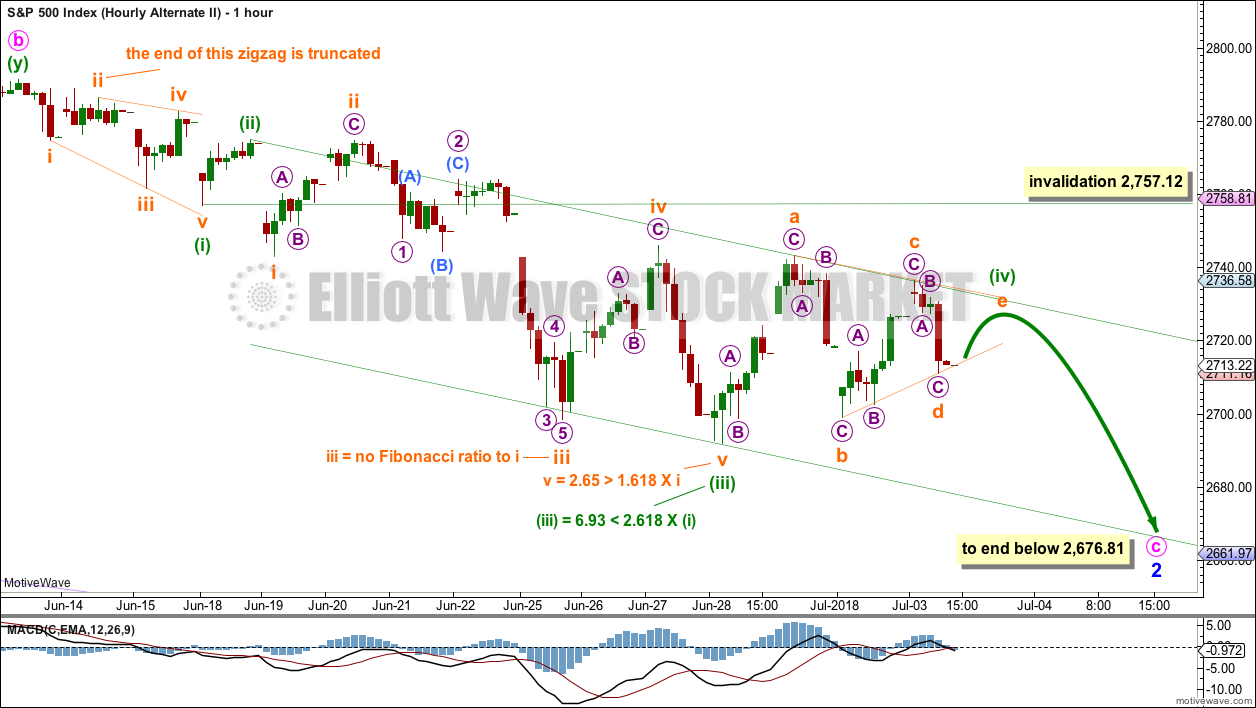
Minor wave 2 may now be a complete zigzag; all subdivisions fit for a 5-3-5 downwards. A best fit channel is drawn about this downwards movement. The channel is breached, giving a first indication that a low may be in place. A new high now above 2,757.12 would add confidence that a low is in place.
Upwards movement labelled minuette wave (i) looks best as a five, and downwards movement labelled minuette wave (ii) looks best as a three. The last small upwards wave will fit as a five wave structure labelled subminuette wave i, but it does look better as a three. The last small downwards wave will fit well as a three wave structure, labelled subminuette wave ii. So far this wave count still has a reasonable fit.
The hourly wave counts differ in where the leading diagonal at the start of the downwards movement is seen to end. This labelling has the better fit; the leading diagonal for minute wave a fits all Elliott wave rules.
Minuette wave (ii) may not move beyond the start of minuette wave (i) below 2,691.99.
SECOND HOURLY CHART
Click chart to enlarge.
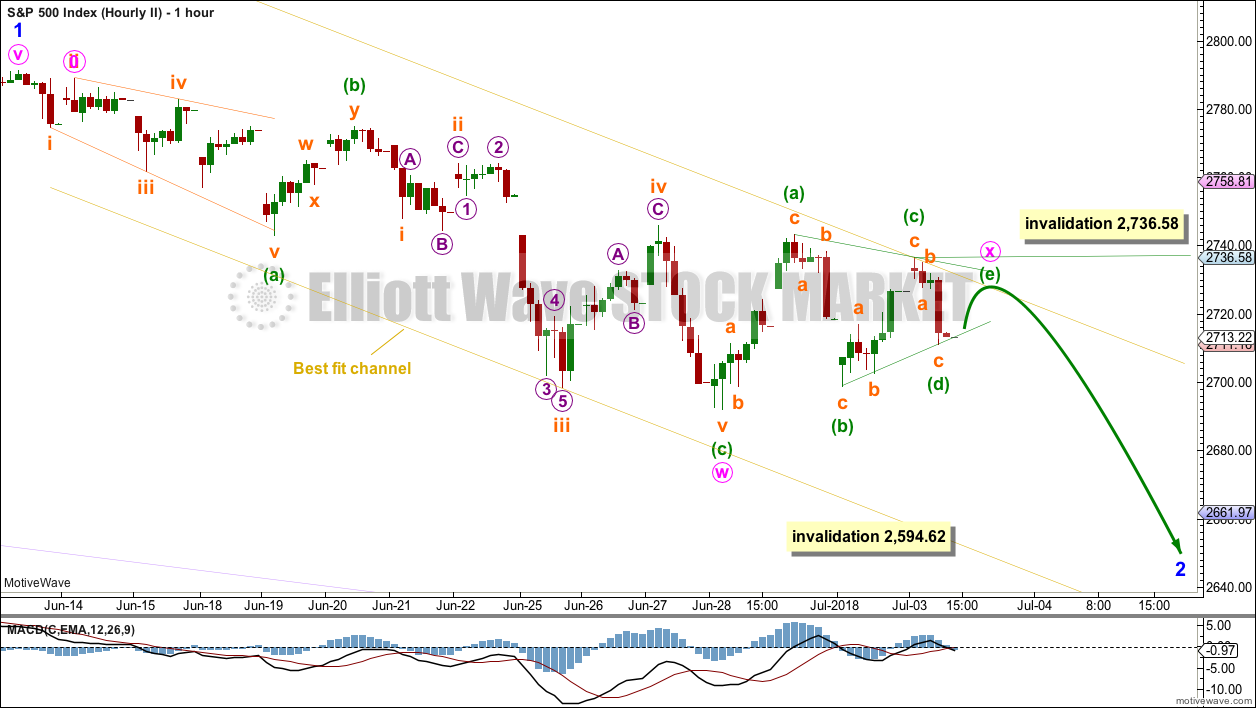
If the degree of labelling within the zigzag is moved down one degree, it is possible to see that minor wave 2 could continue lower as a double zigzag.
The first zigzag in the double is complete, labelled minute wave w. The double is joined by a corrective structure in the opposite direction, labelled minute wave x.
Minute wave x may be an incomplete regular contracting triangle, requiring only minuette wave (e) to complete. Minuette wave (e) may not move beyond the end of minuette wave (c) above 2,736.58.
When the triangle may be complete, then another zigzag to last a few days may move price lower. Minor wave 2 may not move beyond the start of minor wave 1 below 2,594.62.
ALTERNATE DAILY CHART
Click chart to enlarge.
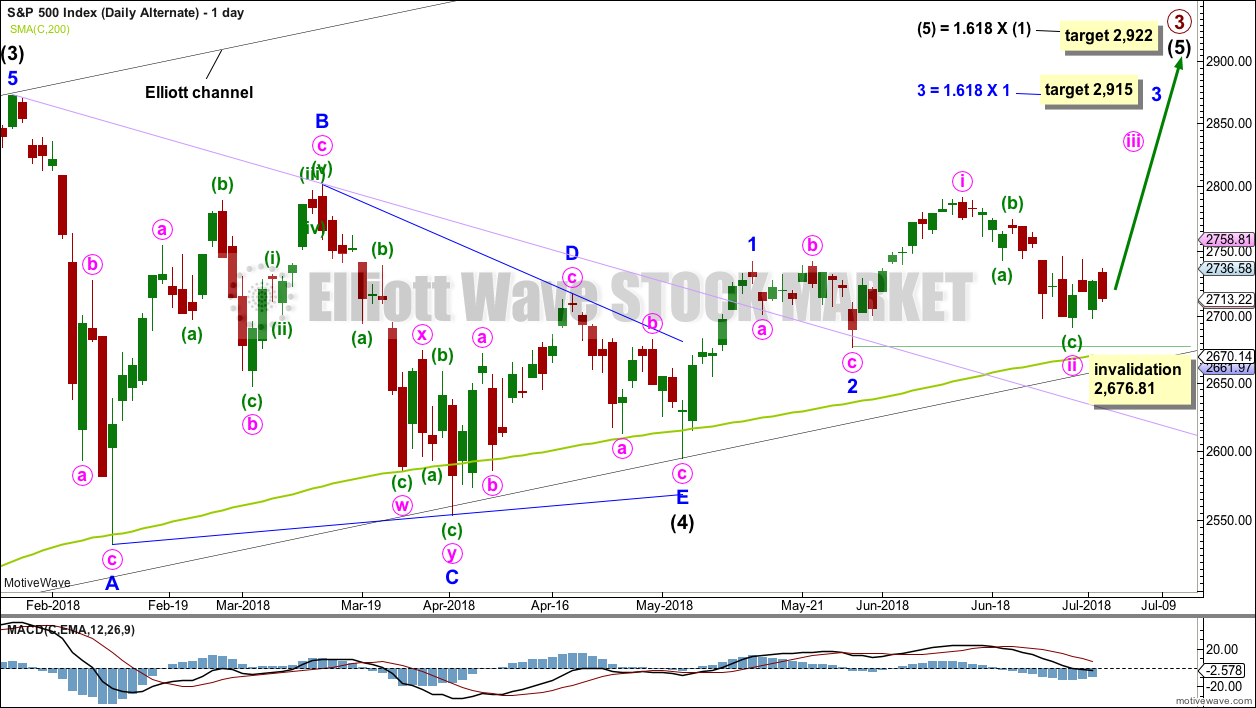
It is possible that minor waves 1 and 2 are already over. The last high may have been minute wave i. Minute wave ii may need one more low to be complete.
Minute wave ii may not move beyond the start of minute wave i below 2,676.81.
This alternate wave count resolves the problem of an odd looking minor wave 1 for the main wave count. The only problem with this alternate wave count is minute wave ii is not contained within a base channel which would be drawn about minor waves 1 and 2.
This wave count is very bullish. It expects to see a very strong upwards movement as the middle of a third wave begins here.
SECOND ALTERNATE DAILY CHART
Click chart to enlarge.
It is also possible that minor wave 1 ended earlier and downwards movement is the end of an expanded flat correction for minor wave 2.
The 0.618 Fibonacci ratio of minor wave 1 here would be about 2,651. This would be very slightly below the lower edge of the black Elliott channel and slightly below the 200 day moving average.
This second alternate wave count expects a somewhat deeper pullback about here to make a new low below the end of minute wave a at 2,676.81, so that minute wave c avoids a truncation and minor wave 2 avoids a running flat correction. If the pullback ends about the lower edge of the black Elliott channel, then that would be now about 2,664.
Minor wave 2 may not move beyond the start of minor wave 1 below 2,594.62.
SECOND ALTERNATE HOURLY CHART
Click chart to enlarge.
Minuette wave (i) may have ended earlier. This leading expanding diagonal still meets all Elliott wave rules, but the end of subminuette wave ii is truncated. This reduces the probability of this wave count.
A channel is drawn about this possible impulse using Elliott’s second technique. Minuette wave (v) may end either mid way within the channel, or about the lower edge.
Minute wave c would be very likely to make at least a slight new low below 2,676.81 to avoid a truncation and a very rare running flat.
Minuette wave (iv) may not move into minuette wave (i) price territory above 2,757.12. Minuette wave (iv) may be unfolding sideways as a regular contracting triangle.
TECHNICAL ANALYSIS
WEEKLY CHART
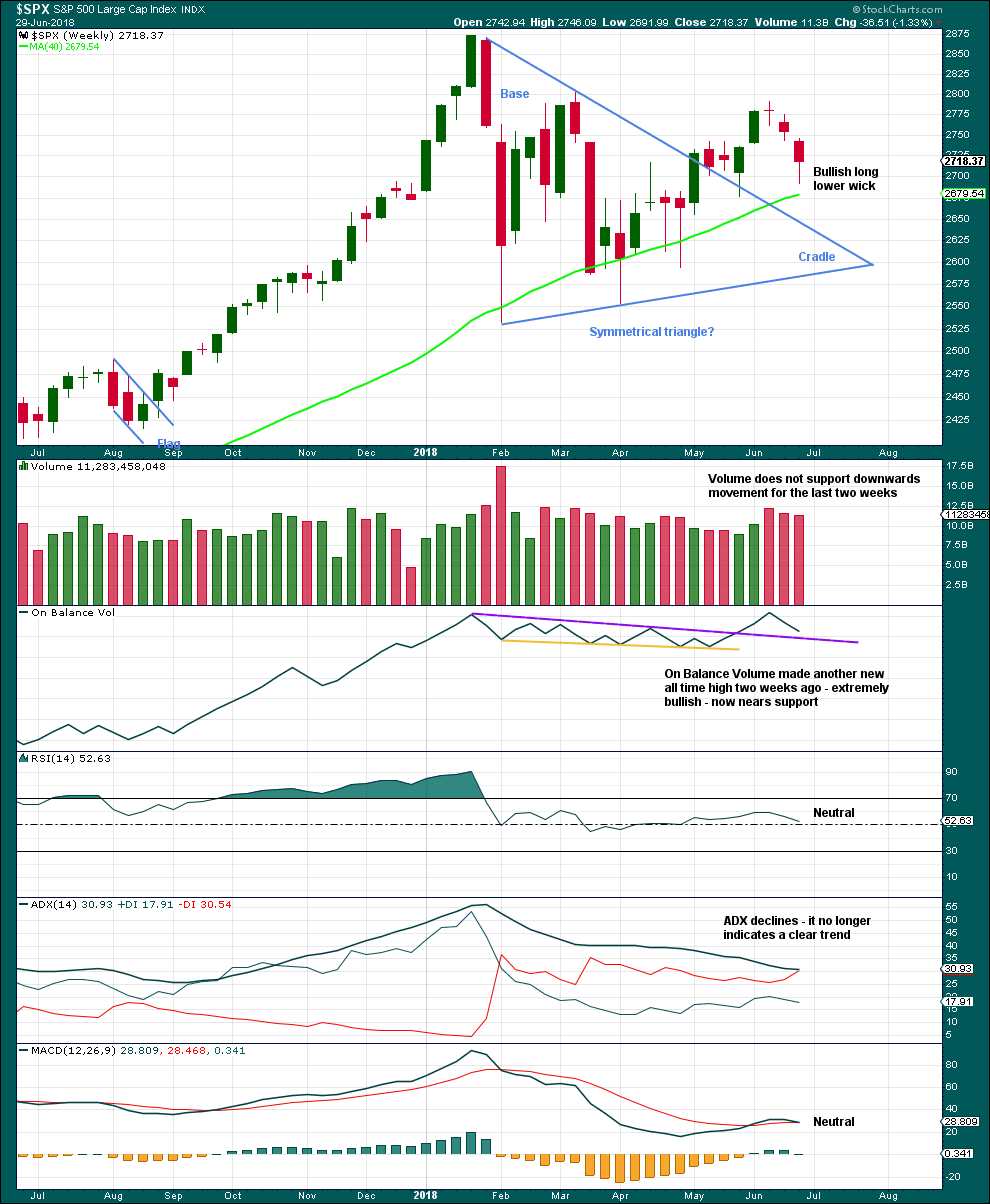
Click chart to enlarge. Chart courtesy of StockCharts.com.
Downwards movement of the last two weeks still looks most likely as a pullback within a developing upwards trend. Long lower candlestick wicks, a lack of support from volume, and nearby support from On Balance Volume all look bullish.
DAILY CHART
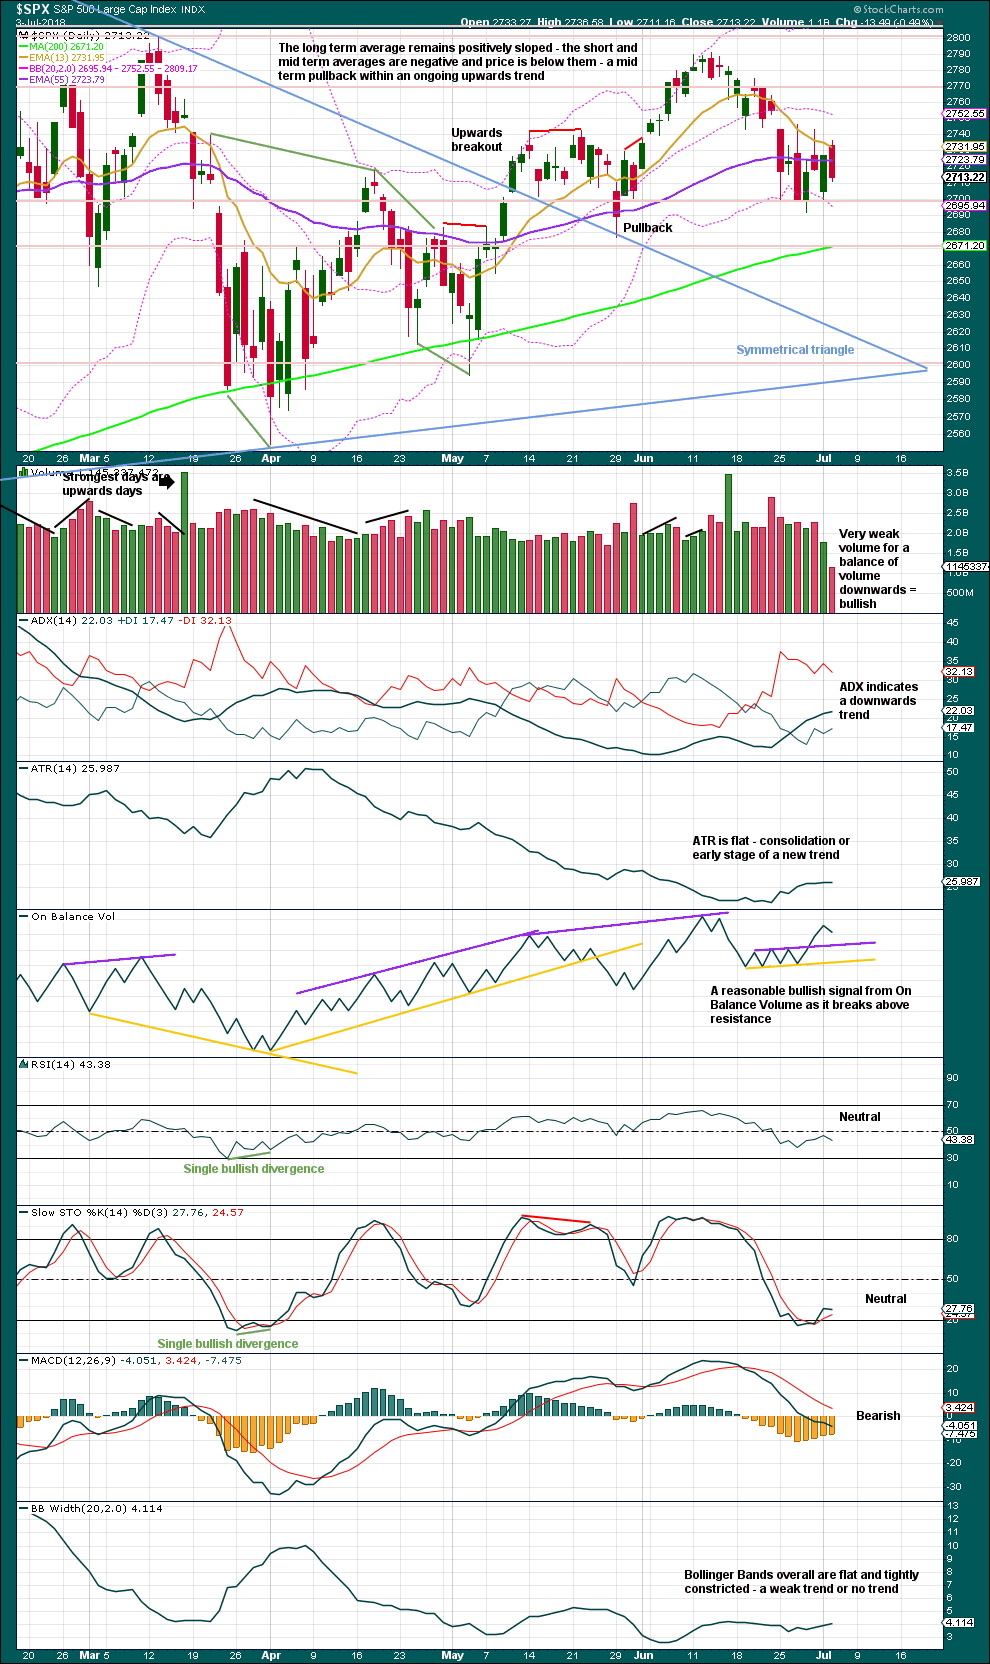
Click chart to enlarge. Chart courtesy of StockCharts.com.
The symmetrical triangle may now be complete. The base distance is 340.18. Added to the breakout point of 2,704.54 this gives a target at 3,044.72. This is above the Elliott wave target at 2,922, so the Elliott wave target may be inadequate.
Since the low on the 2nd of April, 2018, price has made a series of higher highs and higher lows. This is the definition of an upwards trend. But trends do not move in perfectly straight lines; there are pullbacks and bounces along the way. While price has not made a lower low below the prior swing low of the 29th of May, the view of a possible upwards trend in place should remain. Note though that the second alternate Elliott wave count allows for a new swing low yet expects a third wave upwards to begin from there. This is entirely possible.
Tuesday has a higher high and a higher low, the definition of upwards movement, but the candlestick has closed red.
The balance of volume for the session is down, and very light volume has not supported this downwards movement within the session. The short term volume profile is bullish.
Price is finding strong support here about 2,695.
VOLATILITY – INVERTED VIX CHART
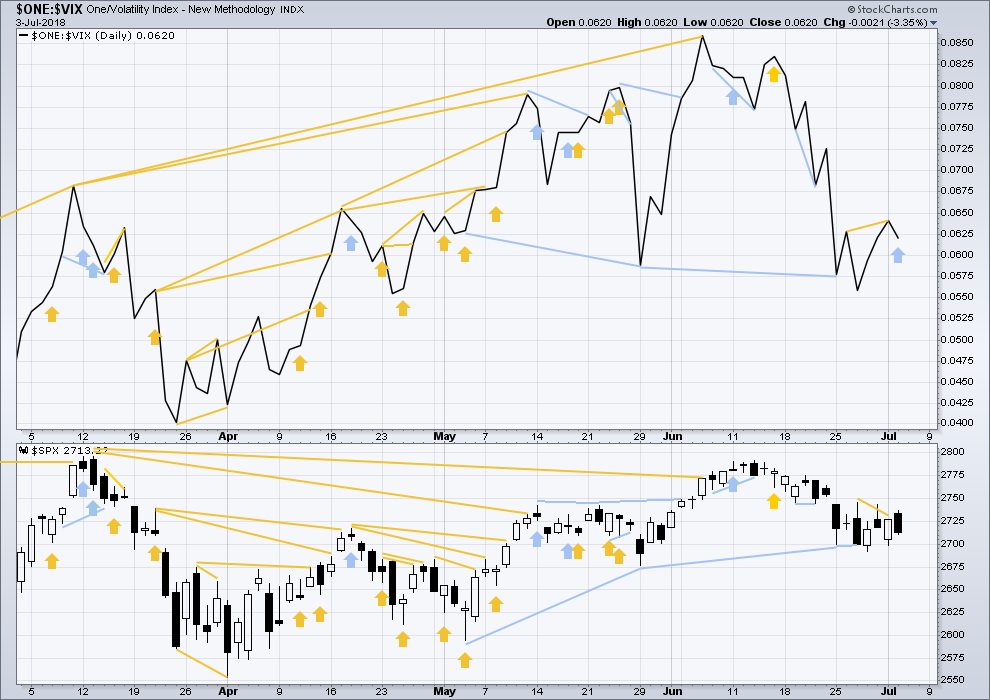
Click chart to enlarge. Chart courtesy of StockCharts.com. So that colour blind members are included, bearish signals
will be noted with blue and bullish signals with yellow.
Normally, volatility should decline as price moves higher and increase as price moves lower. This means that normally inverted VIX should move in the same direction as price.
Inverted VIX has made a new high above the prior swing high of the 9th of March, but price has not made a corresponding new swing high about the same point yet. This divergence is bullish. Inverted VIX is still a little way off making a new all time high.
There is mid term bearish divergence between price and inverted VIX: inverted VIX has made a new swing low below the prior swing low of the 29th of May, but price has not. Downwards movement has strong support from increasing market volatility; this divergence is bearish. However, it must be noted that the last swing low of the 29th of May also came with bearish divergence between price and inverted VIX, yet price went on to make new highs.
This divergence may not be reliable. As it contradicts messages given by On Balance Volume and the AD line, it shall not be given much weight in this analysis.
Price moved higher, but inverted VIX moved lower. This divergence is bearish.
BREADTH – AD LINE
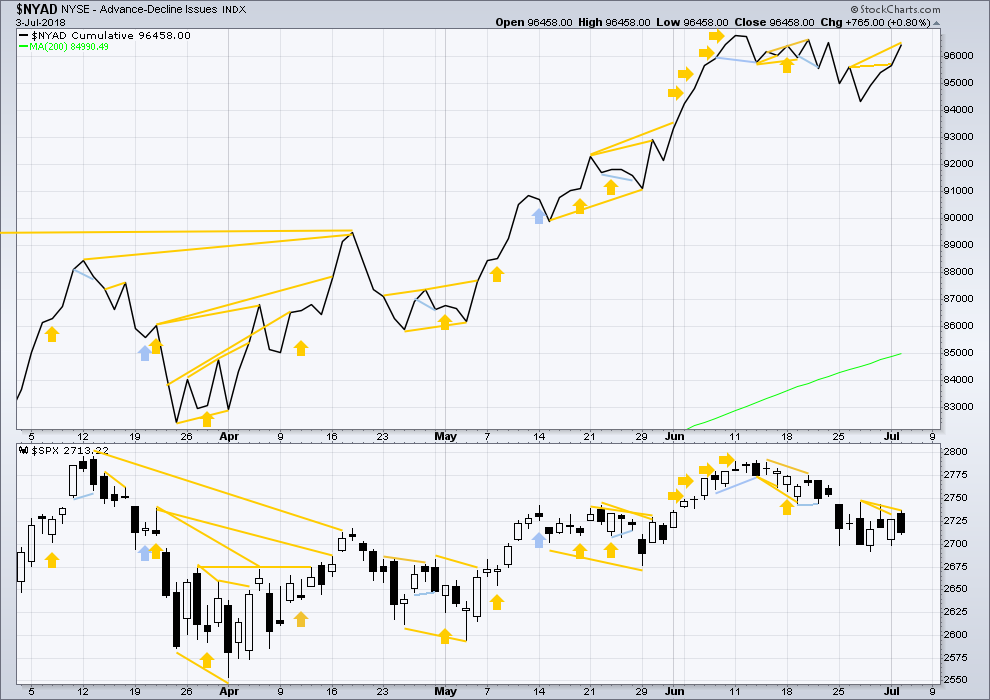
Click chart to enlarge. Chart courtesy of StockCharts.com.
There is normally 4-6 months divergence between price and market breadth prior to a full fledged bear market. This has been so for all major bear markets within the last 90 odd years. With no longer term divergence yet at this point, any decline in price should be expected to be a pullback within an ongoing bull market and not necessarily the start of a bear market. New all time highs from the AD line means that any bear market may now be an absolute minimum of 4 months away. It may of course be a lot longer than that. My next expectation for the end of this bull market may now be October 2019.
Small caps and mid caps have both recently made new all time highs. It is large caps that usually lag in the latter stages of a bull market, so this perfectly fits the Elliott wave count. Expect large caps to follow to new all time highs.
Breadth should be read as a leading indicator.
The AD line has made another new high above its prior small swing high 4 sessions ago, but price has not. This divergence is bullish, and it is now strong and clear. More weight will be given to this signal than inverted VIX because the AD line tends to be a more reliable indicator.
Overall, the AD line still remains mostly bullish as it has made more than one new all time high last week. Price may reasonably be expected to follow through in coming weeks.
DOW THEORY
The following lows need to be exceeded for Dow Theory to confirm the end of the bull market and a change to a bear market:
DJIA: 23,360.29.
DJT: 9,806.79.
S&P500: 2,532.69.
Nasdaq: 6,630.67.
Only Nasdaq at this stage is making new all time highs. DJIA and DJT need to make new all time highs for the ongoing bull market to be confirmed.
Charts showing each prior major swing low used for Dow Theory may be seen at the end of this analysis here.
Published @ 10:05 p.m. EST.
main hourly updated:
this one looks best, so far
At first glance the triangle looked good, but when I adjust the chart to add today’s movement, it doesn’t look so good.
Minuette (e) has well breached the A-C trend line. This is valid, but it doesn’t look normal. I expect the triangle may be invalidated in the next session, it could turn out to be a combination. For this idea of minor 2 continuing lower as a double zigzag that’s okay because the proportion of minute X is okay. but for the second alternate the fourth wave is now much too large if it continues for another day or so
and it’s invalidated in the last minutes of the session
Lara, this Y movement could sync up as part of a larger E wave of an even larger triangle on SPX where A wave low is 2532 in Feb, B wave high 2801 in March, C wave down to 2553 in April, D wave up to 2791 in June, with the E wave in motion now down to the trend line which is right around 2607 which would also really look like a deep 2nd wave, while also whipsawing the 200 day by a couple percentage points. That’s my bull count.
The problem with that is the subdivisions of both C and D of the triangle.
To avoid any truncations, C is best seen as a double zigzag. And that has the best fit. And C is the most common triangle sub-wave to subdivide as a multiple.
But if C is a multiple, then you have to see D as a single zigzag. And if it ended at the last high on the 13th of June then it really will not fit as a single zigzag, but it could fit as a double zigzag. But a triangle may only have one multiple, not two.
That’s one reason why I’ve all but discarded the idea.
10-4, I’m having problems with all subdivisions as you could well imagine….lol. Thank you for the clarity.
NDX is very close to pushing up out of a clear head/shoulders bottom on the hourly.
If that happens, add in the bullish RUT, and IF SPX CAN > 2746…I’d say the bull is snorting inside the ambulance as it heads to the hospital! Tomorrow will be FASCINATING. And since I took a SPY butterfly at 272, some part of is very suspicious that bull is going to wake up overnight instead of early next week, just to spite me.
Well, the market is sitting on a major pivot! Don’t know which way it’s going tomorrow…but it’s not going to stay around this price zone!
Not quite a double off last 15 min shooting star but 25% ain’t bad. Third round trip?
Reloading diamond 243 strike puts…why not? 🙂
As I view charts, RUT is in a bullish configuration on the hourly. Higher swing lows, higher swing highs, and key pivots just taken out.
I’ll be looking for the next pullback to some key fibo level and/or a key pivot or symmetric move length, and a turn back up, and I will take buy triggers. Price action speaks.
Decision point. If this is a triangle, as per Lara’s second hourly chart, it looks pretty nice right now, with a little overshoot of the upper trend line. So do we rocket back down from here in a powerful Y? Or do we rocket upward in that long-awaited third wave?
Or maybe something else we haven’t thought of yet?
Up and through all the overhead resistance would surprise me a lot.
This market is sickly, honestly. Weeks of early morning push, afternoon sell. A big daily TF coil after entry from above. Trade war just getting started, and very doubtful the impacts are priced in yet. These fundamentals appear lined up with the action: growing concern driving market uncertainty (sideways/down ranging). We all know this “war” will only intensify; it’s what this US gov’t does, they never back down or change course, ever. So there’s real chance here that the economy (relatively speaking) tanks vs. the relatively strong vector it’s been on. Short term interest rates are rising and risk of inversion is increasing; the threat of a 2020 recession is looming, and that’s consistent with a deteriorating world economic order as well as a general collapse of traditional alliances and relationships.
So yea, I’ll be mildly surprised at this point to see ANY wave 3 push out of this mess. And if a price FALL out of this mess commences, of course it hits the 200ma, but I quite suspicious we only get increasing momentum downward after that. Consider for example how far BA has to fall. Not to mention some of the tech giants. There are gross over valuations everywhere, against a backdrop of a world heading into a fast deteriorating business environment due to politically driven “economics”.
Sorry, but I hear the bear growling. I hope I’m wrong.
Me too, just laid into IWM and VIX. The bounce off the low was bankster shenanigans; set stops at 2720 level to short SPX. (Not Trading Advice). Double whipsaw likely today……..
I think I hear it too. Might need to get in soon.
Not quite yet. Sumpin’ funky goin’ on. Fed minutes, maybe, if I recall?
ps: fwiw, I can and do change my sentiment very easily (some rip me for being inconsistent, I pride myself on being responsive to changing conditions, where price action is always king!). SPX > 2747 and rising would reorient my view a significant amount. But that’s currently fantasy land, unless and until it isn’t.
I hear ya Kevin and no ripping ever coming from me. Either way clock is ticking, but the banksters are doing a great job of absorbing sellers.
How do we reconcile that view with the Elliot wave count?
Do you have an alternate count for a bear scenario?
I agree with everything you say, but the timing is so tricky.
I think they’re done…
Rolling down USO spreads to 15.00/15.50 strikes. We should head lower in a big fourth.
Banksters having a bit of fun this morning it would seem. ” Shaking the Trees”
Savvy traders getting ready for second daily double.
First on that ridiculous gap up open.
And now again on this equally laughable re-ramp. What clowns! 😉
SPX getting up to test zone, where there are multiple hourly pivot highs, and the descending trend line over this entire minor 2. All in the 2734-37 zone. A giant volume pocket there; for sure price won’t stay there. I’m watching for the turn back down, and if it comes, it should go all the way back to the lower triangle line.
I said the other day that TLT needed to break 122.50 to get me bullish. It proceeded to exactly though 122.50, then drop back into the 121’s. It’s now pushing back up to retest 122.50. Note that if it goes through that…dropping interest rates will hurt financials, and SPX isn’t going anywhere without financials. So something to keep an eye on. I keep putting on additional super cheap put ratio backspreads here and there; I just put one on XLY, for example, cost me only $2. Remember that market STRENGTH tends to lead to MORE STRENGTH…and vice versa. We haven’t seen any strength in many weeks now.
Some of you will find this amusing.
BofA just released a report that says all rise in the market from the early 2018 low to date is due to stock buy backs.
Hard to see fundamentally why and how any sort of significant bull market emerges here. The world economic system is under attack and it’s only increasing.
Be careful out there.
Very insightful article.
What BofA did not tell you is the corporations that floated bonds to repurchase shares are also seriously underwater, down an average 8% on purchase price. They have to service those bonds in a rising interest rate and declining earnings environment. Not good!
It looks like when this bubble eventually bursts it’s going to be quite spectacular.
My only word of caution here, would be that weakness in the markets mentioned in comments here has been evident for a long time now. It was discussed as intermediate (3) came to an end. Yet price kept going up.
It looks like this market can continue on upwards despite underlying weakness of various types. It has done so last year, and we must allow for it to continue.
Like a rubber band it’s being stretched thin and very long. When the pull forces let go, it’s going to snap back real hard.
But not yet.
I see the chances of being around that (SPY) 272 volume node at Friday’s option expiration as very darn high. So much so I’m going to put on a short duration butterfly on SPX, 10 point wings, centered at 2720. Max loss $110, max win about $800. And I can get out for a lot less than $110 if the market heads away.
Note if price gets into the air pocket below and breaks the lows, it’s heading to 265-267, the next high volume node. I’ll be getting on board that and dismantling my butterfly (if I even get it on) quickly should price start dropping.
Used SPY, 272 body, 270/274 wings.
Due to 4th of July today, it will be a short session with NYSE closing at 1pm. It will probably be rather quiet.
Happy 4th of July to all our members in the USA! May you all have a lovely holiday and celebrate your independence.
Really SUPERB charting Lara.
Thanks so much for all you do for the gang…! 🙂
You’re most welcome
I’m working on some EW research, and I may have something to share with you all soon for Gold. Then S&P next. I’m quite excited about it!
Goody! Gold has been rather quiet of late. Great for credit spreads!?
Loads of Smart money buying physical……..
US markets closed at 1pm July 3rd and remain closed on the 4th.
Lots of fireworks and BBQ here in the Midwest today and all over the country.
And it’s about 100 degrees F. here in St. Louis
Cheers!
Yes, I see nothing new to analyse for the S&P today.
100 is hot!
Thanks for your market guidance Lara.
Let’s see what the 2nd half brings us. “There are disturbances in the force”, and I suspect we’ll have larger events of political and economic significance coming fast and furious up to and through the Nov US mid-term election. How the market steers it remains to be seen but I do expect major large chop, at a minimum.
We will see!