
An outside day leaves both hourly wave counts valid.
A new daily wave count is added today to the analysis.
Summary: This pullback does not look complete. Expect downwards movement for at least the start of tomorrow’s session. The target is about 2,670. If price moves below this target, then look for very strong support at the black trend line on the daily chart, which sits about 2,658.
When this pullback is done, then look for strong upwards movement.
The invalidation point must remain at 2,594.62.
The mid to longer term target is at 2,922 (Elliott wave) or 3,045 (classic analysis). Another multi week to multi month correction is expected at one of these targets.
The final target for this bull market to end remains at 3,616.
Pullbacks are an opportunity to join the trend.
Always practice good risk management. Always trade with stops and invest only 1-5% of equity on any one trade.
New updates to this analysis are in bold.
The biggest picture, Grand Super Cycle analysis, is here.
Last historic analysis with monthly charts is here, video is here.
ELLIOTT WAVE COUNT
WEEKLY CHART
Click chart to enlarge.
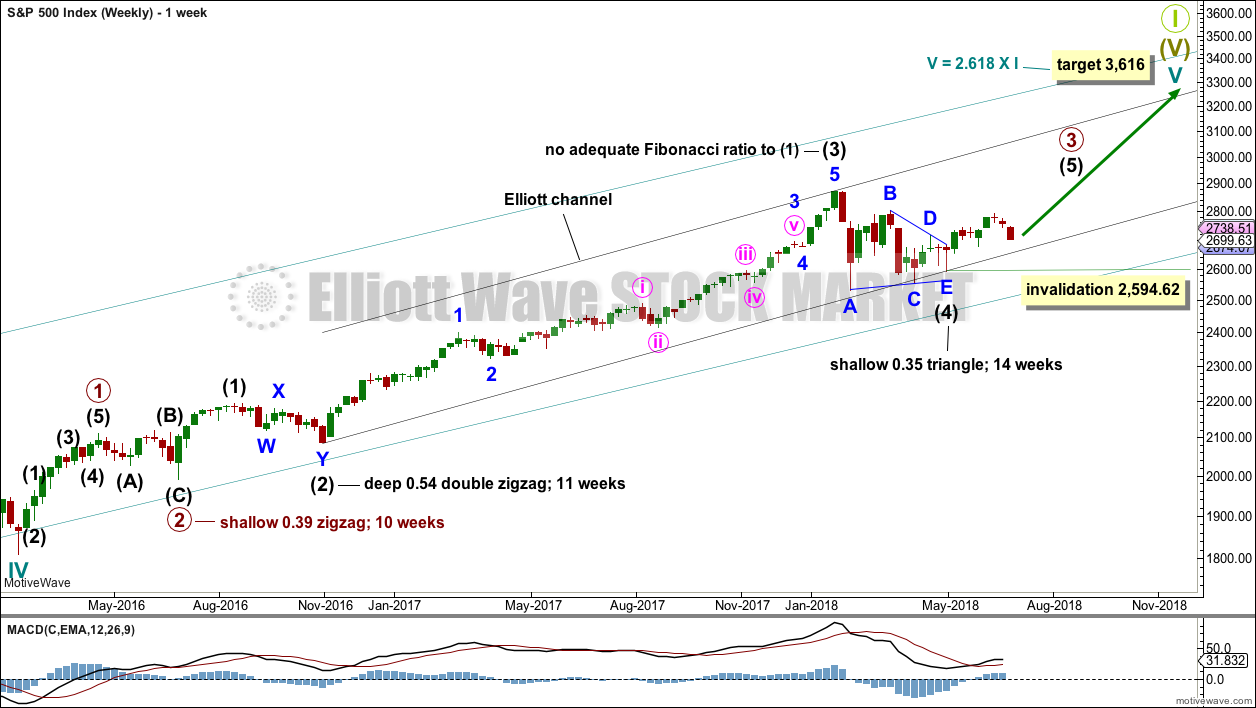
Cycle wave V must complete as a five structure, which should look clear at the weekly chart level and also now at the monthly chart level. It may only be an impulse or ending diagonal. At this stage, it is clear it is an impulse.
Within cycle wave V, the third waves at all degrees may only subdivide as impulses.
Intermediate wave (4) has breached an Elliott channel drawn using Elliott’s first technique. The channel is redrawn using Elliott’s second technique: the first trend line from the ends of intermediate waves (2) to (4), then a parallel copy on the end of intermediate wave (3). Intermediate wave (5) may end either midway within the channel, or about the upper edge.
Intermediate wave (4) may now be a complete regular contracting triangle lasting fourteen weeks, one longer than a Fibonacci thirteen. There is perfect alternation and excellent proportion between intermediate waves (2) and (4).
Within intermediate wave (5), no second wave correction may move beyond the start of its first wave below 2,594.62.
DAILY CHART
Click chart to enlarge.
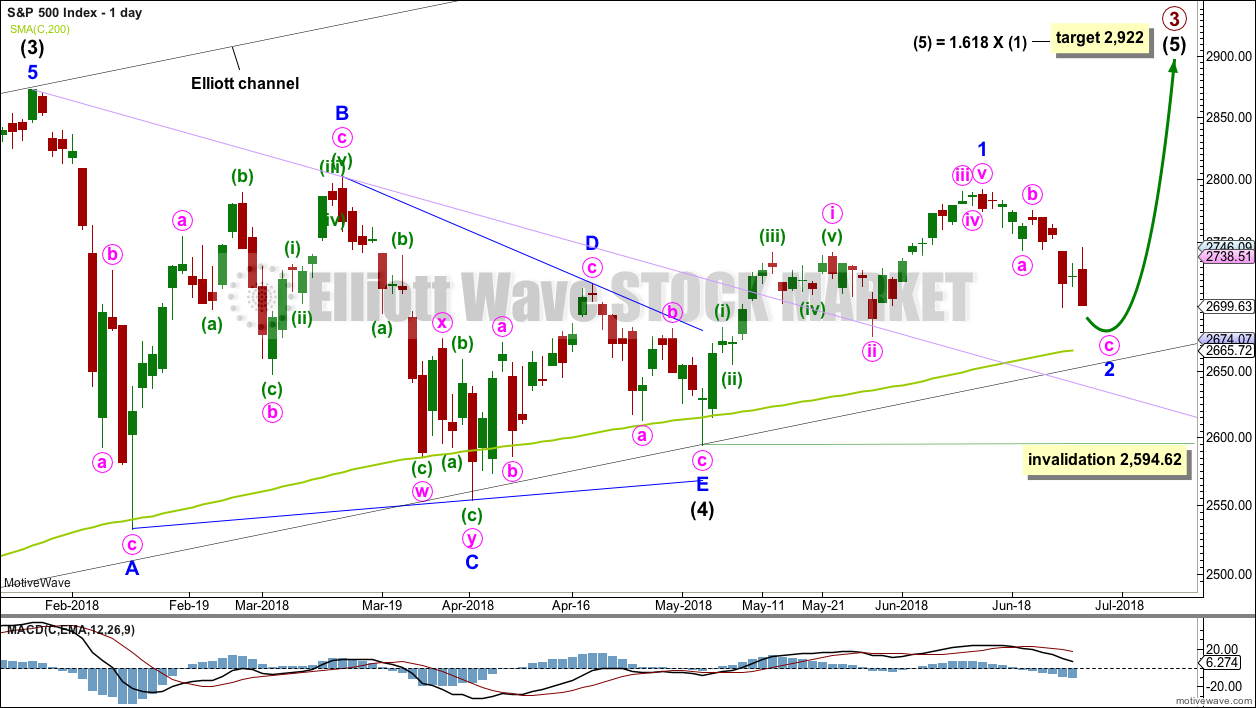
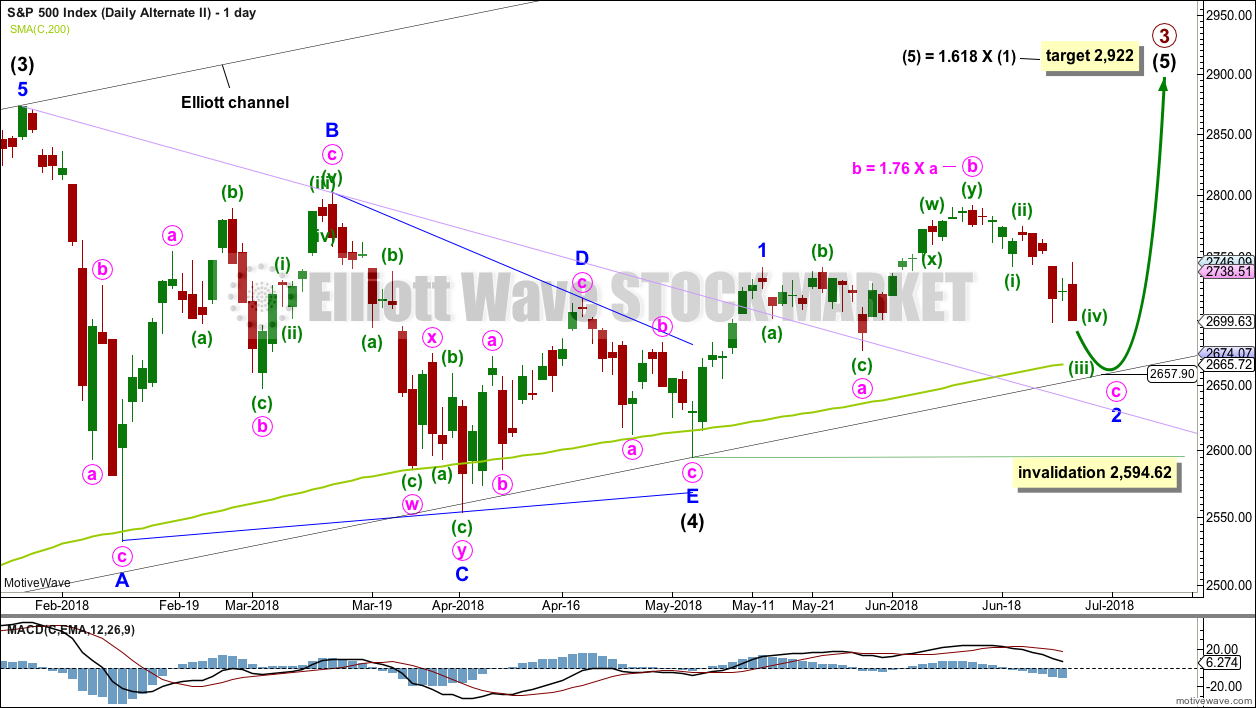
It is possible that intermediate wave (4) is a complete regular contracting triangle, the most common type of triangle. Minor wave E may have found support just below the 200 day moving average and ending reasonably short of the A-C trend line. This is the most common look for E waves of triangles.
Intermediate wave (3) exhibits no Fibonacci ratio to intermediate wave (1). It is more likely then that intermediate wave (5) may exhibit a Fibonacci ratio to either of intermediate waves (1) or (3). The most common Fibonacci ratio would be equality in length with intermediate wave (1), but in this instance that would expect a truncation. The next common Fibonacci ratio is used to calculate a target for intermediate wave (5) to end.
Price has clearly broken out above the upper triangle B-D trend line. This indicates that it should now be over if the triangle is correctly labelled.
A trend line in lilac is added to this chart. It is the same line as the upper edge of the symmetrical triangle on the daily technical analysis chart. Price found support about this line.
Minor wave 1 may have been over at the last high. Minor wave 1 will subdivide as a five wave impulse on the hourly chart; the disproportion between minute waves ii and iv gives it a three wave look at the daily chart time frame. The S&P does not always exhibit good proportions; this is an acceptable wave count for this market.
It looks like minor wave 2 may move lower tomorrow. It may end close to the 0.618 Fibonacci ratio of minor wave 1, which is about 2,670. If it moves below this point, then look for very strong support about the lower edge of the black Elliott channel, which is copied over from the weekly chart. For tomorrow that point is about 2,658.
When minor wave 2 may again be complete, then a target will be calculated for minor wave 3.
Minor wave 2 may not move beyond the start of minor wave 1 below 2,594.62.
HOURLY CHART
Click chart to enlarge.
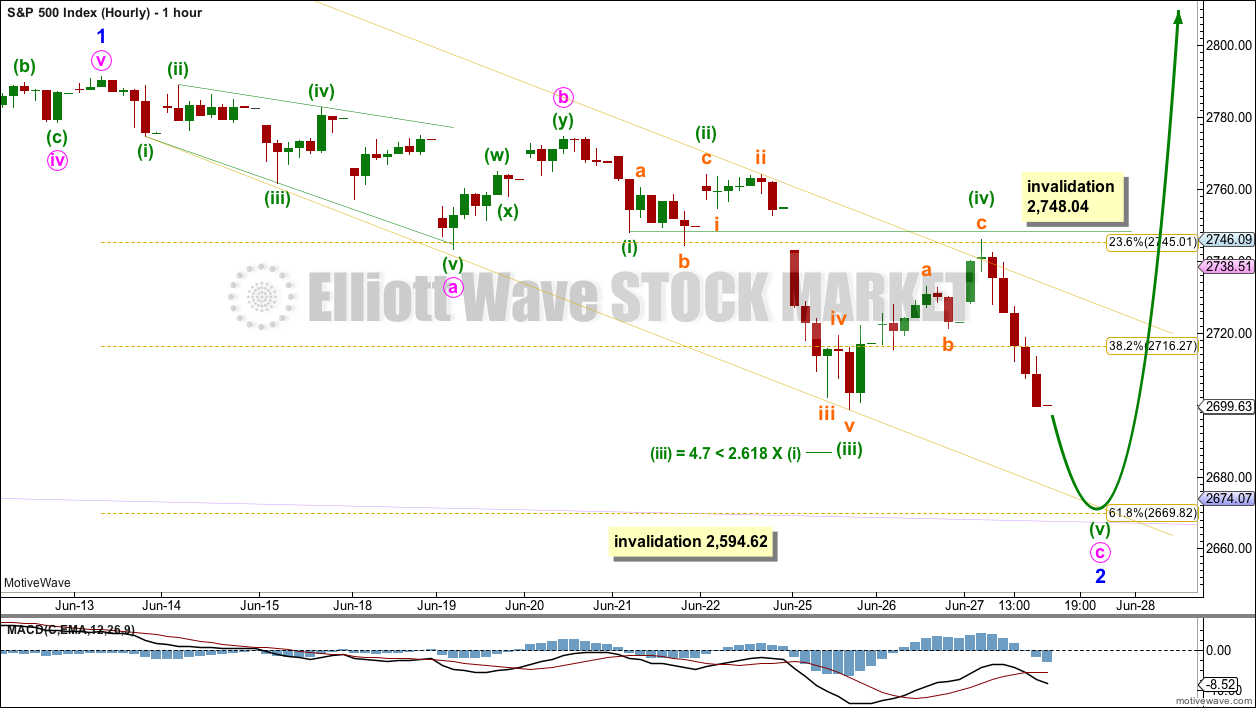
This hourly wave count is slightly adjusted from yesterday’s alternate.
Minor wave 2 is still seen as a zigzag. Within minute wave c, minuette wave (ii) is an expanded flat and minuette wave (iv) may be a completed zigzag. There is perfect alternation here.
If minor wave 2 is continuing lower, then it may end close to the 0.618 Fibonacci ratio of minor wave 1 about 2,670.
This wave count has good support today from classic technical analysis with both the AD line and inverted VIX exhibiting bearish divergence.
Minor wave 2 may not move beyond the start of minor wave 1 below 2,594.62.
ALTERNATE DAILY CHART
Click chart to enlarge.
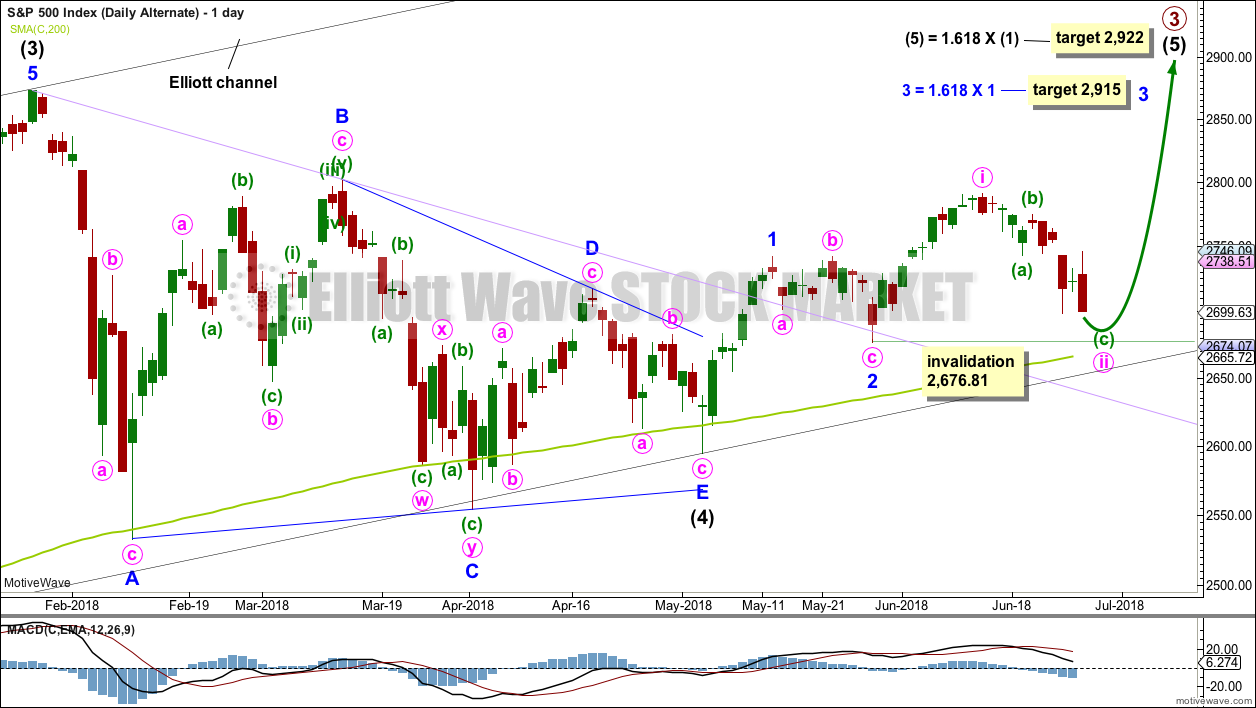
It is possible that minor waves 1 and 2 are already over. The last high may have been minute wave i. Minute wave ii may need one more low to be complete. An hourly chart for this daily alternate would be labelled exactly the same as the hourly chart above, with the exception of the degree of labelling.
Minute wave ii may not move beyond the start of minute wave i below 2,676.81.
This alternate wave count resolves the problem of an odd looking minor wave 1 for the main wave count. The only problem with this alternate wave count is minute wave ii is not contained within a base channel which would be drawn about minor waves 1 and 2.
This wave count is very bullish. It expects to see a very strong upwards movement as the middle of a third wave begins here or within a very few days.
SECOND ALTERNATE DAILY CHART
Click chart to enlarge.
It is also possible that minor wave 1 ended earlier and current downwards movement is the end of an expanded flat correction for minor wave 2.
The 0.618 Fibonacci ratio of minor wave 1 here would be about 2,651. This would be very slightly below the lower edge of the black Elliott channel and slightly below the 200 day moving average.
This second alternate wave count expects a somewhat deeper pullback about here to make a new low below the end of minute wave a at 2,676.81, so that minute wave c avoids a truncation and minor wave 2 avoids a running flat correction.
Minor wave 2 may not move beyond the start of minor wave 1 below 2,594.62.
TECHNICAL ANALYSIS
WEEKLY CHART
Click chart to enlarge. Chart courtesy of StockCharts.com.
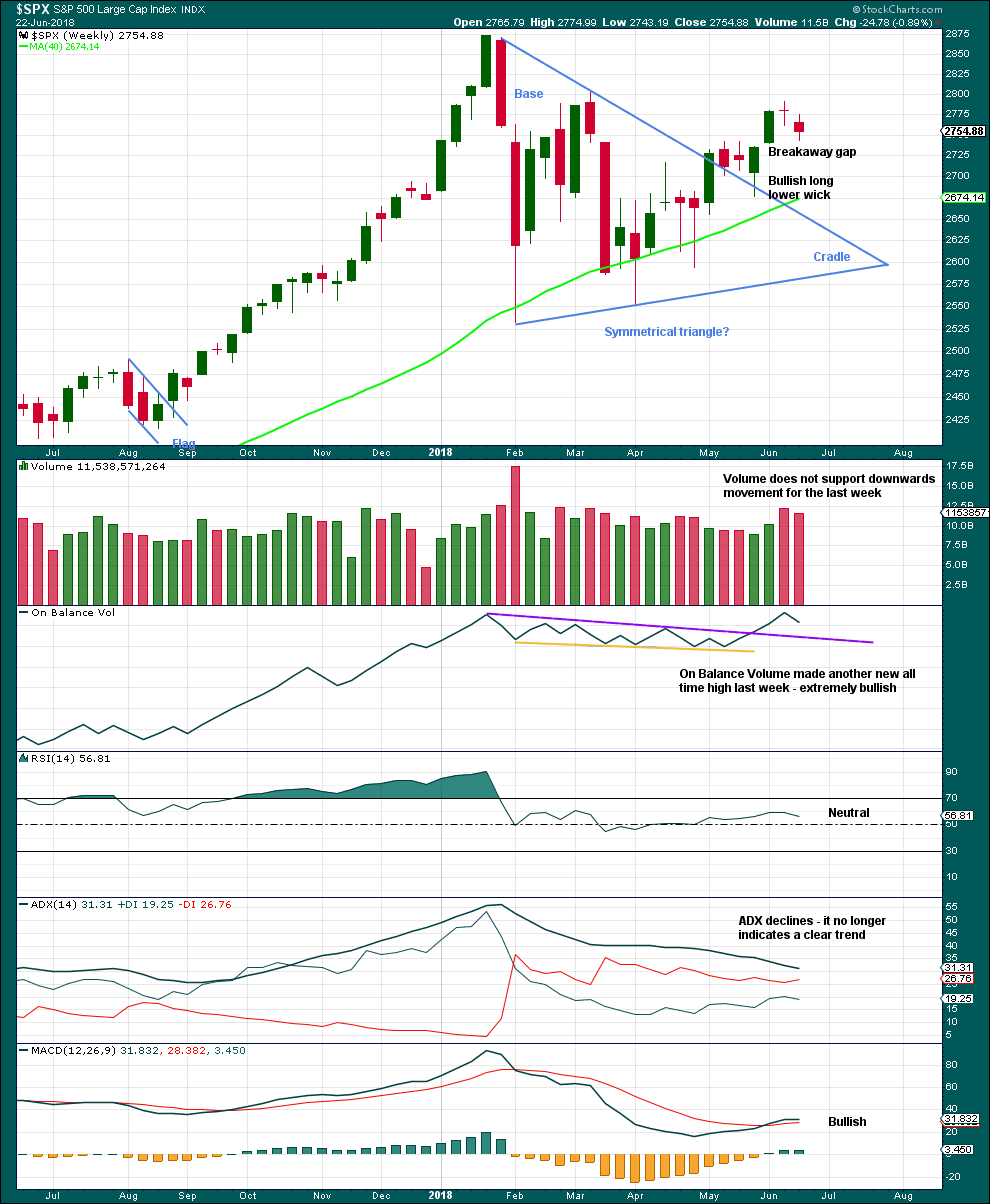
Last week’s spinning top candlestick pattern again signals a balance of bulls and bears. With volume not supporting downwards movement, it looks like bears may be tiring.
This chart is very bullish.
DAILY CHART
Click chart to enlarge. Chart courtesy of StockCharts.com.
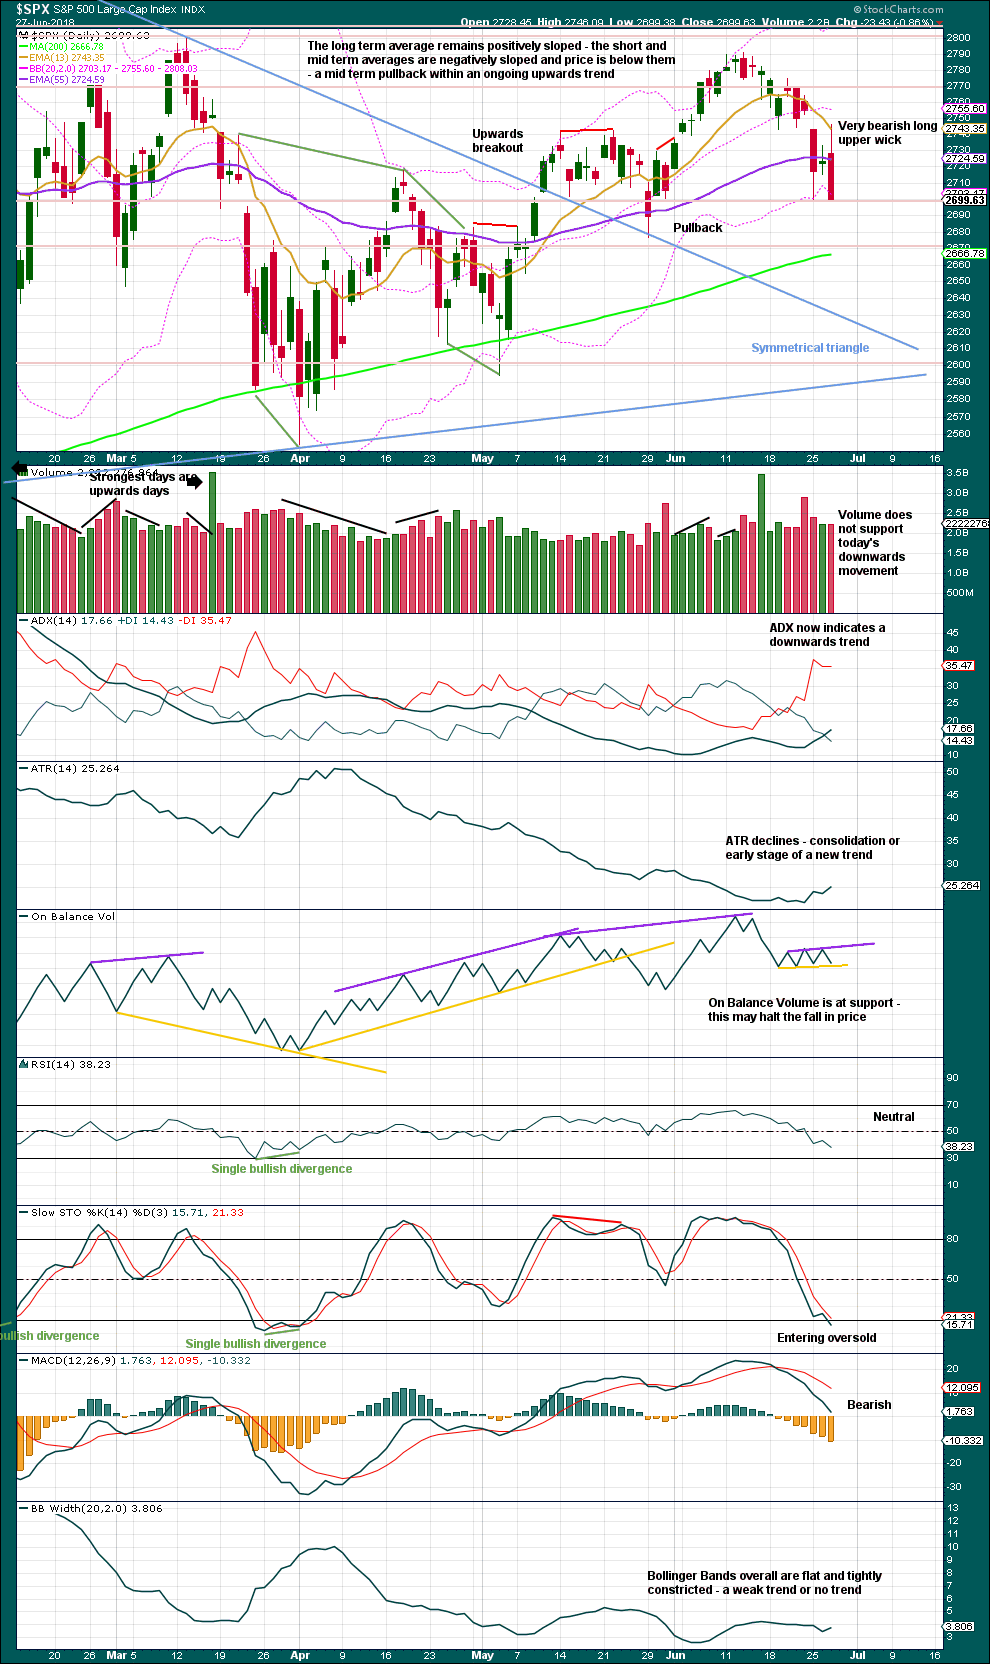
The symmetrical triangle may now be complete. The base distance is 340.18. Added to the breakout point of 2,704.54 this gives a target at 3,044.72. This is above the Elliott wave target at 2,922, so the Elliott wave target may be inadequate.
Since the low on the 2nd of April, 2018, price has made a series of higher highs and higher lows. This is the definition of an upwards trend. But trends do not move in perfectly straight lines; there are pullbacks and bounces along the way. While price has not made a lower low below the prior swing low of the 29th of May, the view of a possible upwards trend in place should remain.
This last low is right about support at about 2,700. The long lower wick is very bullish, and with a series of long lower wicks within this pullback, together they may be read as a warning sign that on each of those days the bears were not able to hold the lows. This is bullish.
So far this looks like a typical pullback within an ongoing and developing upwards trend.
VOLATILITY – INVERTED VIX CHART

Click chart to enlarge. Chart courtesy of StockCharts.com. So that colour blind members are included, bearish signals
will be noted with blue and bullish signals with yellow.
Normally, volatility should decline as price moves higher and increase as price moves lower. This means that normally inverted VIX should move in the same direction as price.
Inverted VIX has made a new high above the prior swing high of the 9th of March, but price has not made a corresponding new swing high about the same point yet. This divergence is bullish. Inverted VIX is still a little way off making a new all time high.
There is mid term bearish divergence between price and inverted VIX: inverted VIX has made a new swing low below the prior swing low of the 29th of May, but price has not. Downwards movement has strong support from increasing market volatility; this divergence is bearish. However, it must be noted that the last swing low of the 29th of May also came with bearish divergence between price and inverted VIX, yet price went on to make new highs.
This divergence may not be reliable. As it contradicts messages given by On Balance Volume and the AD line, it shall not be given much weight in this analysis.
Both inverted VIX and price moved lower today to make new lows below the low two sessions prior, so there is no divergence. However, inverted VIX is moving more strongly than price and this does look bearish.
BREADTH – AD LINE
Click chart to enlarge. Chart courtesy of StockCharts.com.
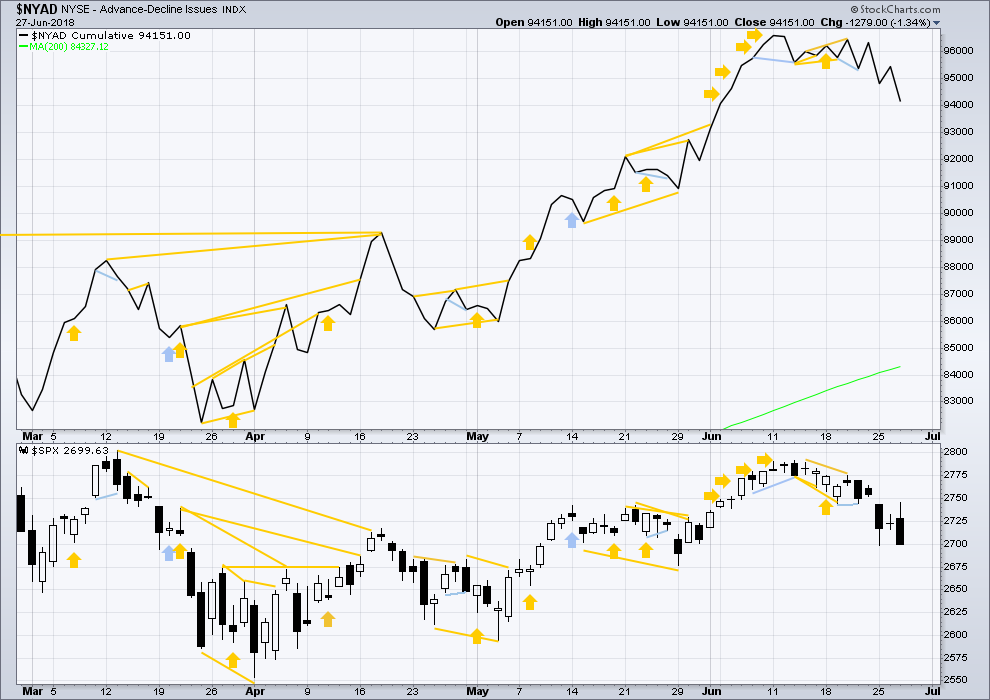
There is normally 4-6 months divergence between price and market breadth prior to a full fledged bear market. This has been so for all major bear markets within the last 90 odd years. With no longer term divergence yet at this point, any decline in price should be expected to be a pullback within an ongoing bull market and not necessarily the start of a bear market. New all time highs from the AD line means that any bear market may now be an absolute minimum of 4 months away. It may of course be a lot longer than that. My next expectation for the end of this bull market may now be October 2019.
Small caps and mid caps have both recently made new all time highs. It is large caps that usually lag in the latter stages of a bull market, so this perfectly fits the Elliott wave count. Expect large caps to follow to new all time highs.
Breadth should be read as a leading indicator.
Both price and the AD line today made new lows below the last low two sessions prior, so there is no divergence. However, the AD line is moving lower more strongly than price and this is slightly bearish.
Overall, the AD line still remains mostly bullish as it has made more than one new all time high last week. Price may reasonably be expected to follow through in coming weeks.
DOW THEORY
The following lows need to be exceeded for Dow Theory to confirm the end of the bull market and a change to a bear market:
DJIA: 23,360.29.
DJT: 9,806.79.
S&P500: 2,532.69.
Nasdaq: 6,630.67.
Only Nasdaq at this stage is making new all time highs. DJIA and DJT need to make new all time highs for the ongoing bull market to be confirmed.
Charts showing each prior major swing low used for Dow Theory may be seen at the end of this analysis here.
Published @ 09:35 p.m. EST.
for the second daily alternate, here’s an hourly chart
this idea, an expanded flat completing for minor 2, needs a five down (not a three) to complete for minute c.
it needs to end below 2,676.81 so that minute c moves below minute a, avoiding a truncation and a very rare running flat
so it’s possible we may yet see one more low before this pullback is done
updated hourly chart:
if the pullback is a simple zigzag then it could be over at todays low
the second alternate is also valid, I’ll chart the hourly for that now
Hmmm….XLF up almost 1%. GS has the most bullish day in about 6 weeks, and the weekly bar is looking very much like a reversal bar. TLT still hasn’t pushed up past 122.5 and is trending down on thhe hourly. A rising interest rate could breath a touch of life back into finance (long since given up for dead for whatever rotational or fundamental reasons).
FXE is acting kinda strange. I went long via bull put spreads following a very nice hammer in a downtrend on the 60 minute chart. Even better, we had a gap higher next day that appeared to confirm the bottom so I pulled the trigger. Despite the signals, I got stopped out the next day. It was probably too tight and I also could have been ambushed. So far we have not made a new low. Redeployed bull spread at lower strikes. So far so good. Only 50 contracts. Don’t want any more excitement….
It was a good reminder that market signals do not always work, and false triggers can and do happen, especially in this kind of market. Trade Safe.
“Pullbacks are an opportunity to join the trend.”
Is today a good spot to go long the RUT?
Only you can answer that question for yourself of course.
The bullish case as I see it is that the recently weekly has bounced off a major 38% and just about tagged the 13 week ema. The daily is bouncing off lower 21 period true range and std deviation bands and channels.
The 5 minute has polarity shifted to up.
The hourly has not, and is still riding under it’s downtrend line.
Me, I would want to see the hourly polarity shift up and break that trend line to consider putting on a long here.
If you’re not too concerned about trying to pick the absolute end of the pullback, then yes, it looks like a good point to enter long. But if doing that you’d have to be prepared for two things:
1. an underwater position for about three or four days
2. a loss if the wave count is wrong
To mitigate these two possibilities, setting a stop far enough away to allow the market room to move and then reducing position size so that if your stop is hit your loss is only 1-5% of equity.
That would be my approach.
But this comes with the strong caveat, that I do not have a wave count for RUT, so this advice applies to the S&P. If you’re trading RUT then you make an assumption that the wave count and analysis for the S&P is the same or mostly similar to RUT. Which is a reasonable assumption, but it’s still an assumption.
The other less risky approach, is to wait for some reversal signs (a bullish reversal candlestick on the daily chart, a channel breach, bullish signal from On Balance Volume or the AD line… or a combination of those) before entering long. That means you don’t enter so close to the low, but you reduce risk. It also means you may still have to endure an underwater position after entry as you may have to ride through an early pullback, if your position is a longer term one and not just daily that is.
Thanks for the advice. I decided not to invest in an index fund that mimics the RUT (as I have been) but instead I just bought a generic CRSP index fund as this is an employer sponsored 401k account and my choices are limited. I bought small cap funds on April 2nd and 26th (thanks in part to your analysis btw) so I decided maybe I should broaden my horizon a little in case the large caps start moving. I don’t mind if I’m under water for a few days, I just want to ride this intermediate 5 wave until Primary 3 is complete and then re-evaluate my equity exposure.
It might be worth a look at a longer term chart of RUT.
ES is telling us in no uncertain terms we do not yet have a bottom, even though a lot traders are calling for it. Move off lows clearly corrective. Have a great evening all!
I see a sequence of lower lows/lower highs on the hourly that will continue until it doesn’t. Meaning, yes, the current move up is a short opportunity. 2718-2724 is the most likely turn zone.
Yep. Looking that way…
Except this is now a very strong, very bullish daily reversal bar. Assuming it reasonably holds up through the close. My concerns about rapid and deep price collapse in the next few days are significantly dampened. At the very least, momentum here is greatly reduced. While 2680 is still very possible, I’m much less worried that it might plunge to 2560 by mid July, for example. I was thinking that was a perhaps 25-30% possibility; now maybe 15%.
I want to see polarity inversion on the hourly, and I want to see some trend lines busted to the up side. I’m sure there’ll be a kick back off the 62% at 2725 (already starting), but if that falls tomorrow on a fresh push up, odds are this nasty consolidation is over.
At the close, my 30-minute charts are still bearish. Hopefully tomorrow will show us which of Lara’s scenarios gains the upper hand.
For the SP500 – It looks like we have broken the 50 day MA 5 times since the beginning of the year ( yesterday was the sixth time ) . 4 of the last 5 , the SP500 has gone on to the bounce on the 200 day MA .
Comments ?
I don’t think that means 80% chance. To little data across a period with high volatility “brownian motion”.
What chance, I don’t know. Until our daily level bullish count is busted, it’s one of my anchors in my view and setups. Not really close to that yet. But certainly risk is far higher than a week ago!
In conjunction with what some other important indices are doing, like Nasdaq, and DJT, I would say odds are high we will see a revisit…so important to sometimes step back from the minutiae and look at the bigger picture; very hard for us to do sometimes as traders….. 🙂
For an intermediate degree correction, that’s exactly what I’d expect.
Now, for a fifth wave (the last of two) upwards, I’d expect reasonable weakness.
It fits well with my expectations if the wave count is correct at the weekly chart level.
Surprise, 2700 is now the 62% of this morning’s up move, and price has just bounced off it. For the moment; it very well may fail here. But if it holds, it could be good for the longer term.
Quite natural to see a bounce at round number resistance. They really need to clear 2720 for the immediate bullish case as that is where the real contest was.
The low this morning was exactly at the derivative fibonacci level 1.28% of the Wednesday low to high move, on the /ES. Classic.
INTC has been a bit sick. That said, it’s tagged (close enough) a major 38% retrace level, exactly at a symmetric move projection (the Jan-Feb ’18 down move).
I’ll be taking a turn here with buy triggers, assuming there’s broader market support.
Talk about sick Kevin, ABBV is right now on its 6th day under its lower BB.
I’m still waiting to go long on this one. I have a feeling it will pop up hard like the oil stocks…
My mistake, its above its BB, just pierced it though for the 6th day in a row in the morning hours…
I’m waiting for the next leg of this pattern to commence. And even then…we’ll see.
A failure to get even round number support at 2700 would suggest a market even weaker than I thought. The good thing is that if we break it we will quickly go to next support level that should provide an at least interim bottom.
Some clueless individual just attempted to hammer volatility….not so fast Sherlock! 🙂
gotta love this market teetering on the edge of a small cliff action! i added an SPX bear put spread to get a little downside risk coverage here. Could leg down to 2680 zone or lower in a heartbeat.
The critical level to watch is 2720.
A tremendous amount of capital was expended trying to defend it and the bulls lost. The announcement about trade was a contrivance in an attempt to retake that level but as you saw the ramp back above was short lived. The challenge for the bulls is that level might now be resistance. We will likely bounce back there and if it halts upward movement we could see 2625.
Have a great trading day.
I think the Alternate daily looks like a better fit. I don’t like the way in the main Daily count that minute III, IV and V are all bunched tightly in close proximity within Minor 1
Agree.
and more agreement from me
but, I have learned over the years to consider waves that look like this for the S&P
I wouldn’t consider it for Gold, but the S&P behaves differently.
my spx view. shaded area is where I will be watching intently for a turn.
Target/turn zones in $DXY. Trendy instrument, and obviously in one now.
Do you think this will be “THE” Turn to new highs or another false turn?
Well…looking at the monthly chart, it’s clear what the course of the river is. So I’d say it’s more likely it’s a significant low that holds until the market reaches a new ATH. But I’m staying nimble, that’s for sure. The interdependent world economy is under attack, and that hurts business, and that hurts the valuation of companies, as we’ve been seeing. If the attacks keep ramping up, I do believe this market could go over a cliff in due time.
Joseph I assumed you were asking about SPX, and my answer was in the context of SPX. But if you were asking about $DXY…I have zero clue how high the current up trend runs. But I’ve got a bull debit spread on UUP to get whatever it’ll give me!
SPX is correct.
Dollar move up almost done.