
Upwards movement was expected for the last session, but this is not what happened as price moved lower. However, price remains above the invalidation point.
A new short term Elliott wave count is considered today.
Summary: Bearish divergence today between price and VIX and the AD line suggests more downwards movement tomorrow. The pullback does not look complete; the target is now about 2,721.
Overall, an upwards trend is still expected to be developing. The short term target is at 2,915. A sideways consolidation to last about a week is expected about this target.
The mid to longer term target is at 2,922 (Elliott wave) or 3,045 (classic analysis). Another multi week to multi month correction is expected at one of these targets.
The final target for this bull market to end remains at 3,616.
Pullbacks are an opportunity to join the trend.
Always practice good risk management. Always trade with stops and invest only 1-5% of equity on any one trade.
New updates to this analysis are in bold.
The biggest picture, Grand Super Cycle analysis, is here.
Last historic analysis with monthly charts is here, video is here.
ELLIOTT WAVE COUNT
WEEKLY CHART
Click chart to enlarge.
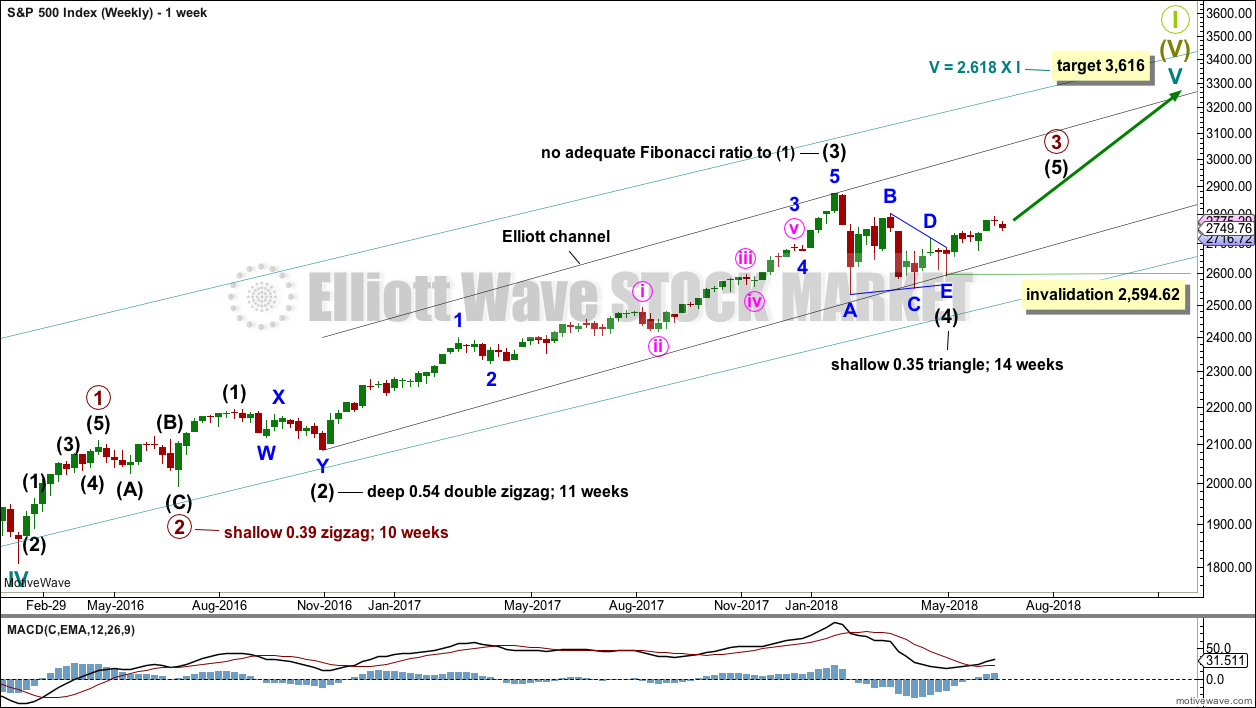
Cycle wave V must complete as a five structure, which should look clear at the weekly chart level and also now at the monthly chart level. It may only be an impulse or ending diagonal. At this stage, it is clear it is an impulse.
Within cycle wave V, the third waves at all degrees may only subdivide as impulses.
Intermediate wave (4) has breached an Elliott channel drawn using Elliott’s first technique. The channel is redrawn using Elliott’s second technique: the first trend line from the ends of intermediate waves (2) to (4), then a parallel copy on the end of intermediate wave (3). Intermediate wave (5) may end either midway within the channel, or about the upper edge.
Intermediate wave (4) may now be a complete regular contracting triangle lasting fourteen weeks, one longer than a Fibonacci thirteen. There is perfect alternation and excellent proportion between intermediate waves (2) and (4).
Within intermediate wave (5), no second wave correction may move beyond the start of its first wave below 2,594.62.
DAILY CHART
Click chart to enlarge.
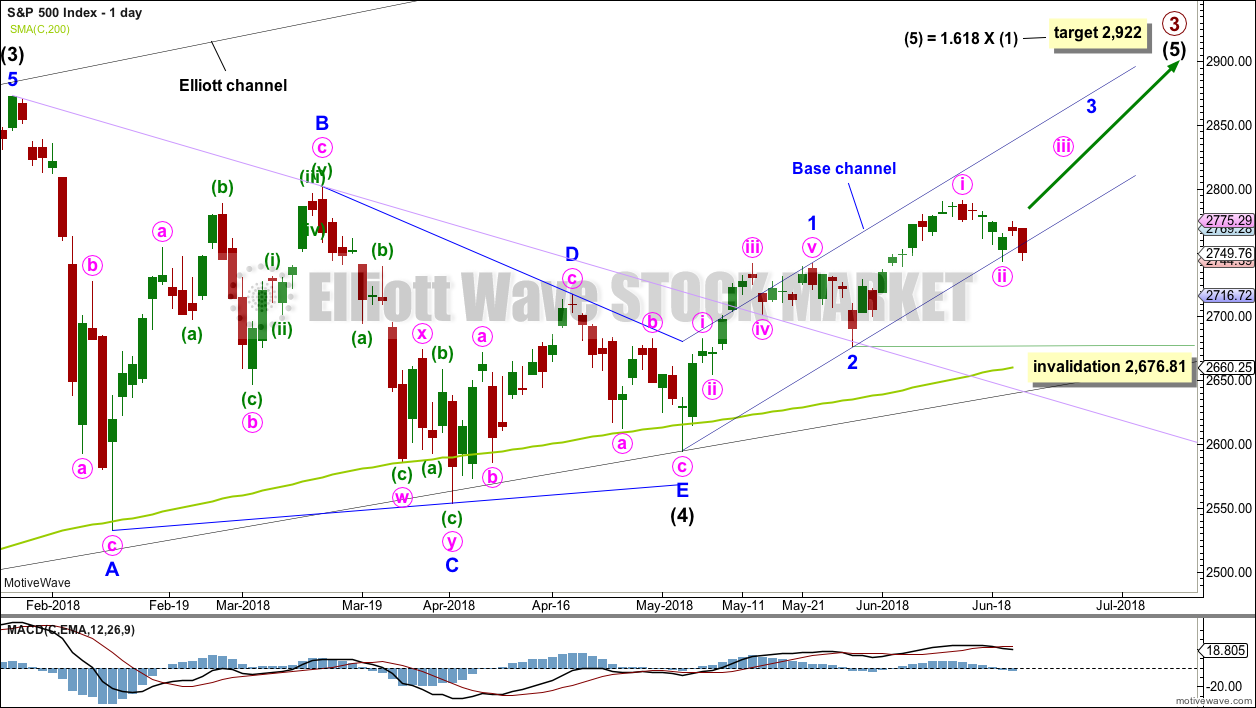
It is possible that intermediate wave (4) is a complete regular contracting triangle, the most common type of triangle. Minor wave E may have found support just below the 200 day moving average and ending reasonably short of the A-C trend line. This is the most common look for E waves of triangles.
Intermediate wave (3) exhibits no Fibonacci ratio to intermediate wave (1). It is more likely then that intermediate wave (5) may exhibit a Fibonacci ratio to either of intermediate waves (1) or (3). The most common Fibonacci ratio would be equality in length with intermediate wave (1), but in this instance that would expect a truncation. The next common Fibonacci ratio is used to calculate a target for intermediate wave (5) to end.
Price has clearly broken out above the upper triangle B-D trend line. This indicates that it should now be over if the triangle is correctly labelled.
A trend line in lilac is added to this chart. It is the same line as the upper edge of the symmetrical triangle on the daily technical analysis chart. Price found support about this line.
Minor wave 3 may only subdivide as an impulse, and within it the subdivisions of minute waves ii and iv may show up as one or more red daily candlesticks or doji.
At this stage, price is now below the lower edge of the base channel drawn here about minor waves 1 and 2. While base channels most often show where price may find support or resistance, they do not always work.
Minute wave ii may not move beyond the start of minute wave i below 2,676.81.
HOURLY CHART
Click chart to enlarge.
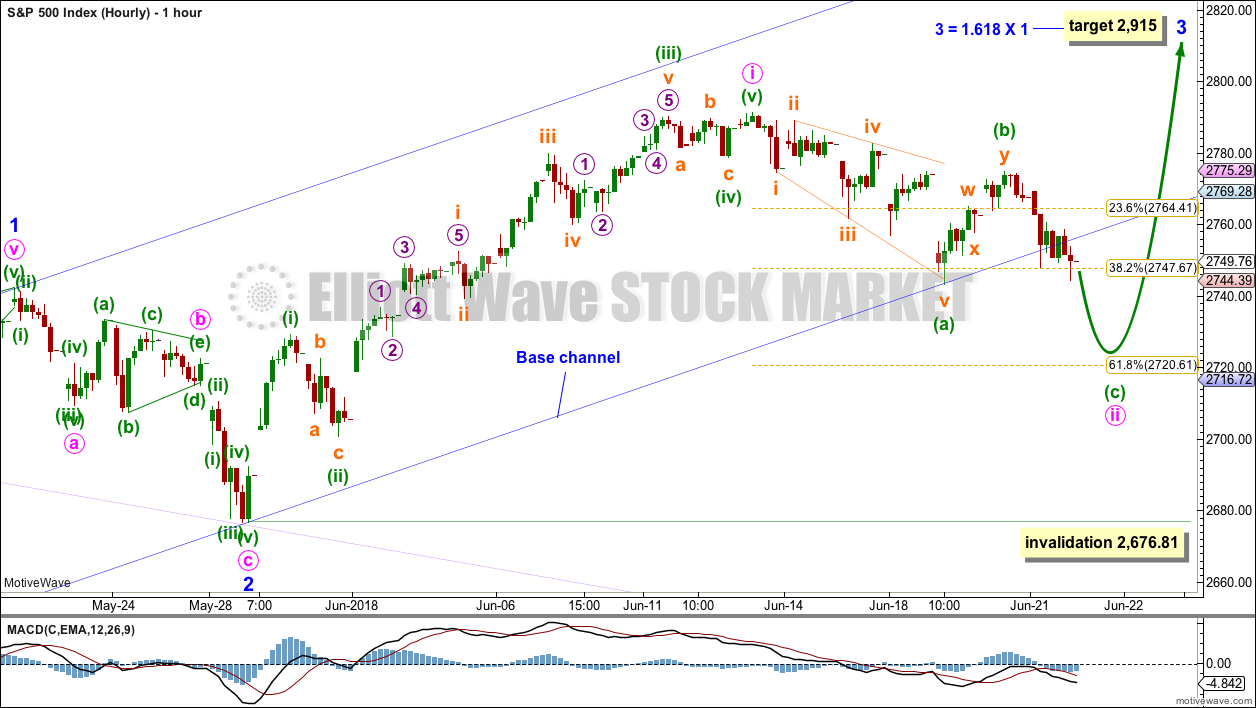
Minor wave 3 may only subdivide as an impulse, and within it all third waves at all degrees may only subdivide as impulses.
Minute wave ii may now be moving lower as a zigzag, and it may end close to the 0.618 Fibonacci ratio of minute wave i about 2,721. Thereafter, upwards movement may resume and may show some increase in momentum.
ALTERNATE HOURLY CHART
Click chart to enlarge.
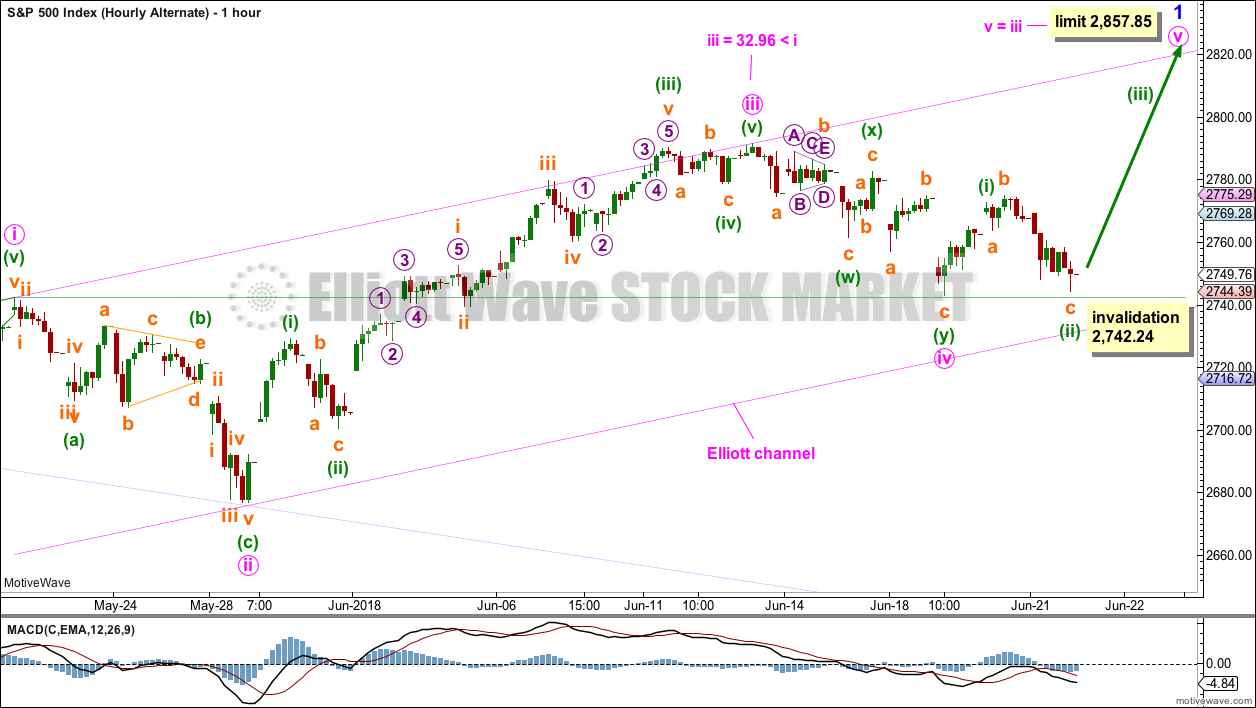
This alternate wave count moves the degree of labelling within minor wave 1 down one degree. Minor wave 1 may be an incomplete impulse, and the current pullback may be minute wave iv.
Minute wave iv may not move into minute wave i price territory below 2,742.24.
If this wave count is correct, then minute wave iii is shorter than minute wave i by 32.86 points. This limits minute wave v to no longer than equality in length with minute wave iii, so that minute wave iii is not the shortest actionary wave within the impulse and a core Elliott wave rule is met.
This wave count is valid, but today it does not have support from classic technical analysis, so it may be quickly invalidated by a little more downwards movement tomorrow.
TECHNICAL ANALYSIS
WEEKLY CHART
Click chart to enlarge. Chart courtesy of StockCharts.com.
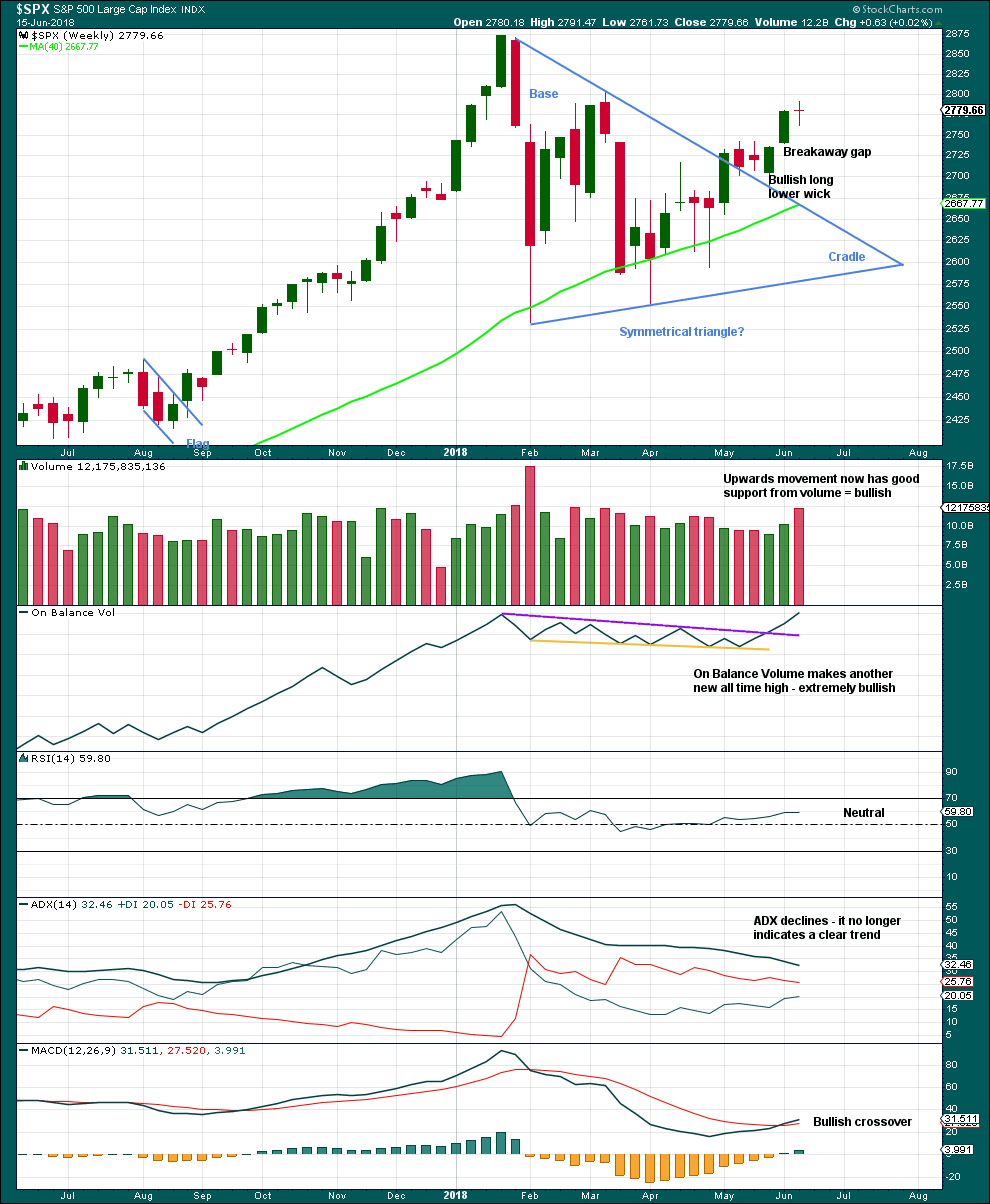
The small doji candlestick on its own is not a reversal signal. A doji signals a pause, a balance between bulls and bears.
Much weight in this analysis this week will be given to the new all time high for On Balance Volume. This is extremely bullish. It is likely that price shall follow through within a few weeks to new all time highs.
This chart is very bullish.
DAILY CHART
Click chart to enlarge. Chart courtesy of StockCharts.com.
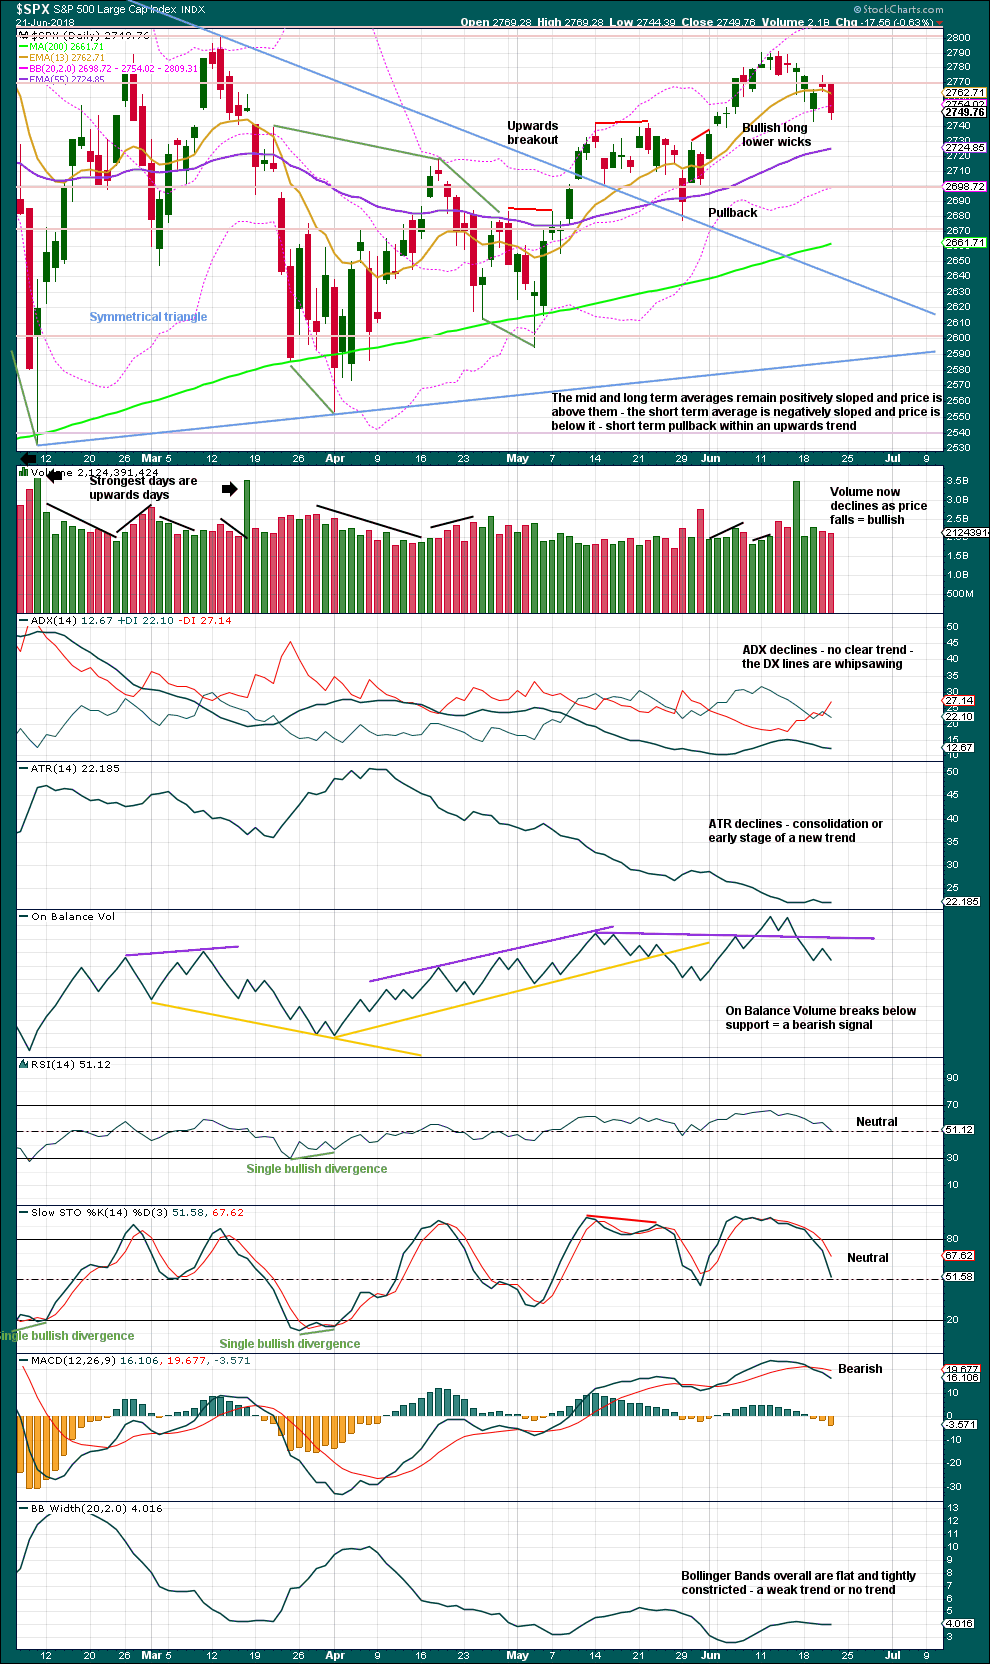
The symmetrical triangle may now be complete. The base distance is 340.18. Added to the breakout point of 2,704.54 this gives a target at 3,044.72. This is above the Elliott wave target at 2,922, so the Elliott wave target may be inadequate.
While today’s candlestick has a lower wick, it is not long enough to be reasonably bullish.
Overall, this chart is for the short term bearish to neutral.
Price has so far made a series of higher highs and higher lows, the definition of an upwards trend, since the low on the 2nd of April. A new low below the last swing low on the 29th of May at 2,676.81 would be required to indicate a trend change.
VOLATILITY – INVERTED VIX CHART
Click chart to enlarge. Chart courtesy of StockCharts.com. So that colour blind members are included, bearish signals
will be noted with blue and bullish signals with yellow.
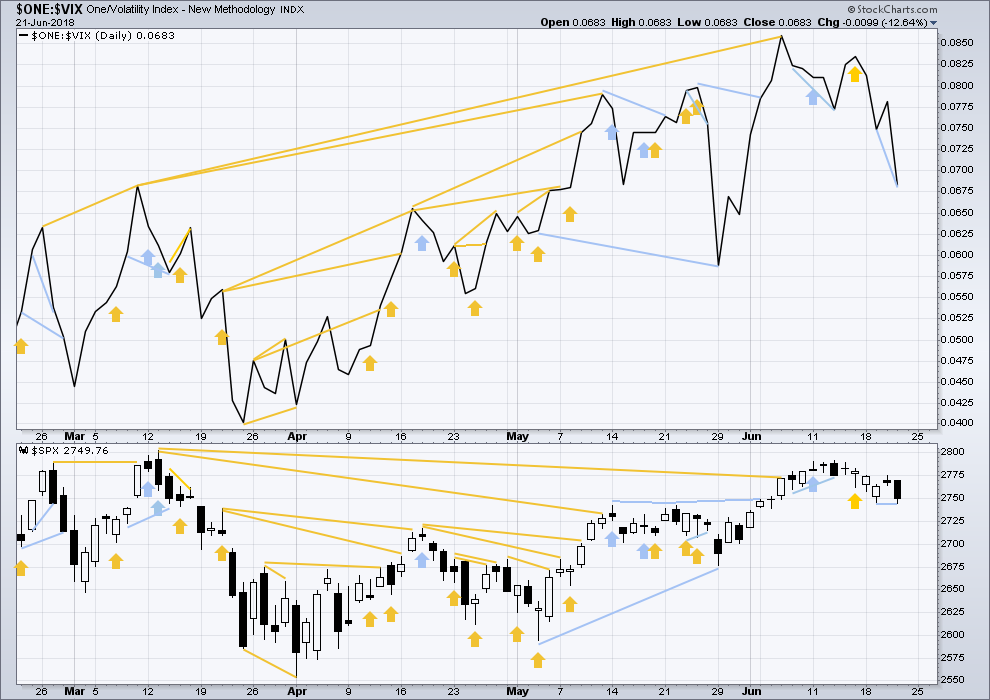
Normally, volatility should decline as price moves higher and increase as price moves lower. This means that normally inverted VIX should move in the same direction as price.
Inverted VIX has made a new high above the prior swing high of the 9th of March, but price has not made a corresponding new swing high about the same point yet. This divergence is bullish. Inverted VIX is still a little way off making a new all time high.
Inverted VIX has made a new low today below the low two sessions prior (on the 19th of June), but price has not. This divergence is bearish and supports the main hourly Elliott wave count.
BREADTH – AD LINE
Click chart to enlarge. Chart courtesy of StockCharts.com.
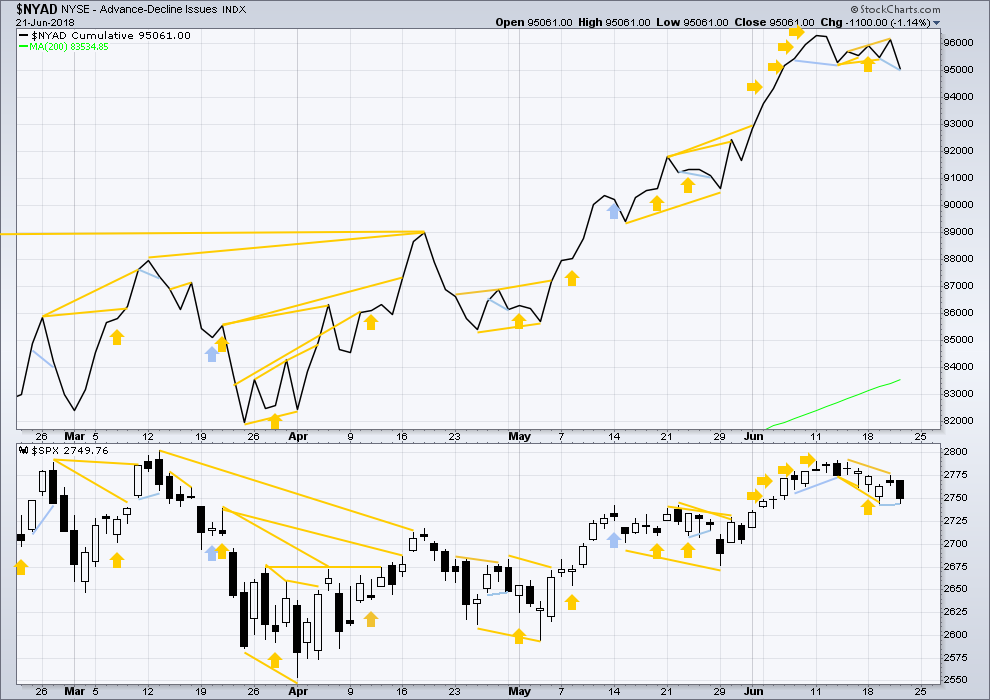
There is normally 4-6 months divergence between price and market breadth prior to a full fledged bear market. This has been so for all major bear markets within the last 90 odd years. With no longer term divergence yet at this point, any decline in price should be expected to be a pullback within an ongoing bull market and not necessarily the start of a bear market. New all time highs from the AD line means that any bear market may now be an absolute minimum of 4 months away. It may of course be a lot longer than that. My next expectation for the end of this bull market may now be October 2019.
Small caps and mid caps have both made new all time highs. It is large caps that usually lag in the latter stages of a bull market, so this perfectly fits the Elliott wave count. Expect large caps to follow to new all time highs.
Breadth should be read as a leading indicator.
Bullish divergence noted in last analysis has not been followed by any upwards movement. It may be considered to have failed.
The AD line made a new low today below the low two sessions prior (on the 19th of June), but price has not. This divergence is bearish and supports the main hourly Elliott wave count.
Overall, the AD line still remains mostly bullish as it has made more than one new all time high last week. Price may reasonably be expected to follow through in coming weeks.
DOW THEORY
The following lows need to be exceeded for Dow Theory to confirm the end of the bull market and a change to a bear market:
DJIA: 23,360.29.
DJT: 9,806.79.
S&P500: 2,532.69.
Nasdaq: 6,630.67.
Only Nasdaq at this stage is making new all time highs. DJIA and DJT need to make new all time highs for the ongoing bull market to be confirmed.
Charts showing each prior major swing low used for Dow Theory may be seen at the end of this analysis here.
Published @ 08:34 p.m. EST.
I think that while price remains above 2,742.24 this is looking like a better wave count.
Unless upwards movement to new highs shows an increase in momentum, this may be my new main hourly wave count going into next week. It fits much better with MACD.
Sorry Chris. May have to do a swap over on you.
Would this not also be a more bullish longer term count since Minor 1 is yet to complete?
PS – I have noticed when I edit a post with a chart attached, it goes to “Your comment is awaiting moderation.” This has happened to my comment in answer to Peter S’s question below.
yeah, that happens to me too. but luckily I can jump in the back end and fix it.
if that happens, just post it again.
and yes, a more bullish mid term count it is because minor 3 is still ahead of us.
Breaking through the down trend line would be Significant in my view.
Yesterday’s late in the day low produced a positive divergence on the MACD hourly chart relative to the hourly low on the 19th of June. I did not notice this until this morning.
please elaborate….
Yesterday the MACD low on the hourly chart was above the MACD low of June 19th. It is a sort of a confirmation of the higher low (in price) by MACD which had a higher low as well.
But when I look at again, it was not a positive divergence after all. If the low in price yesterday was lower than the low in price on the 19th and yet the MACD remained higher, that would be a positive divergence. The chart below shows such a divergence with the green arrows. If you have any more questions Peter S, let me know. I am happy to try to answer.
cmcsa has switch to a bullish mode at the weekly timeframe level. From 44 down to 30.5, and now at 33.7 and heading up.
When restaurants and retail outlets are leading the market, you know something is “not right” (and obviously that’s the case).
And when something like yoga pants company goes exponential…I short. Just put on a bear put spread on LULU. At the VERY LEAST, it’s coming back to the 13 week ema (brown line). And probably deeper.
Kevin,
Do you really have yoga shorts? Be careful not to expose yourself too much!
Ka-SPLASH!!!
Thank you, Lara. This main wave count just looks so right… like the very best way to explain price action of the last several sessions. As always, we’ll see how it plays out, won’t we?
Your analysis of the supplemental graphs (ADX, ATR, BB, 1/VIX, STO, AD) are right on the money but they are all direct functions of share price and it “whipsaws” as you put it with event risk.
Not to get political but geopolitics, i.e. Trump’s tariff tit for tat is throwing everything off.
What do you think Lara?
Must be the World Cup… 🙂
Ha ha ha ha
Cesar loves soccer (we don’t call it football down here) and he’s avidly watching the games.
I just can’t get on board. A game that goes on for hours… and only 1-4 goals scored? I just don’t see the point in that.
But then when the surfing is on we both agree that’s much better to watch.