
Last analysis expected that a pullback was complete and upwards movement should resume. This is exactly what has happened so far.
Summary: If the Elliott wave count is correct, then upwards movement may begin to build momentum from here.
The short term target is at 2,915. A sideways consolidation to last about a week is expected about this target.
The mid to longer term target is at 2,922 (Elliott wave) or 3,045 (classic analysis). Another multi week to multi month correction is expected at one of these targets.
The final target for this bull market to end remains at 3,616.
Pullbacks are an opportunity to join the trend.
Always practice good risk management. Always trade with stops and invest only 1-5% of equity on any one trade.
New updates to this analysis are in bold.
The biggest picture, Grand Super Cycle analysis, is here.
Last historic analysis with monthly charts is here, video is here.
ELLIOTT WAVE COUNT
WEEKLY CHART
Click chart to enlarge.
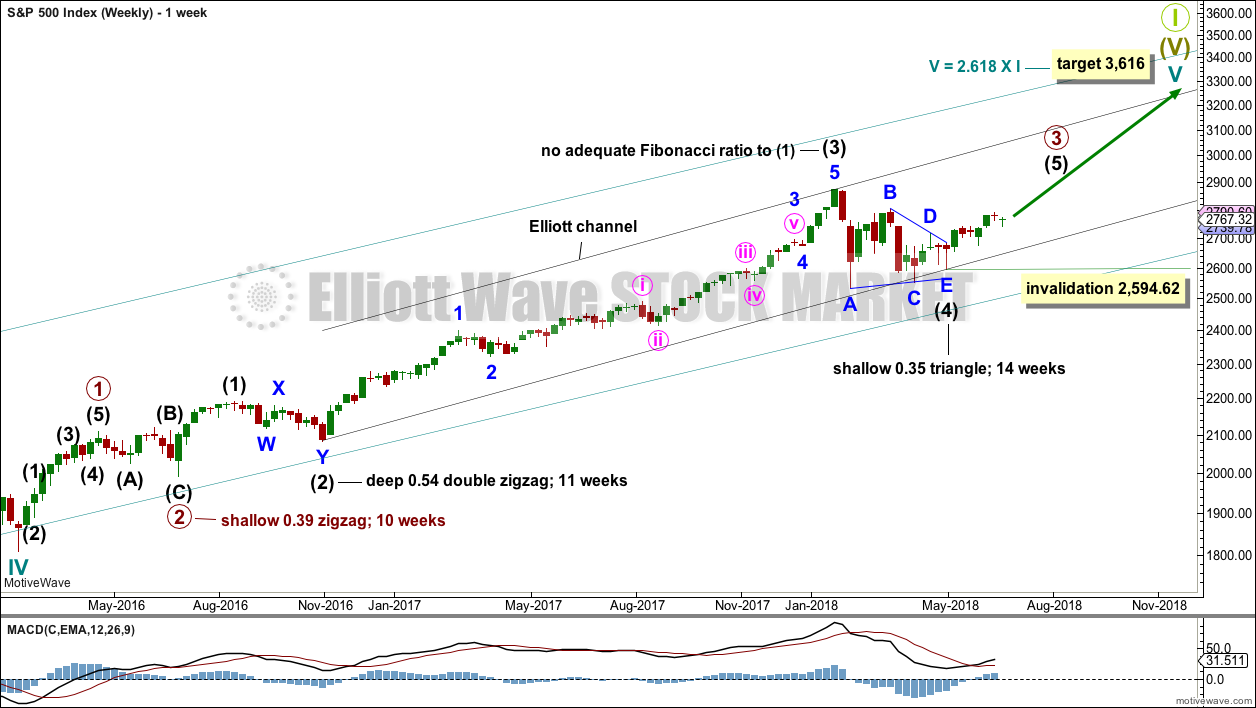
Cycle wave V must complete as a five structure, which should look clear at the weekly chart level and also now at the monthly chart level. It may only be an impulse or ending diagonal. At this stage, it is clear it is an impulse.
Within cycle wave V, the third waves at all degrees may only subdivide as impulses.
Intermediate wave (4) has breached an Elliott channel drawn using Elliott’s first technique. The channel is redrawn using Elliott’s second technique: the first trend line from the ends of intermediate waves (2) to (4), then a parallel copy on the end of intermediate wave (3). Intermediate wave (5) may end either midway within the channel, or about the upper edge.
Intermediate wave (4) may now be a complete regular contracting triangle lasting fourteen weeks, one longer than a Fibonacci thirteen. There is perfect alternation and excellent proportion between intermediate waves (2) and (4).
Within intermediate wave (5), no second wave correction may move beyond the start of its first wave below 2,594.62.
DAILY CHART
Click chart to enlarge.
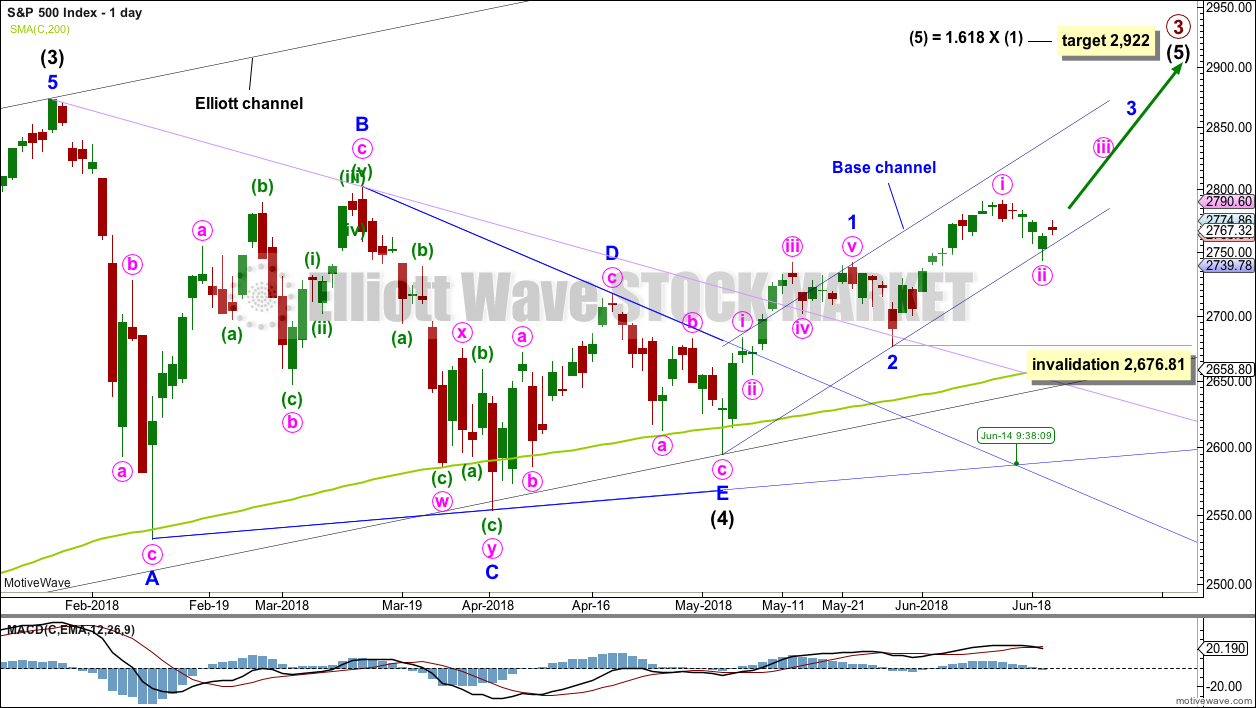
It is possible that intermediate wave (4) is a complete regular contracting triangle, the most common type of triangle. Minor wave E may have found support just below the 200 day moving average and ending reasonably short of the A-C trend line. This is the most common look for E waves of triangles.
Intermediate wave (3) exhibits no Fibonacci ratio to intermediate wave (1). It is more likely then that intermediate wave (5) may exhibit a Fibonacci ratio to either of intermediate waves (1) or (3). The most common Fibonacci ratio would be equality in length with intermediate wave (1), but in this instance that would expect a truncation. The next common Fibonacci ratio is used to calculate a target for intermediate wave (5) to end.
Price has clearly broken out above the upper triangle B-D trend line. This indicates that it should now be over if the triangle is correctly labelled.
A trend line in lilac is added to this chart. It is the same line as the upper edge of the symmetrical triangle on the daily technical analysis chart. Price found support about this line.
Minor wave 3 may only subdivide as an impulse, and within it the subdivisions of minute waves ii and iv may show up as one or more red daily candlesticks or doji.
Within minor wave 3, no second wave correction may move beyond the start of its first wave below 2,676.81. Along the way up, any deeper corrections may now find support at the lower edge of the base channel drawn about minor waves 1 and 2. Minor wave 3 may have the power to break above the upper edge of the base channel. If it does, then that upper edge may then provide support.
The last low found support just below the lower edge of the base channel on this daily chart, which is drawn on a semi-log scale. The hourly chart below is on an arithmetic scale and that perfectly shows where the low was found.
HOURLY CHART
Click chart to enlarge.
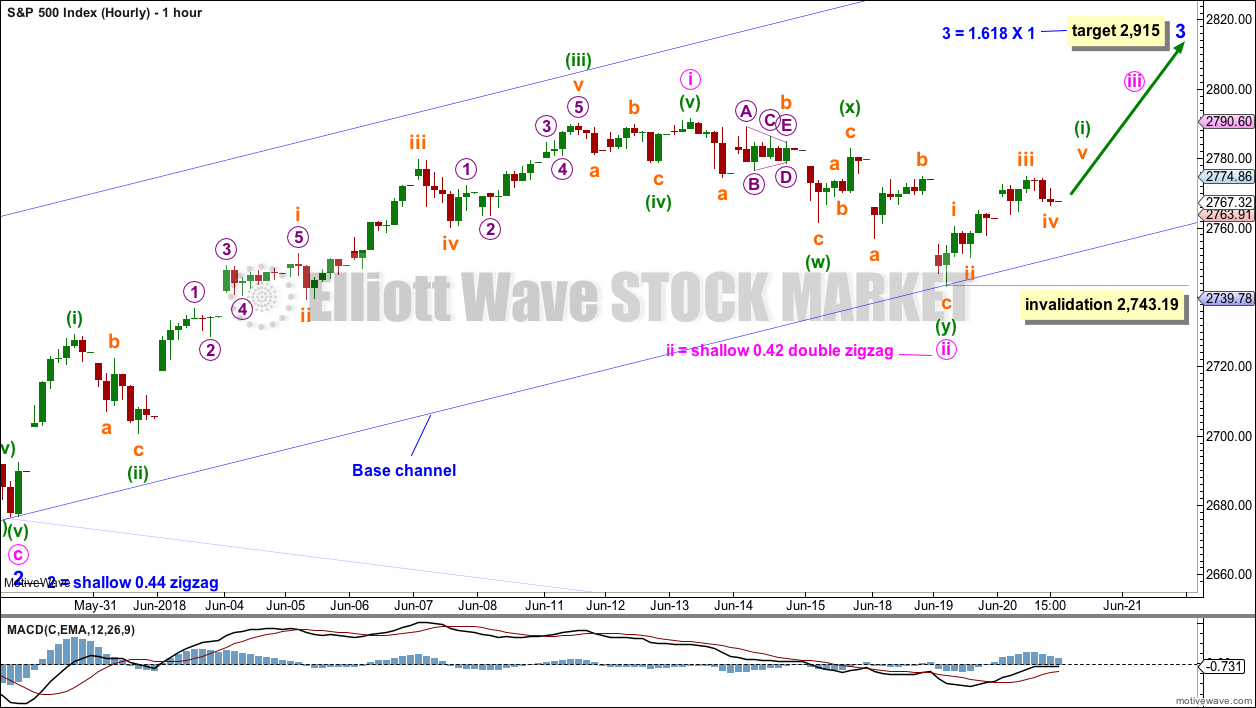
Minor wave 3 may only subdivide as an impulse, and within it all third waves at all degrees may only subdivide as impulses.
The last high may have been only minute wave i within minor wave 3. The last pullback may be minute wave ii.
Minute wave ii now fits as a completed double zigzag. With the low finding support almost perfectly at the lower edge of the base channel, if this wave count is correct and if the base channel works as they most often do, then the low may now be in for minute wave ii.
This wave count now expects an increase in upwards momentum as a third wave at two degrees unfolds.
Upwards movement today has closed the last open gap, but not the first. A new high above 2,779.66 would close the gap of the 18th of June and would so provide further confidence in this wave count.
Within minute wave iii, the upcoming correction for minuette wave (ii) may not move beyond the start of minuette wave (i) below 2,743.19.
Minuette wave (ii) may find support at the lower edge of the base channel as drawn here on an arithmetic scale.
TECHNICAL ANALYSIS
WEEKLY CHART
Click chart to enlarge. Chart courtesy of StockCharts.com.
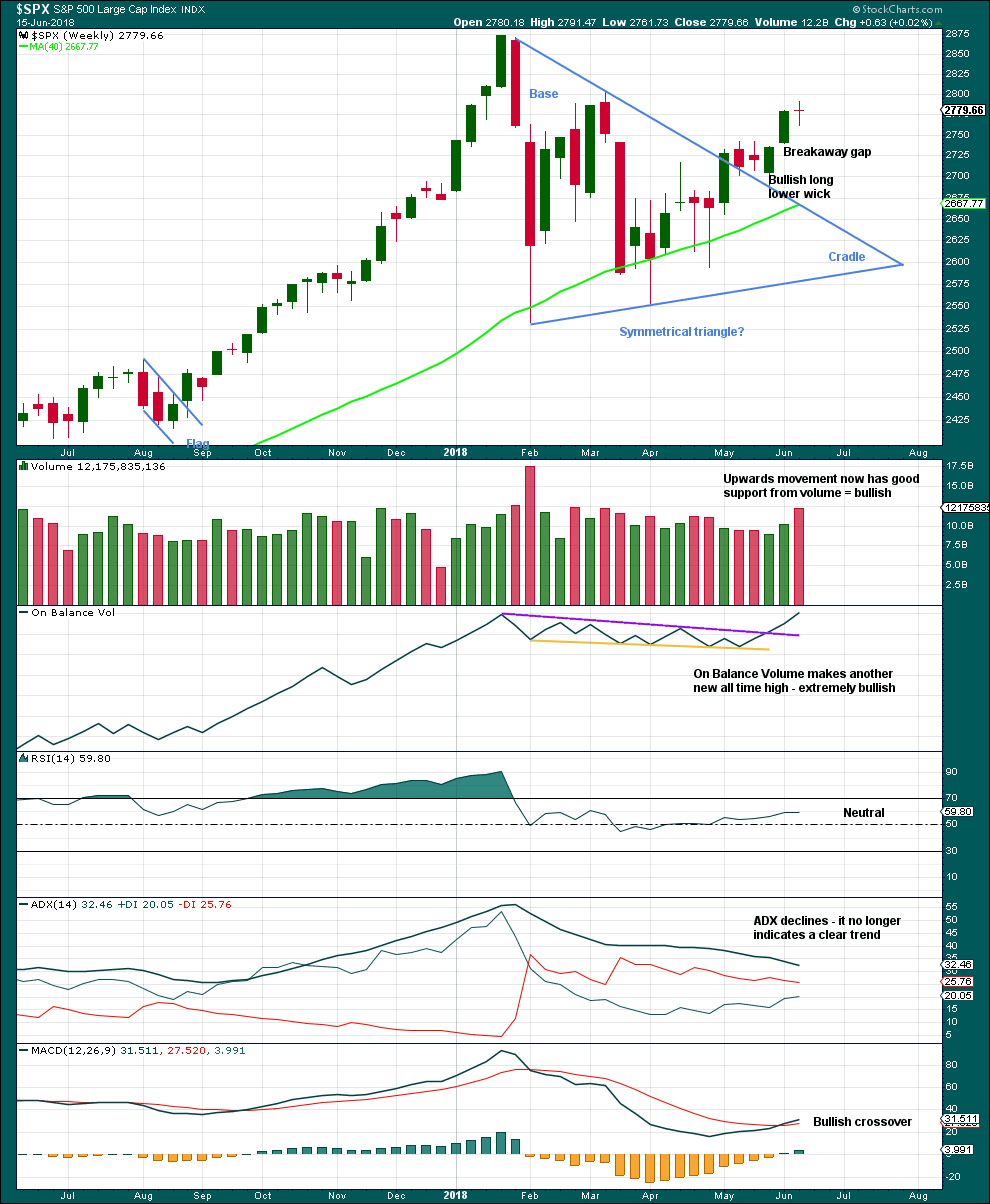
The small doji candlestick on its own is not a reversal signal. A doji signals a pause, a balance between bulls and bears.
Much weight in this analysis this week will be given to the new all time high for On Balance Volume. This is extremely bullish. It is likely that price shall follow through within a few weeks to new all time highs.
This chart is very bullish.
DAILY CHART
Click chart to enlarge. Chart courtesy of StockCharts.com.
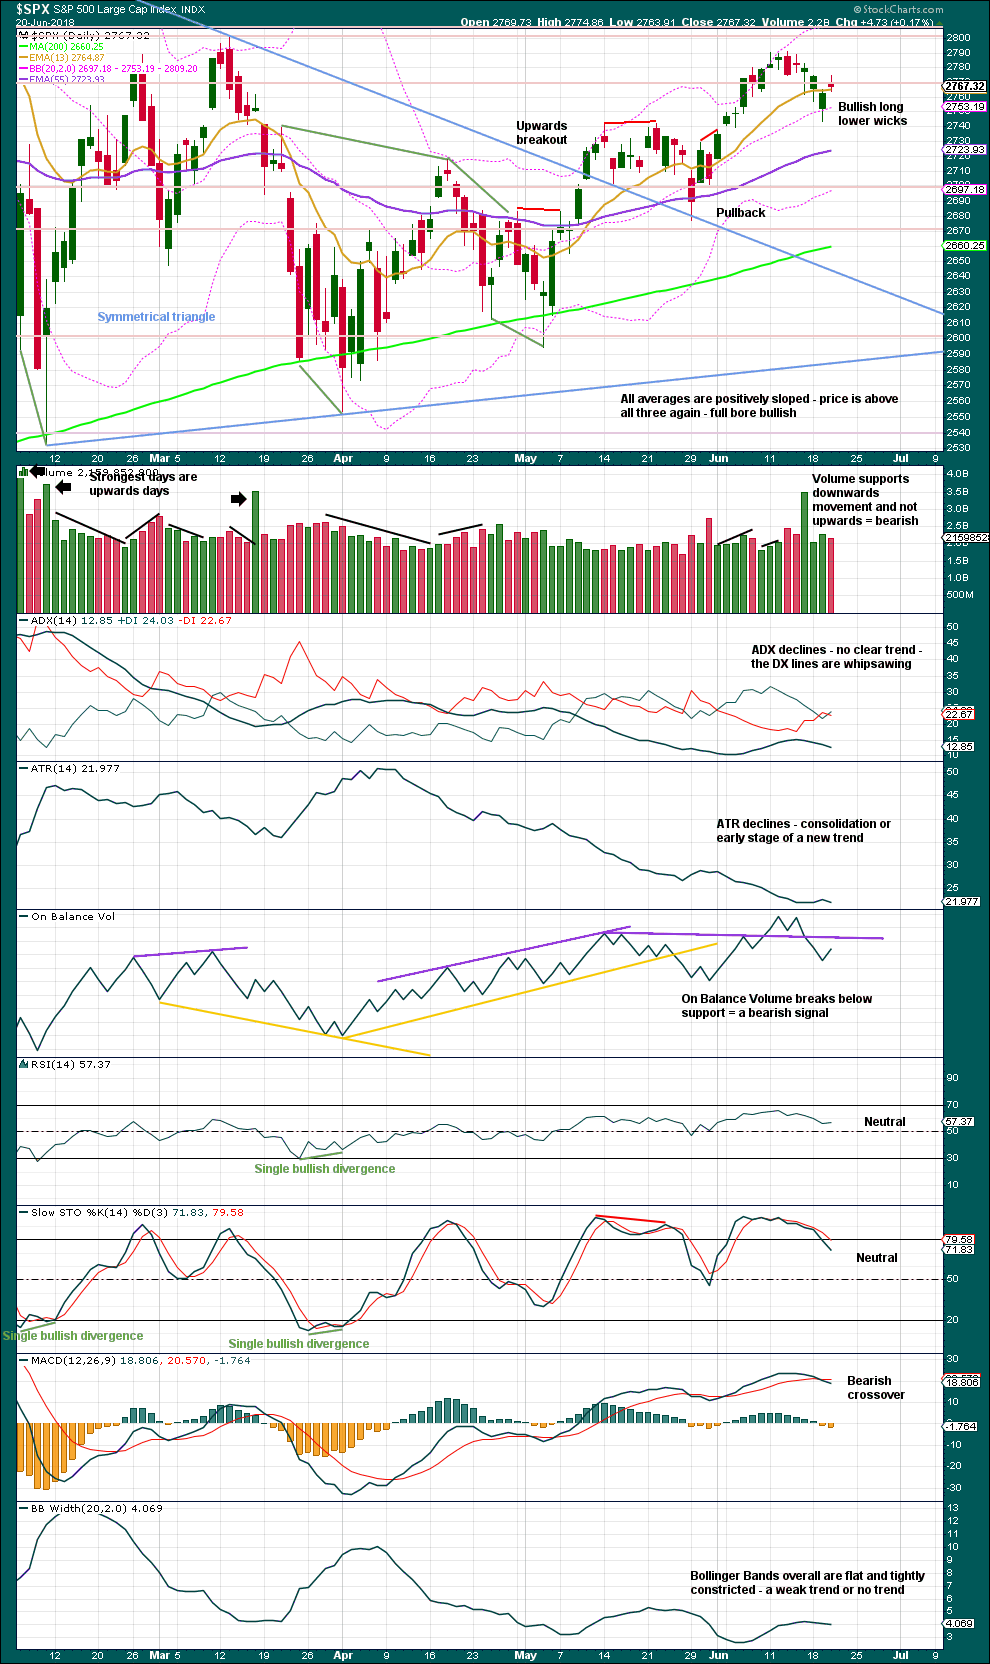
The symmetrical triangle may now be complete. The base distance is 340.18. Added to the breakout point of 2,704.54 this gives a target at 3,044.72. This is above the Elliott wave target at 2,922, so the Elliott wave target may be inadequate.
Price moved higher and the balance of volume was upwards today. Slightly lighter volume than yesterday indicates less support today for upwards movement; this is slightly bearish. However, a bearish short term volume profile will not be given much if any weight in this analysis. Rising price on light and declining volume has been a feature of the prior bull run for many weeks. It may again become a feature of the market during a bull run for intermediate wave (5).
Price has been making a series of higher highs and higher lows, the definition of an upwards trend, since the low of the 2nd of April. The new all time high at the daily chart level last week for On Balance Volume still strongly suggests price may follow through with new all time highs.
VOLATILITY – INVERTED VIX CHART
Click chart to enlarge. Chart courtesy of StockCharts.com. So that colour blind members are included, bearish signals
will be noted with blue and bullish signals with yellow.
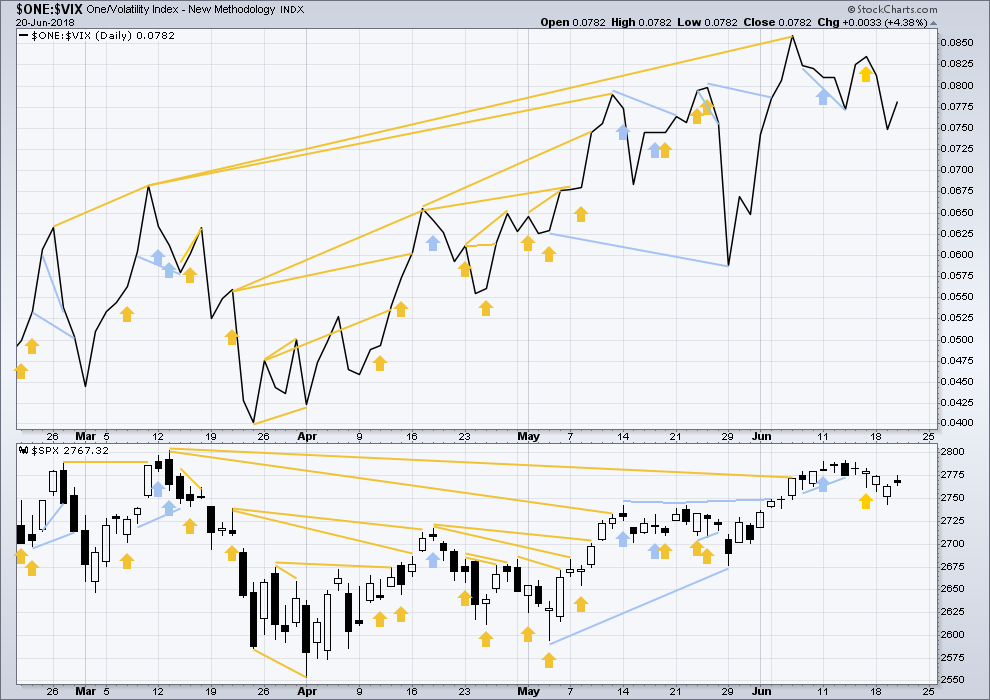
Normally, volatility should decline as price moves higher and increase as price moves lower. This means that normally inverted VIX should move in the same direction as price.
Inverted VIX has made a new high above the prior swing high of the 9th of March, but price has not made a corresponding new swing high about the same point yet. This divergence is bullish. Inverted VIX is still a little way off making a new all time high.
Both price and inverted VIX moved higher today. The rise in price has a normal corresponding decline in market volatility. There is no new divergence.
BREADTH – AD LINE
Click chart to enlarge. Chart courtesy of StockCharts.com.
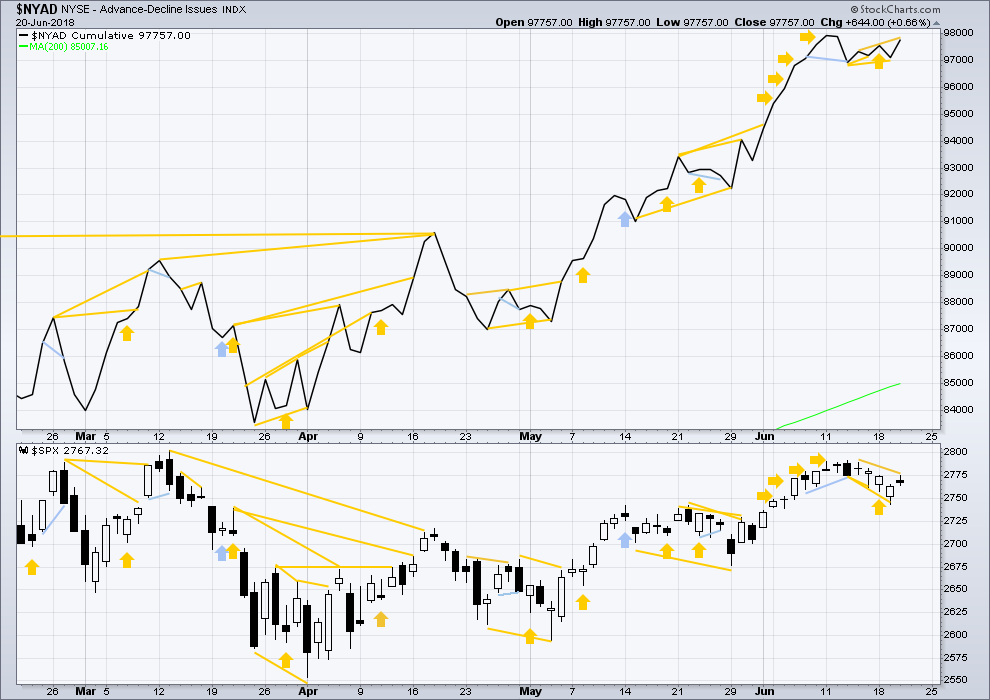
There is normally 4-6 months divergence between price and market breadth prior to a full fledged bear market. This has been so for all major bear markets within the last 90 odd years. With no longer term divergence yet at this point, any decline in price should be expected to be a pullback within an ongoing bull market and not necessarily the start of a bear market. New all time highs from the AD line means that any bear market may now be an absolute minimum of 4 months away. It may of course be a lot longer than that. My next expectation for the end of this bull market may now be October 2019.
Small caps and mid caps have both made new all time highs. It is large caps that usually lag in the latter stages of a bull market, so this perfectly fits the Elliott wave count. Expect large caps to follow to new all time highs.
Breadth should be read as a leading indicator.
Price moved higher today with support from rising market breadth. The AD line has made a new small swing high above the prior high of the 14th of June, but price has not. This divergence is bullish and supports the Elliott wave count.
Overall, the AD line still remains mostly bullish as it has made more than one new all time high last week. Price may reasonably be expected to follow through in coming weeks.
DOW THEORY
The following lows need to be exceeded for Dow Theory to confirm the end of the bull market and a change to a bear market:
DJIA: 23,360.29.
DJT: 9,806.79.
S&P500: 2,532.69.
Nasdaq: 6,630.67.
Only Nasdaq at this stage is making new all time highs. DJIA and DJT need to make new all time highs for the ongoing bull market to be confirmed.
Charts showing each prior major swing low used for Dow Theory may be seen at the end of this analysis here.
Published @ 09:30 p.m. EST.
this is not what I expected today, I expected that base channel to provide support and it’s not working
and again, that there is the problem with all technical analysis. many things work most of the time, but not all the time. which is why risk management is so important.
at this stage the only structure I can see for minute ii now is a rare triple zigzag.
40 million UVXY shares traded today.
The failure of this particular instrument to match the performance of its “mirror image” SVXY during the vol blow-up in Feb remains a mystery. I suspect we have yet to hear the rest of the story.
I exited short puts on surrender of S/R pivots today.
I believe I suggested the low from a few days back was “lost in space” and not particularly stable. Well…we’ll see about it. My best current take is that the market will head down to the 62% retrace at 2721. A proper retrace and turning point for a significant ii down, not “lost in space” between a 38% and 50% fibo. The market REALLY LIKES fractal structure (one might even say it’s required). Or perhaps things hold here and this is a smaller ii…but I don’t think so.
S/R shelves at DJI 25.5K and SPX 2750 important. They need to hold for immediate bullish case. VIX could be hinting at a downside break with flagging action…
DJI 24.5K that is…
Are we Buying or Selling at 2,750?
I am selling some SPY straddles (spreads for safety / margin) around 275.5 expiring Monday. Bullish Spread anticipating a ST low is nearand taking advantage of the vol pop.
Laura today is like 8 days in a row for the dow down about 950 points. and it looks like a 5. when 76.4% breaks down. How does the dow fit into this bullish plan? thanks
The DJIA and the S&P500 are two separate markets and will have two separate wave counts.
Since 2nd April the DJIA has still made a series of higher highs and higher lows overall, looking at it on the daily chart.
Until both DJIA and DJT make new all time highs though then we shall not have the ongoing bull market confirmed.
Covering VIX 13 strikes short puts today. Still holding 11.00 strike puts. Will re-deploy boat-load of short 13 strike puts on any move below 13. Standing pat on bull and bear spreads. Will exit short puts if we take out recent lows.
Tagged out of principal at 11am, letting profits run, 15 handle target
BTW Verne, my systems just gave a weekly buy signal on VIX. Last time was Jan 16th……..
Inteteresting. I sold some UVXY calls this morning and looking to reload. We may have some flagging price action underway. Nibbling on IWM puts. Pronounced momo divergences at recent highs.
So. Many. Whipsaws.
Here’s to it whipping back up!
Yep!
So iv just crossed i. Was (i) over as a diagonal?
Not a subminuette iv. It’s a minuette ii down. IMO…but I think it’s the only count that fits the bull scenario here. If it goes below 2743…uh oh. Higher order count becomes foobar’ed.
LUV is both set up long and is triggering for a swing trade.
It’s looking an awful lot like the minuette (green) i up is complete and price is now in a minuette ii down. It’s tagged the 38% retrace at 2762.8, and that’s holding for the moment. But it could go deeper, to the .62 (2755.3) or .78 (2750) of the length of minuette i. Don’t be surprised.
Thx Lara! Let the ride begin!
Kevin, have you looked at Russell or biotech lately? Relentless and pullbacks shallow?
Sadly, I have been idly watching RUT go off like a rocket while spending too much time worried about whether SPX will move a penny up or down. A problem I will attempt to rectify over time.
I failed to look at IBB today, yea it’s on fire isn’t it. Interesting. I am in BLUE and it blasted off again today as part of that I guess. Let’s hope it leads a parade. It might: it’s taking off in week 2 of a squeeze on the weekly. That would tend to indicate several (5+) weeks of generally upward movement ahead. We’ll see.
Sadly, it appears we get another ii wave back down before maybe even reaching 2800 again. Long slow process to get an intermediate 5 wave running with high momentum!
I went 100% long in my long term and mid term accounts some days ago. At that time I decided to allocated 50% of the positions to small & mid cap stock indices. The small & mid cap have vastly outperformed the S&P index. While I am happy with these returns, I naturally wish I put it all in small and mid cap equities. But, oftentimes the soldiers lead the charge and the generals catch up along the way. Perhaps we will see a rotation from small and mid caps to large caps later in this Intermediate 5 – Primary 3 wave.
Have a good day all. I have the pleasure of watching three and five year old granddaughters tearing up the place with their abundant energy and zest for life.