
A new alternate Elliott wave count for the short term picture expected another low to find support about 2,747. The low for the session was at 2,743, sitting almost perfectly on a trend line that was expected to provide final support.
Summary: The pullback now looks complete.
The AD line remains bullish. If the Elliott wave count is correct, then upwards movement may begin to build momentum from here.
The short term target is at 2,915. A sideways consolidation to last about a week is expected about this target.
The mid to longer term target is at 2,922 (Elliott wave) or 3,045 (classic analysis). Another multi week to multi month correction is expected at one of these targets.
The final target for this bull market to end remains at 3,616.
Pullbacks are an opportunity to join the trend.
Always practice good risk management. Always trade with stops and invest only 1-5% of equity on any one trade.
New updates to this analysis are in bold.
The biggest picture, Grand Super Cycle analysis, is here.
Last historic analysis with monthly charts is here, video is here.
ELLIOTT WAVE COUNT
WEEKLY CHART
Click chart to enlarge.
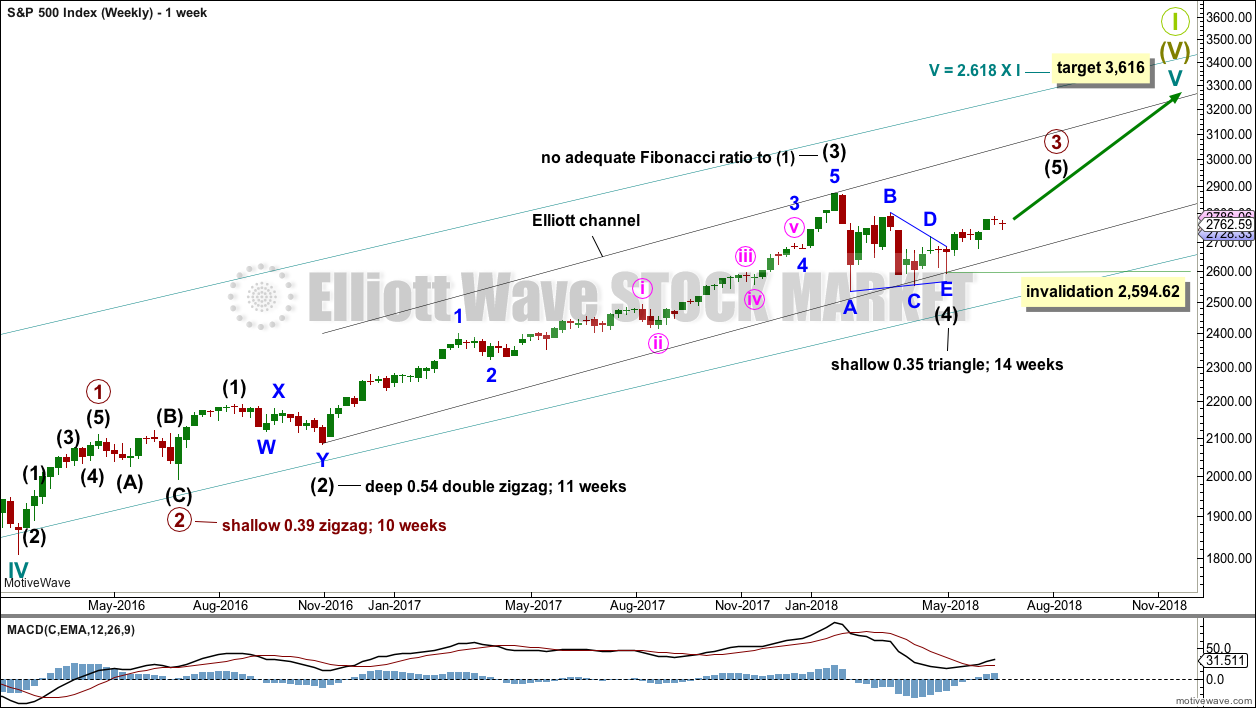
Cycle wave V must complete as a five structure, which should look clear at the weekly chart level and also now at the monthly chart level. It may only be an impulse or ending diagonal. At this stage, it is clear it is an impulse.
Within cycle wave V, the third waves at all degrees may only subdivide as impulses.
Intermediate wave (4) has breached an Elliott channel drawn using Elliott’s first technique. The channel is redrawn using Elliott’s second technique: the first trend line from the ends of intermediate waves (2) to (4), then a parallel copy on the end of intermediate wave (3). Intermediate wave (5) may end either midway within the channel, or about the upper edge.
Intermediate wave (4) may now be a complete regular contracting triangle lasting fourteen weeks, one longer than a Fibonacci thirteen. There is perfect alternation and excellent proportion between intermediate waves (2) and (4).
Within intermediate wave (5), no second wave correction may move beyond the start of its first wave below 2,594.62.
DAILY CHART
Click chart to enlarge.
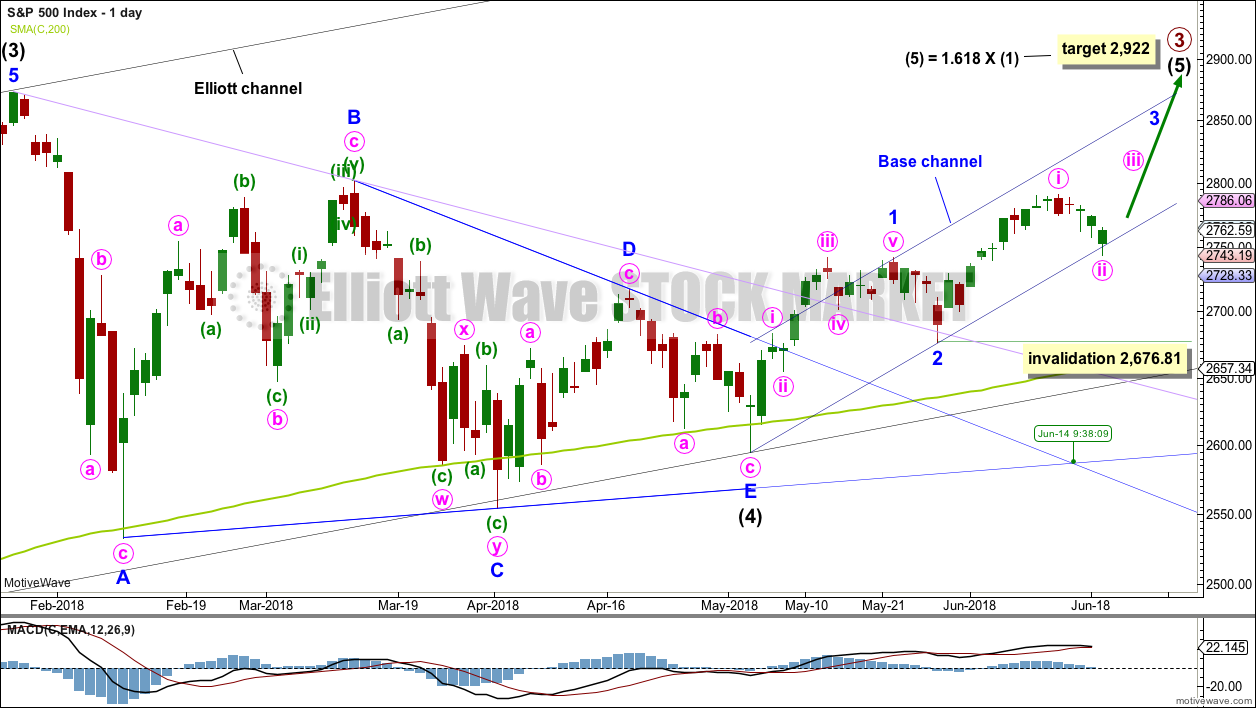
It is possible that intermediate wave (4) is a complete regular contracting triangle, the most common type of triangle. Minor wave E may have found support just below the 200 day moving average and ending reasonably short of the A-C trend line. This is the most common look for E waves of triangles.
Intermediate wave (3) exhibits no Fibonacci ratio to intermediate wave (1). It is more likely then that intermediate wave (5) may exhibit a Fibonacci ratio to either of intermediate waves (1) or (3). The most common Fibonacci ratio would be equality in length with intermediate wave (1), but in this instance that would expect a truncation. The next common Fibonacci ratio is used to calculate a target for intermediate wave (5) to end.
Price has clearly broken out above the upper triangle B-D trend line. This indicates that it should now be over if the triangle is correctly labelled.
A trend line in lilac is added to this chart. It is the same line as the upper edge of the symmetrical triangle on the daily technical analysis chart. Price found support about this line.
Minor wave 3 may only subdivide as an impulse, and within it the subdivisions of minute waves ii and iv may show up as one or more red daily candlesticks or doji.
Within minor wave 3, no second wave correction may move beyond the start of its first wave below 2,676.81. Along the way up, any deeper corrections may now find support at the lower edge of the base channel drawn about minor waves 1 and 2. Minor wave 3 may have the power to break above the upper edge of the base channel. If it does, then that upper edge may then provide support.
The low for today found support just below the lower edge of the base channel on this daily chart, which is drawn on a semi-log scale. The hourly chart below is on an arithmetic scale and that perfectly shows where the low was found today.
HOURLY CHART
Click chart to enlarge.
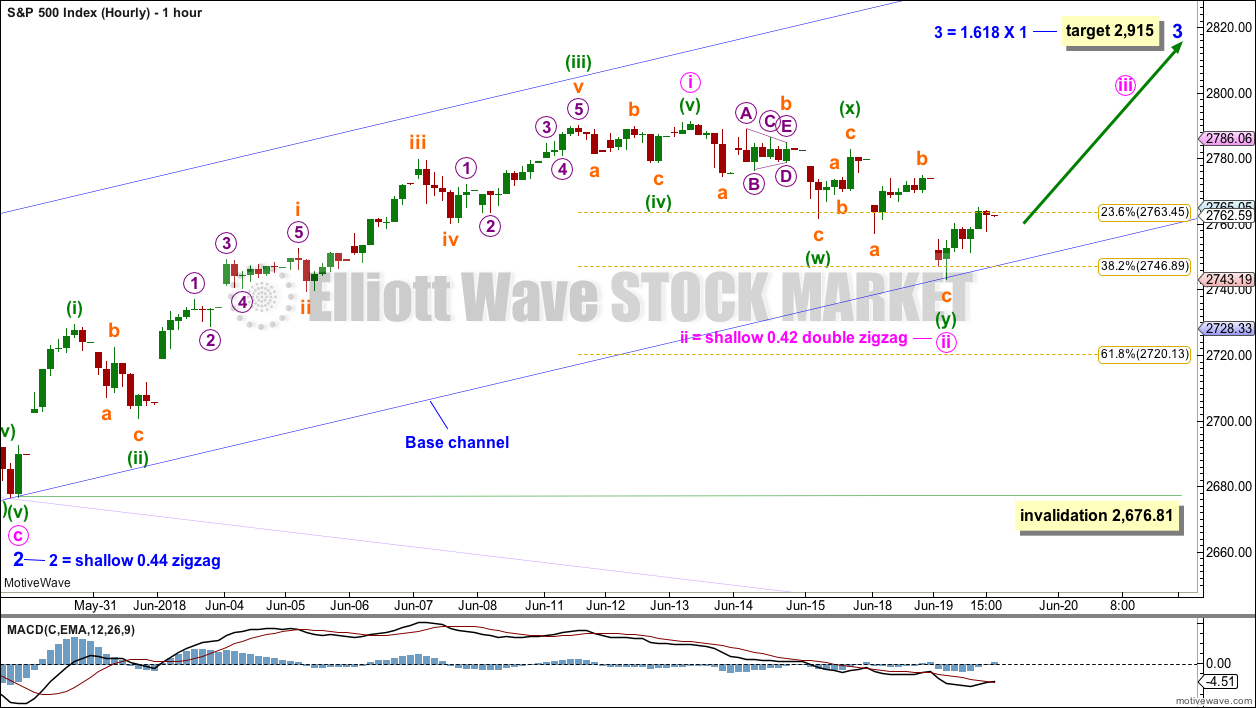
Minor wave 3 may only subdivide as an impulse, and within it all third waves at all degrees may only subdivide as impulses.
The last high may have been only minute wave i within minor wave 3. The current pullback may be minute wave ii.
Minute wave ii now fits as a completed double zigzag at today’s low. With the low for this session finding support almost perfectly at the lower edge of the base channel, if this wave count is correct and if the base channel works as they most often do, then the low may now be in for minute wave ii.
This wave count now expects an increase in upwards momentum as a third wave at two degrees unfolds.
At this stage, there remain two open gaps which may be breakaway or continuation gaps. While these gaps remain open there will remain a risk that this wave count is wrong and a new downwards trend may be in its early stages. The gaps would be closed with a new high above 2,779.66. At that stage, reasonable confidence that a low is in place would be had.
Minute wave ii may not move beyond the start of minute wave i below 2,676.81.
TECHNICAL ANALYSIS
WEEKLY CHART
Click chart to enlarge. Chart courtesy of StockCharts.com.
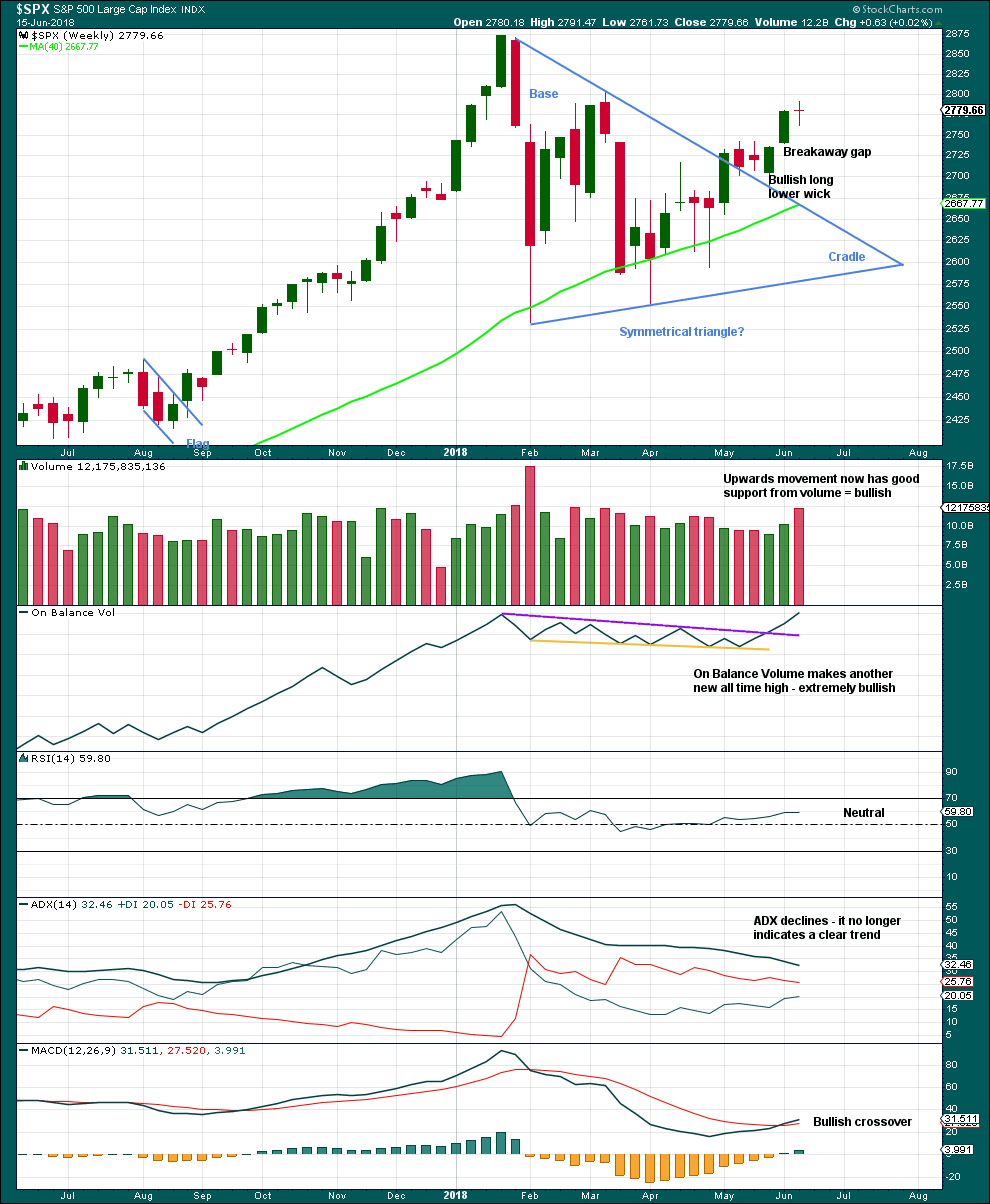
The small doji candlestick on its own is not a reversal signal. A doji signals a pause, a balance between bulls and bears.
Much weight in this analysis this week will be given to the new all time high for On Balance Volume. This is extremely bullish. It is likely that price shall follow through within a few weeks to new all time highs.
This chart is very bullish.
DAILY CHART
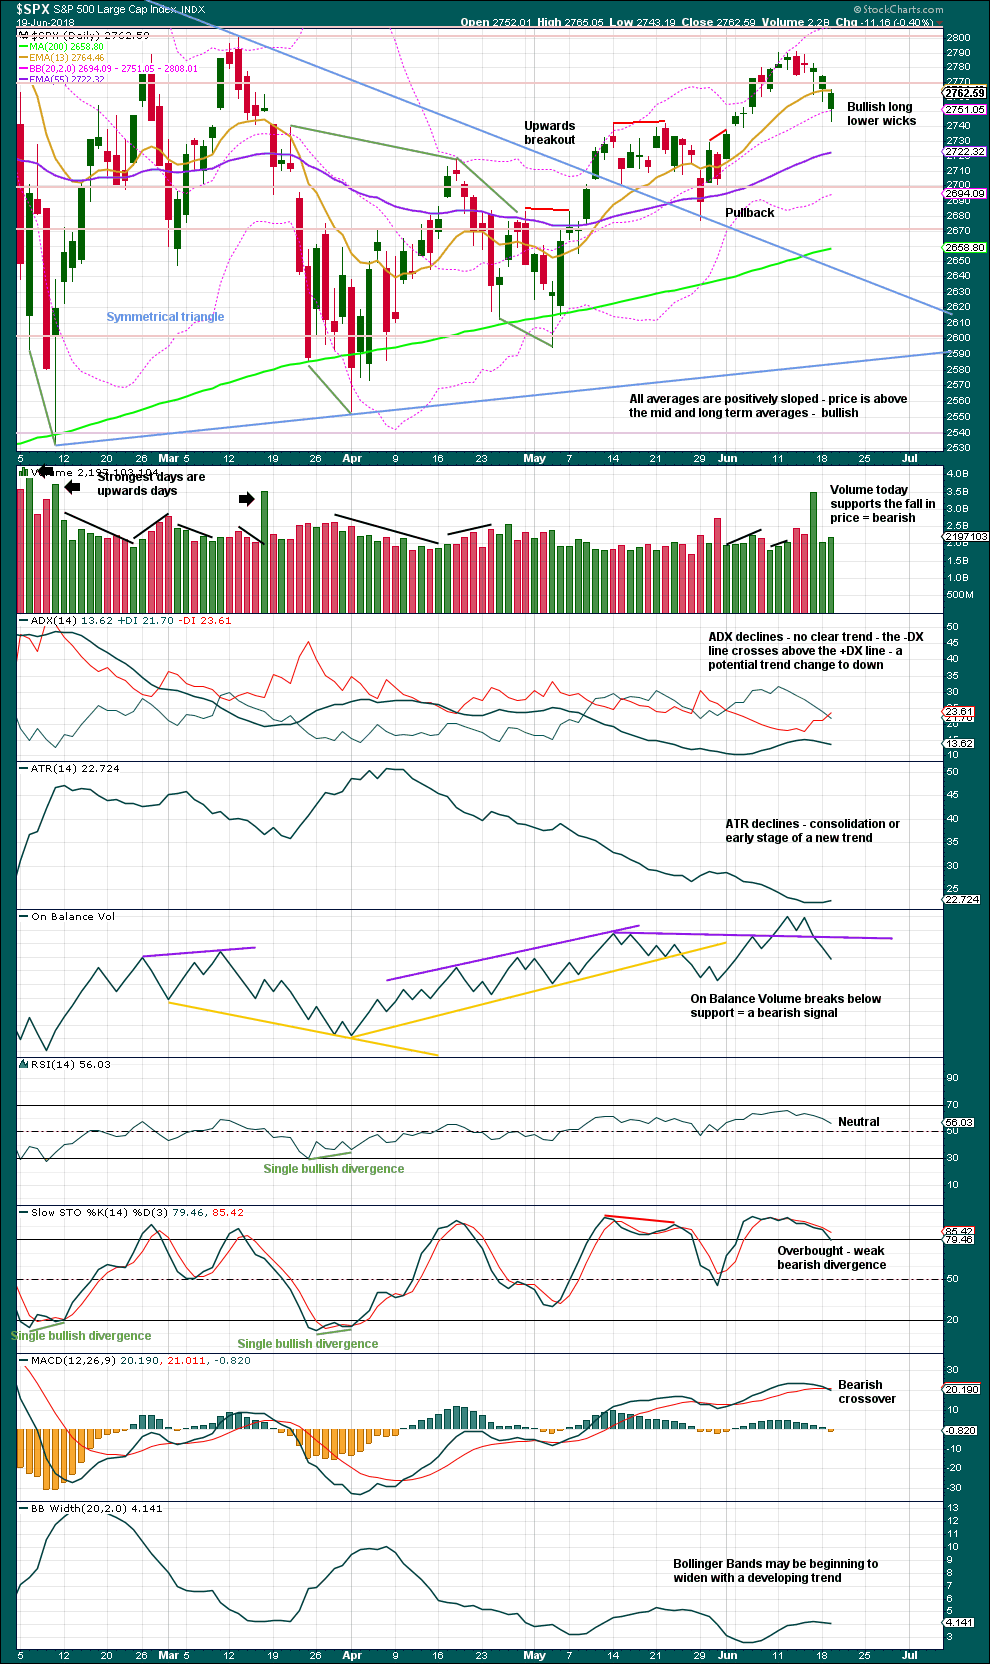
Click chart to enlarge. Chart courtesy of StockCharts.com.
The symmetrical triangle may now be complete. The base distance is 340.18. Added to the breakout point of 2,704.54 this gives a target at 3,044.72. This is above the Elliott wave target at 2,922, so the Elliott wave target may be inadequate.
There are now three long lower wicks on the last three daily candlesticks, which are all green. This is reasonably bullish.
While the last signal from On Balance Volume is bearish, this makes no comment on how far or for how long price may move lower after the signal. There is no bearish divergence between price and On Balance Volume.
VOLATILITY – INVERTED VIX CHART
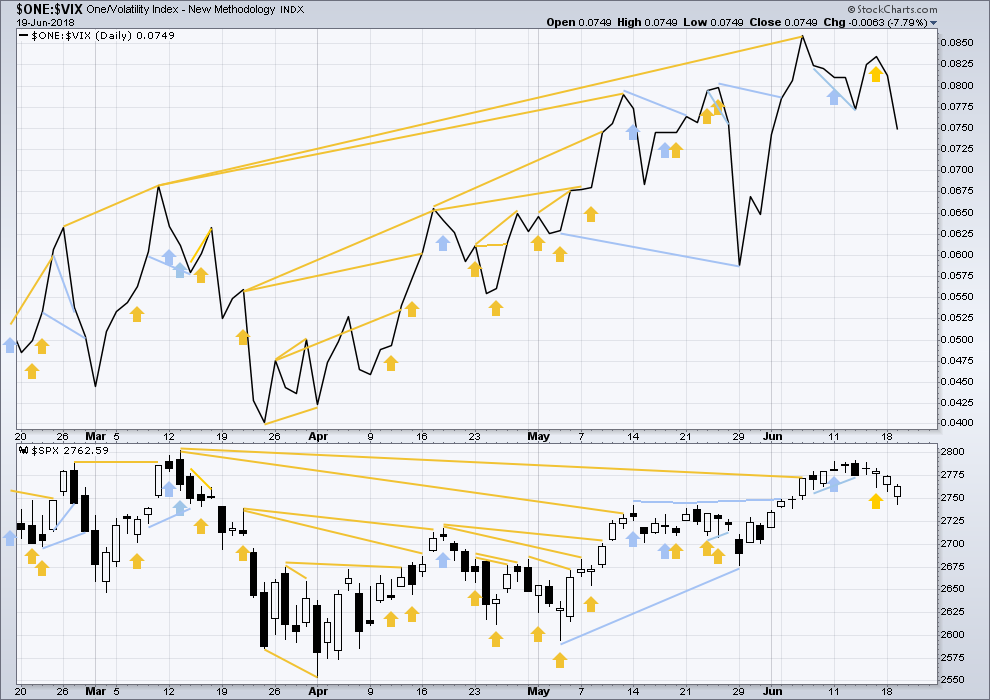
Click chart to enlarge. Chart courtesy of StockCharts.com. So that colour blind members are included, bearish signals
will be noted with blue and bullish signals with yellow.
Normally, volatility should decline as price moves higher and increase as price moves lower. This means that normally inverted VIX should move in the same direction as price.
Inverted VIX has made a new high above the prior swing high of the 9th of March, but price has not made a corresponding new swing high about the same point yet. This divergence is bullish. Inverted VIX is still a little way off making a new all time high.
Both price and inverted VIX moved lower today. There is no new divergence.
BREADTH – AD LINE
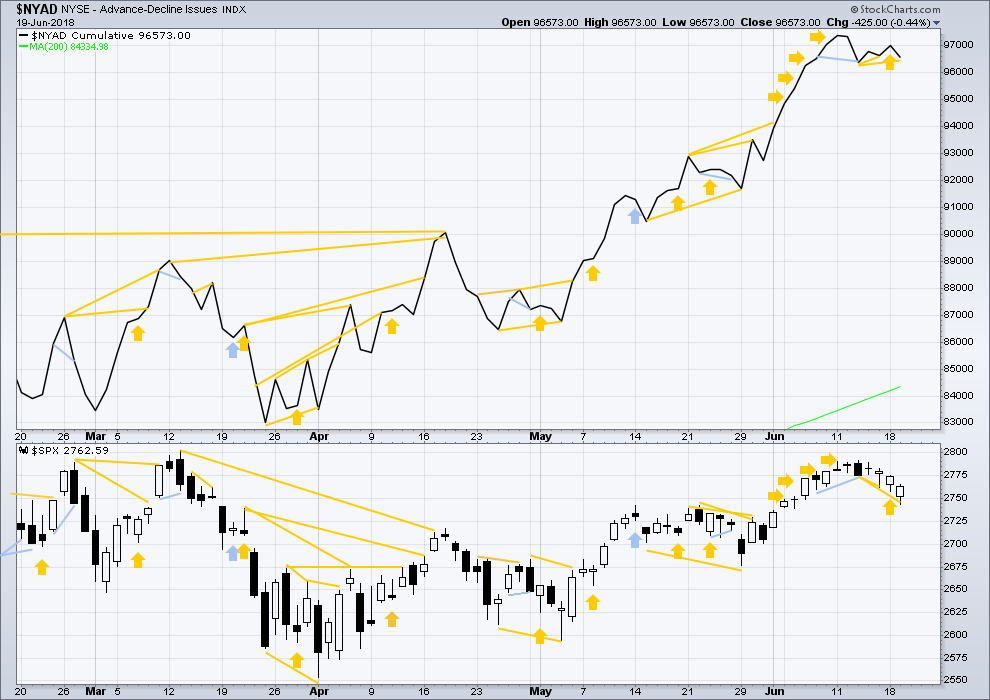
Click chart to enlarge. Chart courtesy of StockCharts.com.
There is normally 4-6 months divergence between price and market breadth prior to a full fledged bear market. This has been so for all major bear markets within the last 90 odd years. With no longer term divergence yet at this point, any decline in price should be expected to be a pullback within an ongoing bull market and not necessarily the start of a bear market. New all time highs from the AD line means that any bear market may now be an absolute minimum of 4 months away. It may of course be a lot longer than that. My next expectation for the end of this bull market may now be October 2019.
Small caps and mid caps have both made new all time highs. It is large caps that usually lag in the latter stages of a bull market, so this perfectly fits the Elliott wave count. Expect large caps to follow to new all time highs.
Breadth should be read as a leading indicator.
Price has made a new low below the prior low of the 13th of June, but the AD line has not made a corresponding new low. The fall in price does not have support from a corresponding fall in market breath since the 13th of June. This divergence is bullish and supports the hourly Elliott wave count.
Overall, the AD line still remains mostly bullish as it has made more than one new all time high last week. Price may reasonably be expected to follow through in coming weeks.
DOW THEORY
The following lows need to be exceeded for Dow Theory to confirm the end of the bull market and a change to a bear market:
DJIA: 23,360.29.
DJT: 9,806.79.
S&P500: 2,532.69.
Nasdaq: 6,630.67.
Only Nasdaq at this stage is making new all time highs. DJIA and DJT need to make new all time highs for the ongoing bull market to be confirmed.
Charts showing each prior major swing low used for Dow Theory may be seen at the end of this analysis here.
Published @ 08:13 p.m. EST.
My apologies again everybody for not being here earlier.
Not that you all really needed me today. Price is behaving very well indeed.
After checking on the five minute chart I can see another five up close to completion. I’m going to label it minuette (i) and I’m moving the short term invalidation point up.
1,2,1,2,1,2,1,2…?
Looks that way to me at the moment.
On my subminuette iii (chart in comments above) up for today’s movement, I can see that as a complete impulse.
On the five minute chart in there the second wave is an expanded flat, and the fourth wave looks like a zigzag. So no overlap in there between micro 1 and 4.
Nice one!
I think I’ve forgotten what an up trending day looks and feels like. Are we due yet???
AMTD has cracked it’s sharp downtrend line.
CMCSA has broken it’s significant downtrend line and inverted on the 1 hr.
Foist??!!
Wabbit season again!!
Bugs Bunny and Elmer Fudd all in one day. That may drive me to become the Mad Hatter! Have a great day watching the 3rd or a 3rd. We just may fill both open gaps today.
So far, this dog don’t hunt!!! Just slinkin’ back and forth sniffing the ground. That way, DOG!!! The wabbit’s up the hill!!! GO!!!
I’ll be back later for tea…