
Upwards movement was expected to begin the new week. Monday’s candlestick has closed green, but the strong gap downwards saw a lower low and a lower high, the definition of downwards movement.
Today the AD line gives another signal.
Summary: Price moved lower today, but the AD line moved higher. This is very bullish.
Expect upwards movement as very likely overall this week. The pullback may be complete at today’s low, or it may see one new low at the start of the next session.
The first short term target is now at 2,814. The second short term target is at 2,915. At one of these targets a sideways consolidation to last about a week is expected.
The mid to longer term target is at 2,922 (Elliott wave) or 3,045 (classic analysis). Another multi week to multi month correction is expected at one of these targets.
The final target for this bull market to end remains at 3,616.
The Elliott wave count has good support from classic technical analysis. New all time highs this week from On Balance Volume and the AD line add strong confidence to this analysis.
Pullbacks are an opportunity to join the trend.
Always practice good risk management. Always trade with stops and invest only 1-5% of equity on any one trade.
New updates to this analysis are in bold.
The biggest picture, Grand Super Cycle analysis, is here.
Last historic analysis with monthly charts is here, video is here.
ELLIOTT WAVE COUNT
WEEKLY CHART
Click chart to enlarge.
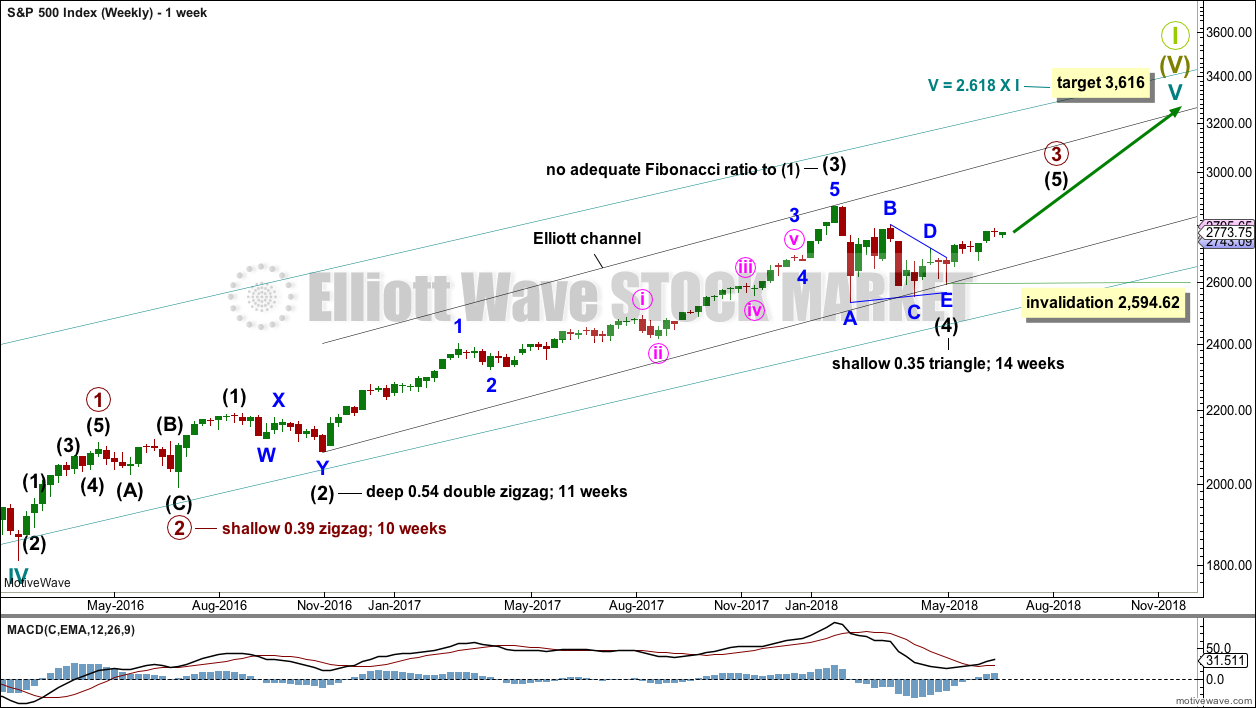
Cycle wave V must complete as a five structure, which should look clear at the weekly chart level and also now at the monthly chart level. It may only be an impulse or ending diagonal. At this stage, it is clear it is an impulse.
Within cycle wave V, the third waves at all degrees may only subdivide as impulses.
Intermediate wave (4) has breached an Elliott channel drawn using Elliott’s first technique. The channel is redrawn using Elliott’s second technique: the first trend line from the ends of intermediate waves (2) to (4), then a parallel copy on the end of intermediate wave (3). Intermediate wave (5) may end either midway within the channel, or about the upper edge.
Intermediate wave (4) may now be a complete regular contracting triangle lasting fourteen weeks, one longer than a Fibonacci thirteen. There is perfect alternation and excellent proportion between intermediate waves (2) and (4).
Within intermediate wave (5), no second wave correction may move beyond the start of its first wave below 2,594.62.
DAILY CHART
Click chart to enlarge.
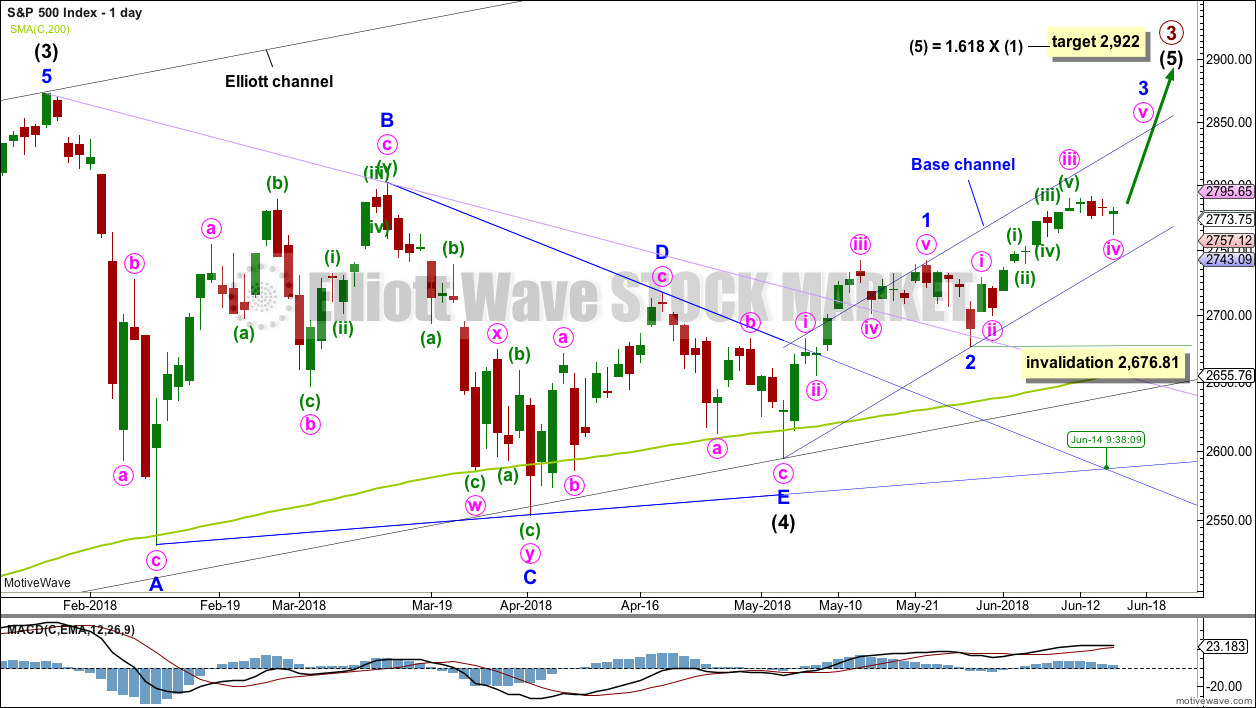
It is possible that intermediate wave (4) is a complete regular contracting triangle, the most common type of triangle. Minor wave E may have found support just below the 200 day moving average and ending reasonably short of the A-C trend line. This is the most common look for E waves of triangles.
Intermediate wave (3) exhibits no Fibonacci ratio to intermediate wave (1). It is more likely then that intermediate wave (5) may exhibit a Fibonacci ratio to either of intermediate waves (1) or (3). The most common Fibonacci ratio would be equality in length with intermediate wave (1), but in this instance that would expect a truncation. The next common Fibonacci ratio is used to calculate a target for intermediate wave (5) to end.
Price has clearly broken out above the upper triangle B-D trend line. This indicates that it should now be over if the triangle is correctly labelled.
A trend line in lilac is added to this chart. It is the same line as the upper edge of the symmetrical triangle on the daily technical analysis chart. Price has found support about this line at the last two small swing lows. The suppport at this line has reasonable technical significance now that it has been tested twice, and this line should be assumed to continue to provide support until proven otherwise.
Sometimes the point at which the triangle trend lines cross over sees a trend change. In this instance, that point in time has not seen a trend change (this technique does not always work).
Minor wave 3 may only subdivide as an impulse, and within it the subdivisions of minute waves ii and iv may show up as one or more red daily candlesticks or doji.
Within minor wave 3, no second wave correction may move beyond the start of its first wave below 2,676.81. Along the way up, any deeper corrections may now find support at the lower edge of the base channel drawn about minor waves 1 and 2. Minor wave 3 may have the power to break above the upper edge of the base channel. If it does, then that upper edge may then provide support.
HOURLY CHART
Click chart to enlarge.
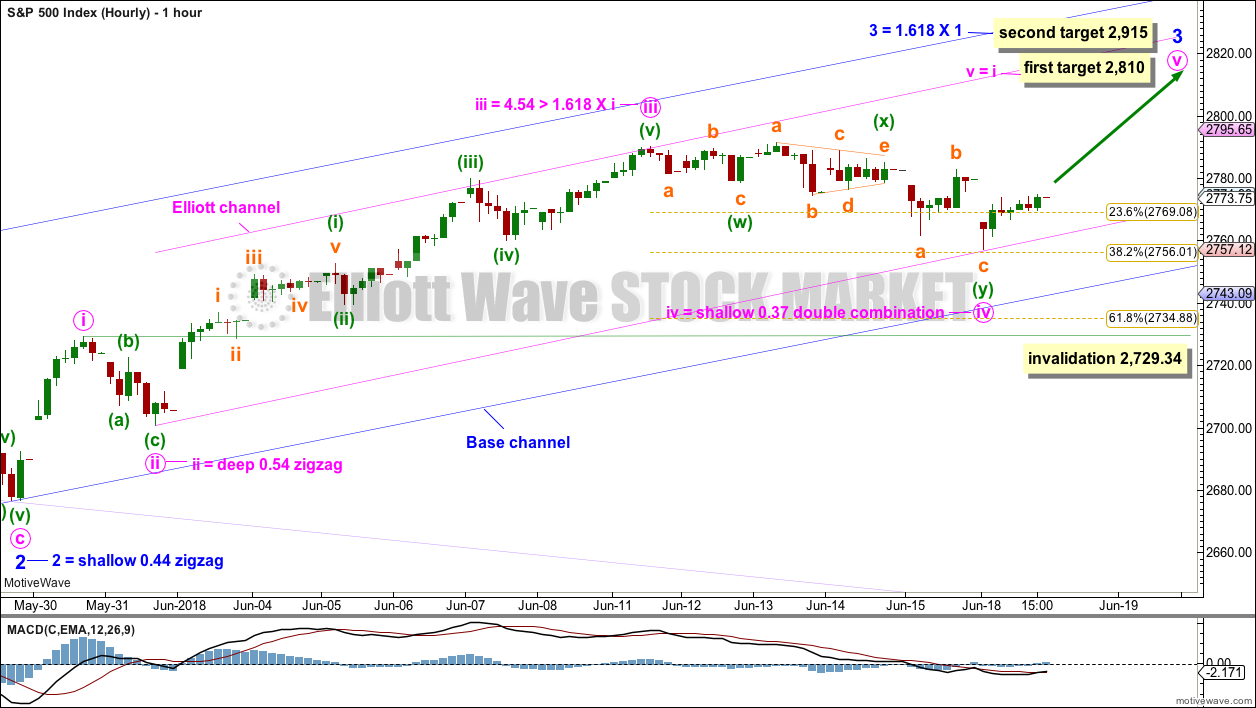
Minor wave 3 may only subdivide as an impulse, and within it all third waves at all degrees may only subdivide as impulses.
At this stage, the impulse of minor wave 3 no longer has a reasonably good look. The continuation of minute wave iv now sees minute waves ii and iv grossly disproportionate, giving this five wave impulse a three wave look. For this reason, an alternate idea is considered below.
Minute wave iv may have moved lower today as a double combination. This may also fit as a double zigzag.
The first target for minute wave v to complete minor wave 3 is recalculated.
Minute wave iv may not move into minute wave i price territory below 2,729.34.
We may have reasonable confidence that minute wave iv is over only when price moves strongly higher to a new high above 2,790.
ALTERNATE HOURLY CHART
Click chart to enlarge.
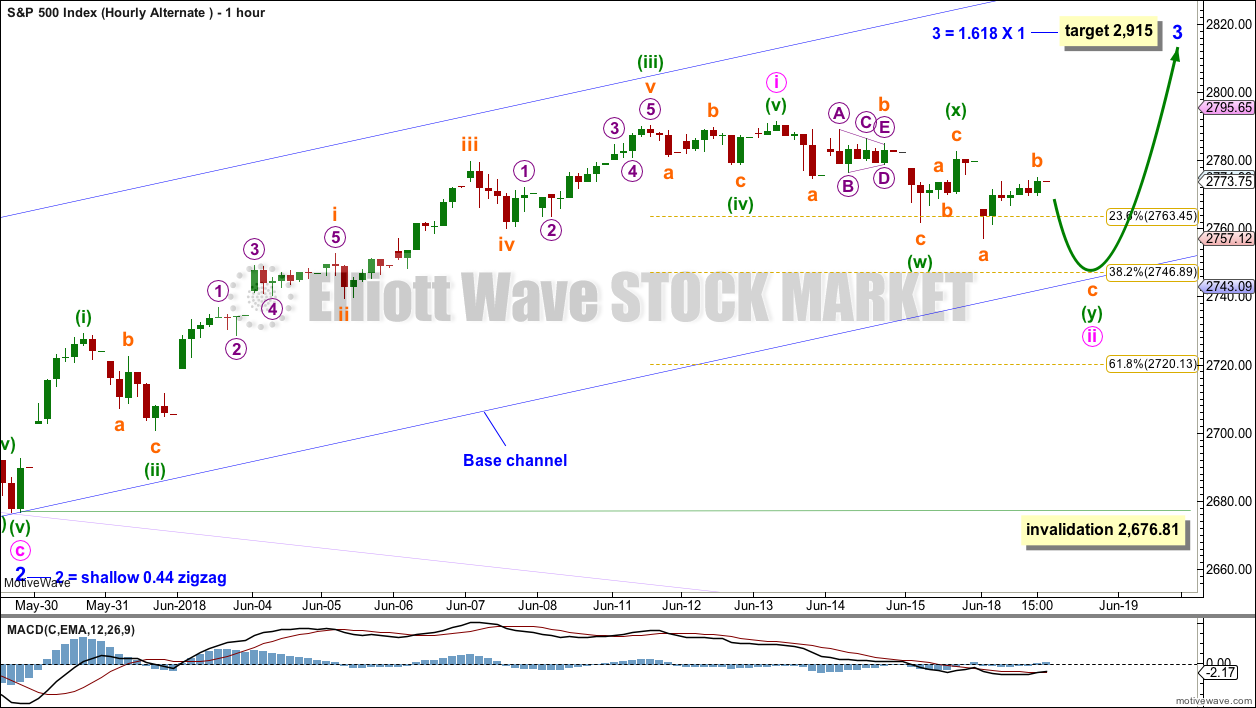
By moving the degree of labelling within minor wave 3 all down one degree, and slightly adjusting the labels within it, the last high may have been only minute wave i within minor wave 3. The current pullback may be minute wave ii.
This alternate wave count has better proportions now than the main hourly wave count.
If this wave count is correct, then tomorrow’s session may begin with another gap downwards to a new low. Minute wave ii does not fit as a completed corrective structure at today’s low, so it needs a final wave down. The structure of minute wave ii may be a double zigzag, with only subminuette wave c of the second zigzag for minuette wave (y) required to complete it.
Minute wave ii may end about the 0.382 Fibonacci ratio of minute wave i at 2,747, which is also about the lower edge of the blue base channel. Lower degree second waves should find support or resistance at base channels drawn about first and second waves one or more degrees higher.
This wave count is more bullish than the main wave count. When minute wave ii is over, then this wave count expects an increase in upwards momentum as a third wave at two degrees unfolds.
Minute wave ii may not move beyond the start of minute wave i below 2,676.81.
If tomorrow sees another low, then the main hourly wave count will be discarded in favour of this alternate.
TECHNICAL ANALYSIS
WEEKLY CHART
Click chart to enlarge. Chart courtesy of StockCharts.com.
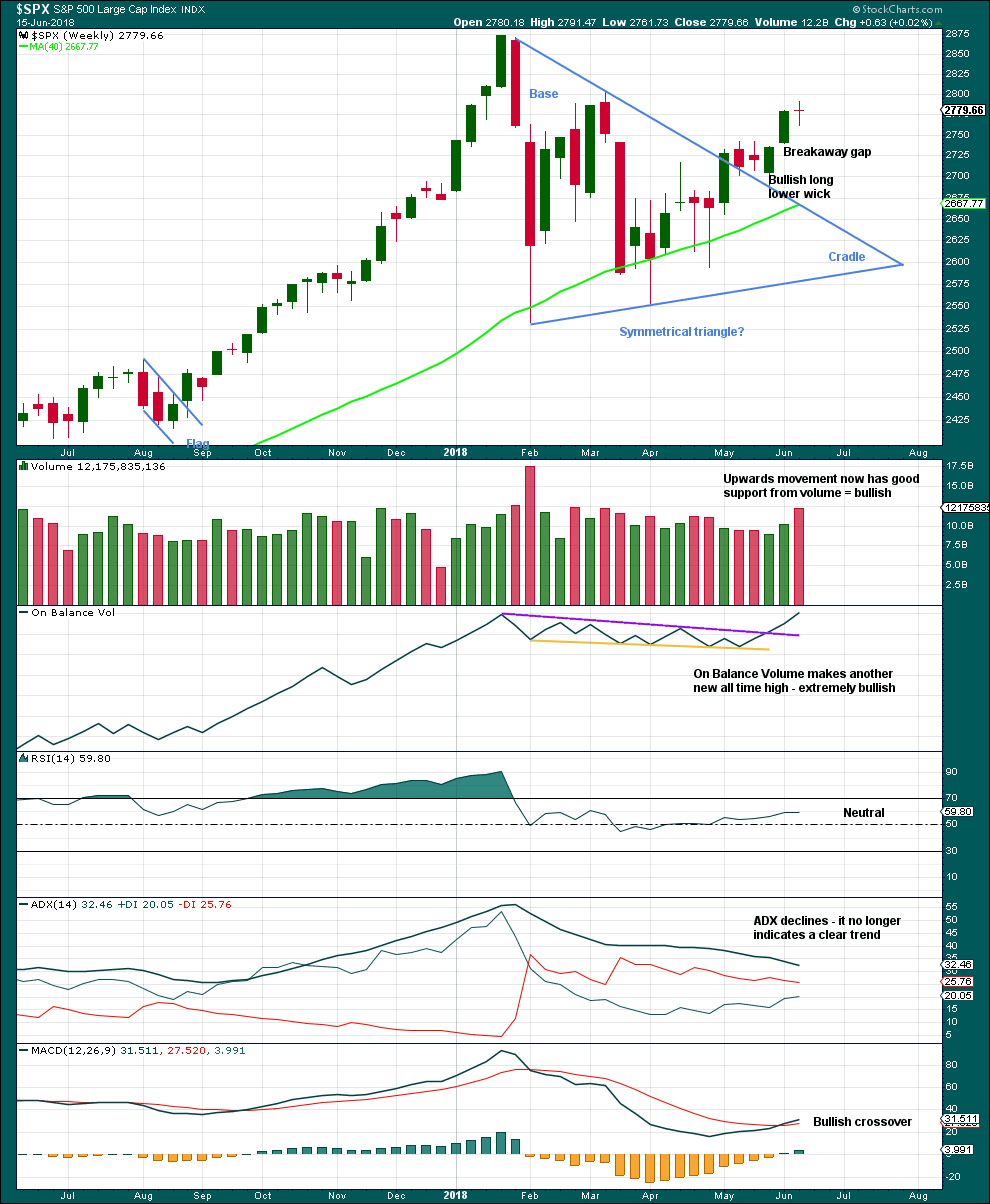
The small doji candlestick on its own is not a reversal signal. A doji signals a pause, a balance between bulls and bears.
Much weight in this analysis this week will be given to the new all time high for On Balance Volume. This is extremely bullish. It is likely that price shall follow through within a few weeks to new all time highs.
This chart is very bullish.
DAILY CHART
Click chart to enlarge. Chart courtesy of StockCharts.com.
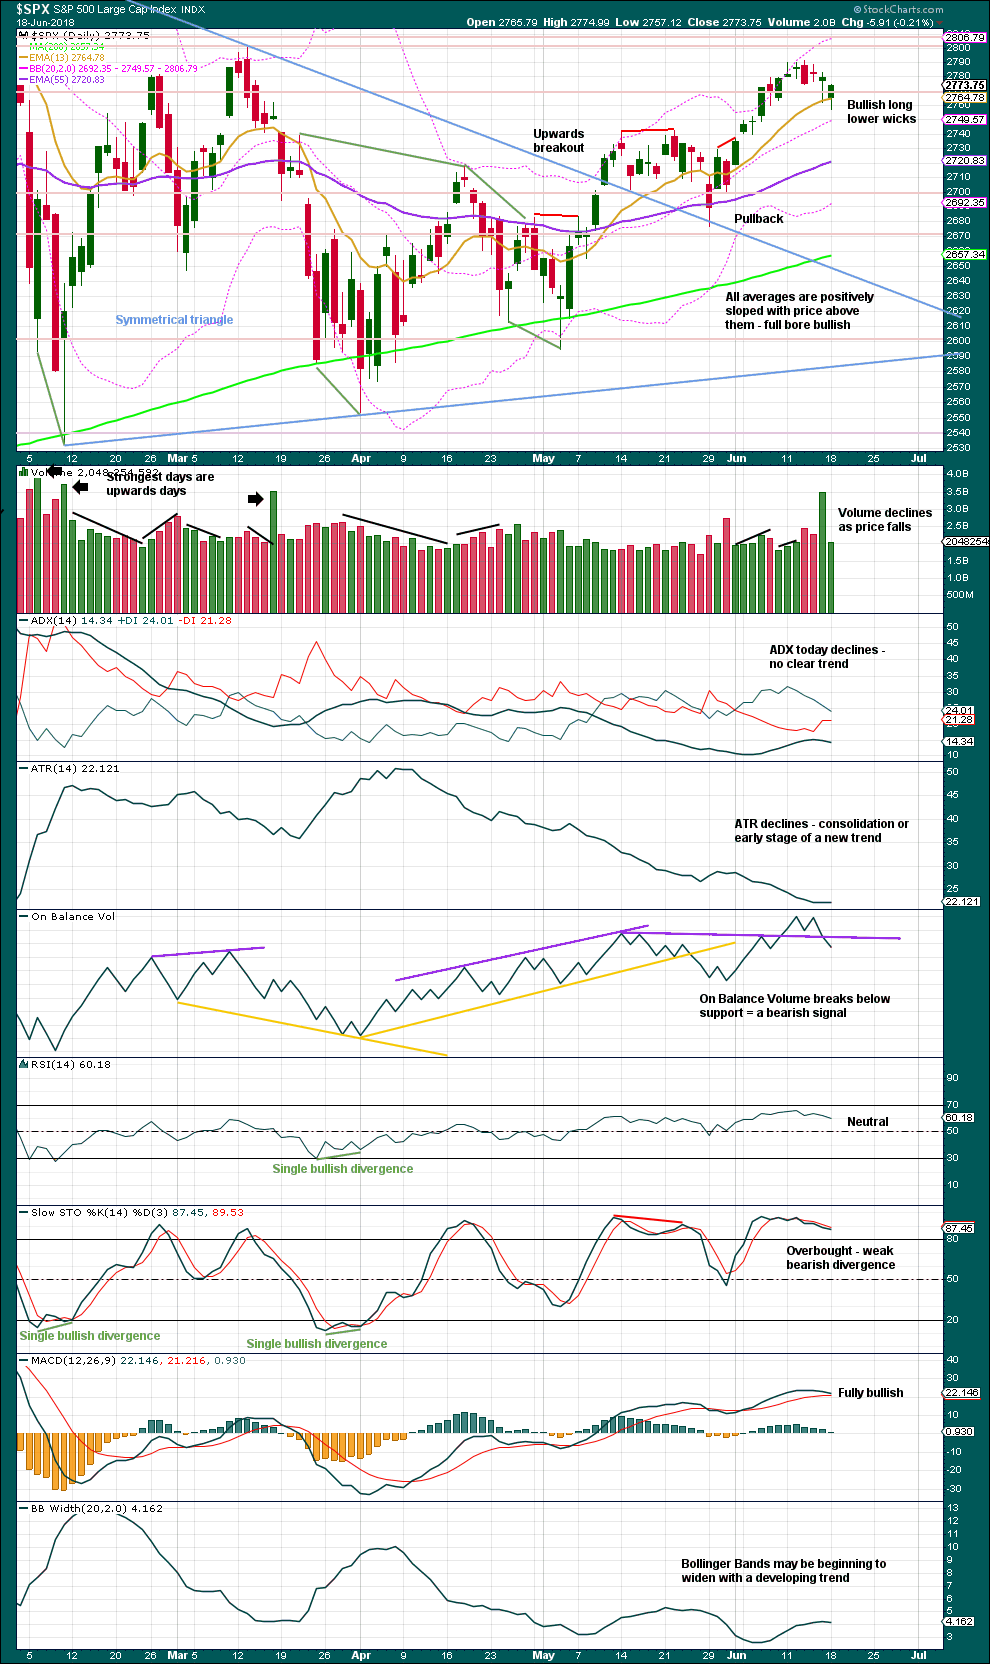
The symmetrical triangle may now be complete. The base distance is 340.18. Added to the breakout point of 2,704.54 this gives a target at 3,044.72. This is above the Elliott wave target at 2,922, so the Elliott wave target may be inadequate.
The bearish signal given from On Balance Volume supports the alternate hourly wave count today.
The long lower wicks and lack of support from volume for downwards movement strongly suggest a low may be in place here or very soon. This looks like a pullback within a developing upwards trend.
VOLATILITY – INVERTED VIX CHART
Click chart to enlarge. Chart courtesy of StockCharts.com. So that colour blind members are included, bearish signals
will be noted with blue and bullish signals with yellow.
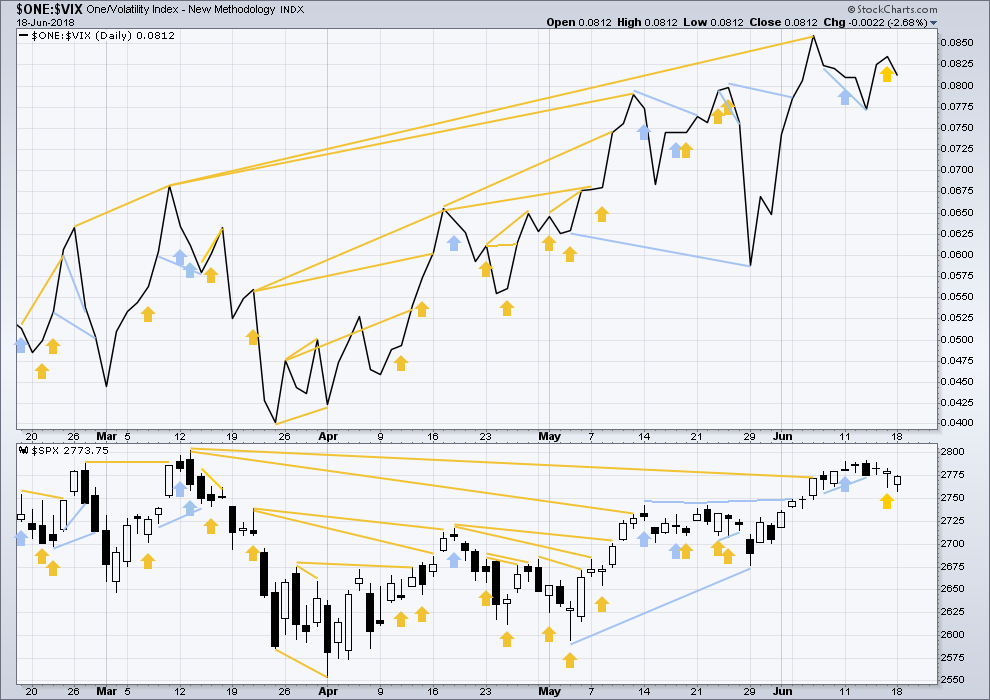
Normally, volatility should decline as price moves higher and increase as price moves lower. This means that normally inverted VIX should move in the same direction as price.
Inverted VIX has made a new high above the prior swing high of the 9th of March, but price has not made a corresponding new swing high about the same point yet. This divergence is bullish. Inverted VIX is still a little way off making a new all time high.
Both price and inverted VIX moved lower today. There is no new divergence.
BREADTH – AD LINE
Click chart to enlarge. Chart courtesy of StockCharts.com.
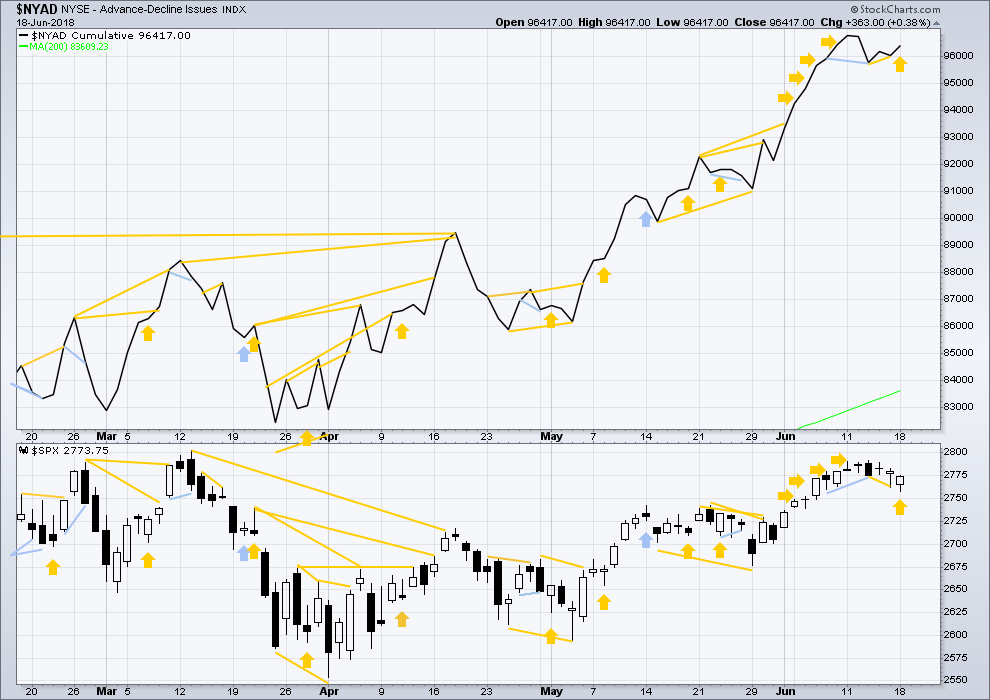
There is normally 4-6 months divergence between price and market breadth prior to a full fledged bear market. This has been so for all major bear markets within the last 90 odd years. With no longer term divergence yet at this point, any decline in price should be expected to be a pullback within an ongoing bull market and not necessarily the start of a bear market. New all time highs from the AD line means that any bear market may now be an absolute minimum of 4 months away. It may of course be a lot longer than that. My next expectation for the end of this bull market may now be October 2019.
Small caps and mid caps have both made new all time highs. It is large caps that usually lag in the latter stages of a bull market, so this perfectly fits the Elliott wave count. Expect large caps to follow to new all time highs.
Breadth should be read as a leading indicator.
Price moved lower, but the AD line moved higher. Downwards movement during Monday’s session does not have support from declining market breadth. The improvement in market breadth today is bullish.
Overall, the AD line still remains mostly bullish as it has made more than one new all time high last week. Price may reasonably be expected to follow through in coming weeks.
DOW THEORY
The following lows need to be exceeded for Dow Theory to confirm the end of the bull market and a change to a bear market:
DJIA: 23,360.29.
DJT: 9,806.79.
S&P500: 2,532.69.
Nasdaq: 6,630.67.
Only Nasdaq at this stage is making new all time highs. DJIA and DJT need to make new all time highs for the ongoing bull market to be confirmed.
Charts showing each prior major swing low used for Dow Theory may be seen at the end of this analysis here.
Published @ 09:33 p.m. EST.
New main wave count:
While this second wave is relatively shallow (<50%) it has found support right at the lower edge of the base channel (when it's drawn on an arithmetic scale, a little below on a semi-log scale).
This may force minute ii to be a little more shallow than otherwise.
Second waves do not have to be deep, there are plenty of examples in the chart of shallow second waves, including minor 2.
If the base channel works, then that's it for minute ii. Base channels most often work, but not always.
However, there are two open gaps. At this time they could be breakaway or measuring gaps, and they're not often closed. As Verne quite right points out, gaps on the open, then price moving away, is a feature of a new trend. While these gaps remain open this will be a possibility.
A new high above 2,779.40 would close the last two open gaps and give a lot of confidence in minute iii of minor 3.
These open gaps could be a big problem.
Multiple gaps up are seen at the start, and at the end of extended bull runs.
Multiple gaps down are seen at the start, and at the end of extended bear runs.
Something’s gotta give….
Looks like 1s and 2s to me. No buyers other than the banksters, trade safe!
Sure is a lot of overnight market volatility (sell off action), relative to day session during this period. Hmm. Now, if I wanted to manipulate the market a bit, seems like I’d do it in the night session myself, when my money has 10-100x the power. Why would big money want to push down the market overnight? Followed by apparently being quiet buyers through the day session? First order guess: the smart money is manipulating for their own cheaper accumulation purposes, preparing for the wave 3 action right ahead. This hypothesis is well aligned with our count and expectations.
No accumulation Kevin, Smart money index is nearing it’s 2009 low. Smart money has been liquidating at the fastest pace in history, and the commercial short interest remains near all time record highs.Insider selling is so rampant, that even the SEC now has a problem with it. Foreign buyers have disappeared, and we’ve had a massive exodus from EM, which have 17 countries in confirmed bear markets. To your point, they game both the futures, and day sessions. This is not speculation, this is not conspiracy theory. It will be written about for many years to come once the bear opens up.
Thank you for the warning!!
I’ll be ready with some large bearish ratio backspreads as profitable insurance…when the time is upon us. Not quite?
Welcome, my honest response is I have no clue! The capital markets are broken. I continue to trade how I want to trade on the side I prefer to be on, while also buying deep value, prosaic businesses on sale. The action recently suggests something is about to crack. I could see a ramp to 3000 or a fast drop to 2200, nothing would surprise me at this point, but once the central banks no longer require the markets usefulness as a political tool, watch out below
RSPP and MTDR are worth considering today.
Someone pointed out late in the session yesterday how the “monsters of tech” (FB, AAPL, AMZN, NFLX, GOOGL, MSFT) were strong yesterday (up about 1.5% collectively)…while the overall NDX was flat. Said someone proceeded to start putting on QQQ shorts for today.
An interesting divergence worth keeping an eye out for the in the future!
today the monsters of tech are underperforming vs. the overall NDX. Here’s the daily of the combined ticker. This is the engine of QQQ. And at this TF, it’s awfully bullish overall. I will be watching carefully though for the low on 6/8 to hold (just below the 38% fibo); if that gets undercut, there could be a major sell off in these issues underway.
I don’t fully buy the current SPX low. Once again, “lost in space”, between the 38% and 50% fibo (though it is right at the highs of the 5/14 and 5/22 daily bars). The overnight just about tagged the 50%; maybe that’s sufficient for proper fractal structure low. But I won’t be surprised in the slightest if we see a sudden sharp sell of here today down to the 62% at 2721. The market loves clear fractal relationships. And there are certainly weaker hands to be shaken out here too. We’ll see!
but is overnight sufficient, or do we need to tag 50% during the day?
Most EW technicians do not use after hour data for their charts. Lara disregards what happens after hour as far as her EW charting goes.
XLP has broken daily and hourly down trend lines, and polarity inverted to up trending on the hourly. I decided to trade this a bit different. I bought 5 Sept OTM calls at 55 (current price is about 51), for a whopping $100. If price gets to 55 by August (very possible, maybe even likely), those should be worth about $100 apiece. I like the risk/reward.
In case anyone isn’t aware, the overnight session low was 2735.75. A revisit at least is appearing more and more likely.
That rarely plays out!
I didn’t pull the trigger yet… so you all know.
does it matter that (y) = 1.618 (w) at around 2735?
It increases likelihood of the low holding. The more fractal relationships, the more likely the structure is “legitimate”.
The Kiwi are world leaders (from online magazine GearJunkie, June 19, 2018, by Julie Kailus):
“New Zealander Veronica Harwood-Stevenson founded Humble Bee to research a promising cellophane-like nesting material made by native Australian bees.
The solitary, yellow-faced Hylaeus bee, which resembles a wasp, collects pollen like most bees. But instead of constructing an independent hive, these bees build and store food in a protective cell lining inside natural cavities like dead twigs and plant stems.
Harwood-Stevenson is using prize money from the Wellington Regional Economic Development Agency’s Bright Ideas Challenge as well as venture capital to fund her investigation in the bioplastic potential of this natural bee material.”
Hey, that’s cool!
One of my surfing girlfriends is a beekeeper. I’ll ask her if she’s heard of this.
So yes this is indeed a minute ii down, not a iv.
As such, it’s “most natural” target (ignoring channel lines) is 2719.6, the 62%. That said at the day session only level it’s bounced cleanly off the 38% and perhaps that will hold. But don’t be surprised if it doesn’t.
I think the June 1st gap with a lower boundary around 2736 should provide strong support. If that breaks 2720 is a real possibility. Therefore, perhaps the stop loss for longer term investors should be a bit below the 2720 point.
Low now 3746.42… Lara’s 2746.89 looks to be holding so far.
2747.04 is the low at the moment … 2746.89 was Lara’s turn on alt count chart…
So right about here!
I think today is a wonderful opportunity to load the boat with a tight stop around 2725.
I agree!
Too high IMO ; the 62% retrace is below that and is a very reasonable target for this minute ii.
For those with deployed long spreads, it could be an opportunity to cash in on the short side (part or all). Now THAT strategy is leaning HEAVILY into your belief in the count! But it can be extremely profitable. Essentially you end up “milking” the market volatility.
Ya think??!! 🙂
Alright alright, next time I’ll properly identify it as the “Verne play”!
Now I realize one reason why bull debit spreads (vs credit spreads) has an advantage: you can buy back the short option in one of these situations without a problem. But if you’ve used a bull credit spread…you have to sell the long option, leaving you with only the short options. Which carry margin requirements when naked. And when those are SPX options…that ain’t chump change!!! Learning sumtin or other every day I am.
Well I’ve managed to grind out decent daily profits just buying and selling a few SPX calls here so it’s all good. I’ll just hold my large Sept bull credit spread; that’ll pay just fine in a few months.
I usually don’t leave it naked. Just buy something deep out of the money for cheap (Something @ .01). That helps a lot with margin requirements and also has saved me from time to time if you are holding a short put the day of an “event”.
With credit spreads, the idea is ALWAYS to exit the trade by buying back the short option leg. For example, I bought back my short DIA calls today of a bear 248/250 call credit spread on the market’s decline.
For the DIA 243/245 bull put credit spread opened today, the idea is to buy back the short 245 put on any move higher and hold the long 243 puts.
It is never a good idea to exit any spread holding only the short leg as this undermines the entire idea of the spread trade, which is to LIMIT/REDUCE risk.
If you are using debit spreads, you are excepting a limit on your profit potential in exchange for a cheaper entry but again the idea is to exit the ENTIRE spread once the trade becomes profitable.
A quick mnemonic:
Debit Spread: For PROFIT, “with the trend”
Credit Spread: For POSITION, ” counter-trend” 🙂
Just a note Lara regarding your weekly service. The main / home web page listing EWSM daily updates and the Weekly postings do not show any comments on the Weekly. Yet when I went to the Weekly this AM there were 3 comments and I posted a 4th. The main page still indicates “No Comments”. You may want to have your wonderful web master take a look at this. Have a great day.
Oh dear, thanks for pointing that out Rodney. Yes, I’ll ask Cesar to look into it today.
Keep an eye on the ES mini futures COT report. They have been at record net short positions for quite some time. If they don”t cover today, that could be a game-changer. I will be covering short DIA 248 calls and short VIX 13 puts at the open. Holding DIA 250 calls and widened SPY bull put spread spread to capture profits on long puts. If count invalidated or we close at lows will exit SPY short puts. The COT report was telling us to fully hedge long trades. Have a great trading day everyone!
https://www.barchart.com/futures/commitment-of-traders/technical-charts/ES*0
Thanks Lara for the Alternate count. It looks like after hour trading on the SPX futures is saying the Alternate Hourly is the correct count as futures are down 25+ points.
You’re welcome. Yes, this will be the only count today.