
A green daily candlestick was expected for Friday’s session. Although the candlestick printed green, the session saw a lower low that was not expected.
Overall, the Elliott wave count remains the same with price remaining well above the invalidation point. The AD line and On Balance Volume continue to support the Elliott wave analysis.
Summary: A new all time high from On Balance Volume at the weekly chart level is extremely bullish, so expect upwards movement next week. There is also bullish divergence now between price and the AD line and VIX, signalling upwards movement to start next week.
The first short term target is now at 2,814. The second short term target is at 2,915. At one of these targets a sideways consolidation to last about a week is expected.
The mid to longer term target is at 2,922 (Elliott wave) or 3,045 (classic analysis). Another multi week to multi month correction is expected at one of these targets.
The final target for this bull market to end remains at 3,616.
The Elliott wave count has good support from classic technical analysis. New all time highs this week from On Balance Volume and the AD line add strong confidence to this analysis.
Pullbacks are an opportunity to join the trend.
Always practice good risk management. Always trade with stops and invest only 1-5% of equity on any one trade.
New updates to this analysis are in bold.
The biggest picture, Grand Super Cycle analysis, is here.
Last historic analysis with monthly charts is here, video is here.
ELLIOTT WAVE COUNT
WEEKLY CHART
Click chart to enlarge.
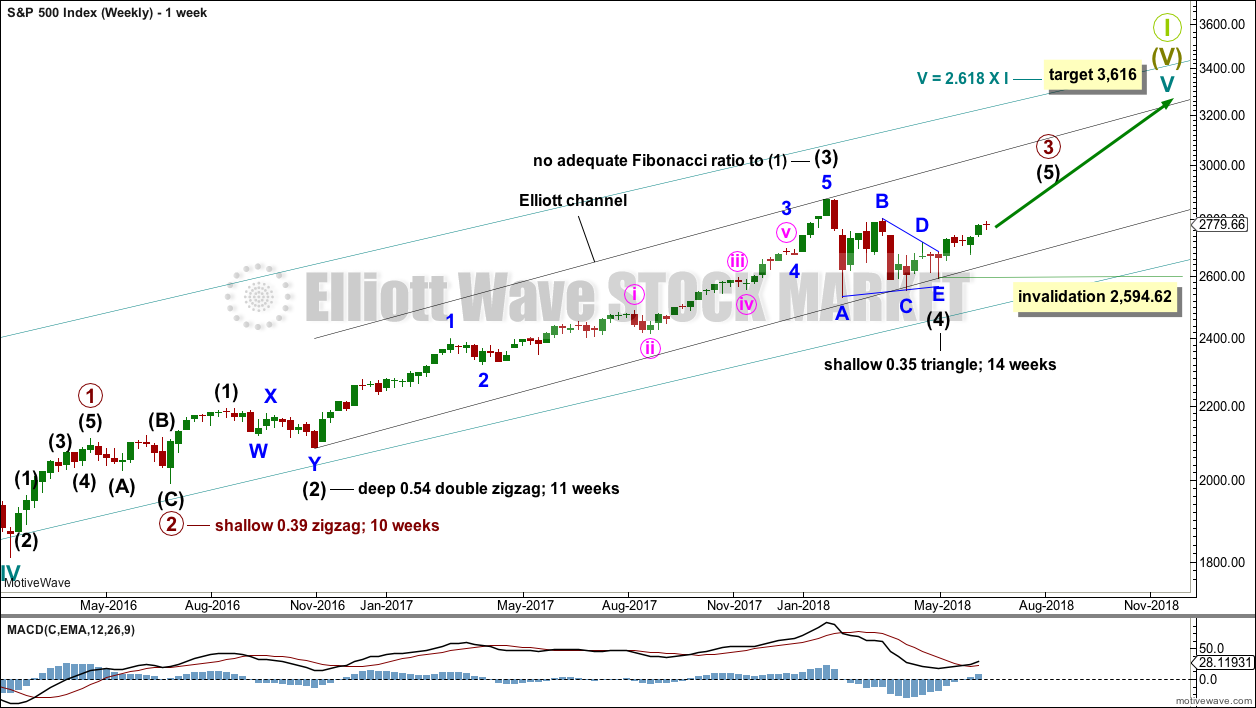
Cycle wave V must complete as a five structure, which should look clear at the weekly chart level and also now at the monthly chart level. It may only be an impulse or ending diagonal. At this stage, it is clear it is an impulse.
Within cycle wave V, the third waves at all degrees may only subdivide as impulses.
Intermediate wave (4) has breached an Elliott channel drawn using Elliott’s first technique. The channel is redrawn using Elliott’s second technique: the first trend line from the ends of intermediate waves (2) to (4), then a parallel copy on the end of intermediate wave (3). Intermediate wave (5) may end either midway within the channel, or about the upper edge.
Intermediate wave (4) may now be a complete regular contracting triangle lasting fourteen weeks, one longer than a Fibonacci thirteen. There is perfect alternation and excellent proportion between intermediate waves (2) and (4).
Within intermediate wave (5), no second wave correction may move beyond the start of its first wave below 2,594.62.
DAILY CHART
Click chart to enlarge.
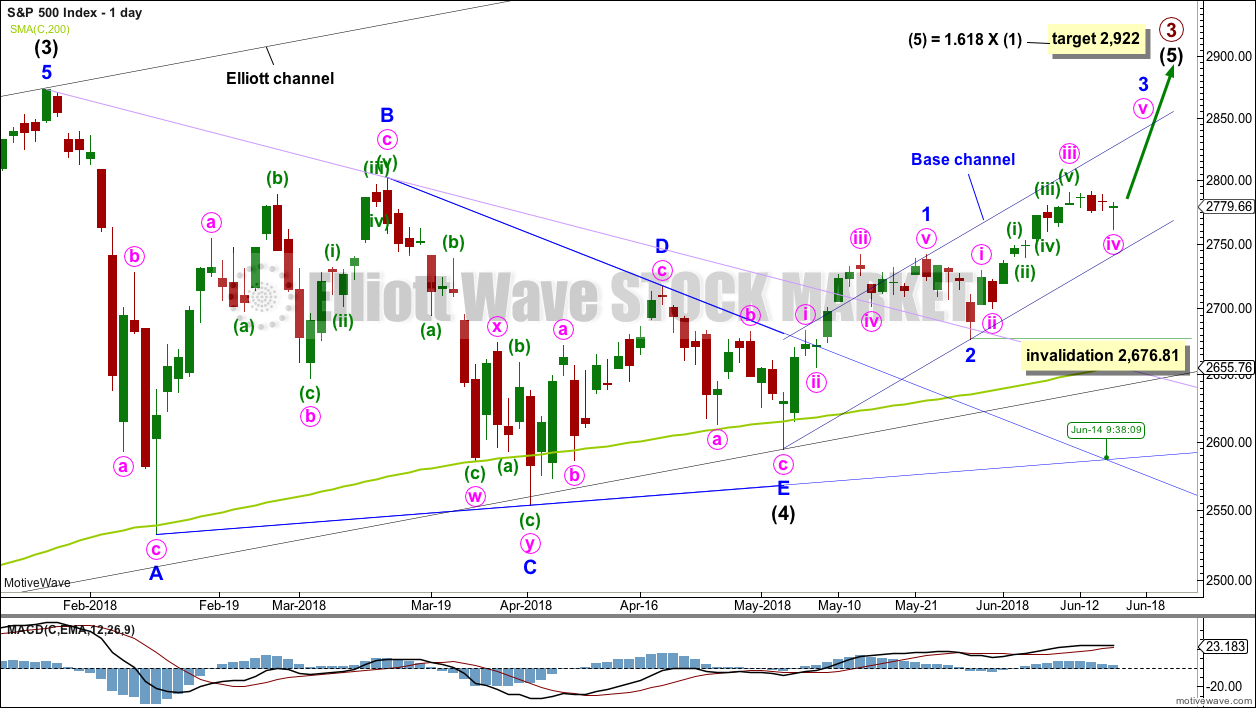
It is possible that intermediate wave (4) is a complete regular contracting triangle, the most common type of triangle. Minor wave E may have found support just below the 200 day moving average and ending reasonably short of the A-C trend line. This is the most common look for E waves of triangles.
Intermediate wave (3) exhibits no Fibonacci ratio to intermediate wave (1). It is more likely then that intermediate wave (5) may exhibit a Fibonacci ratio to either of intermediate waves (1) or (3). The most common Fibonacci ratio would be equality in length with intermediate wave (1), but in this instance that would expect a truncation. The next common Fibonacci ratio is used to calculate a target for intermediate wave (5) to end.
Price has clearly broken out above the upper triangle B-D trend line. This indicates that it should now be over if the triangle is correctly labelled.
A trend line in lilac is added to this chart. It is the same line as the upper edge of the symmetrical triangle on the daily technical analysis chart. Price has found support about this line at the last two small swing lows. The suppport at this line has reasonable technical significance now that it has been tested twice, and this line should be assumed to continue to provide support until proven otherwise.
Sometimes the point at which the triangle trend lines cross over sees a trend change. A trend change at that point may be a minor one or a major one. That point is Friday, and it may signal the end of minute wave iv.
Minor wave 3 may only subdivide as an impulse, and within it the subdivisions of minute waves ii and iv may show up as one or more red daily candlesticks or doji.
Within minor wave 3, no second wave correction may move beyond the start of its first wave below 2,676.81. Along the way up, any deeper corrections may now find support at the lower edge of the base channel drawn about minor waves 1 and 2. Minor wave 3 may have the power to break above the upper edge of the base channel. If it does, then that upper edge may then provide support.
HOURLY CHART
Click chart to enlarge.
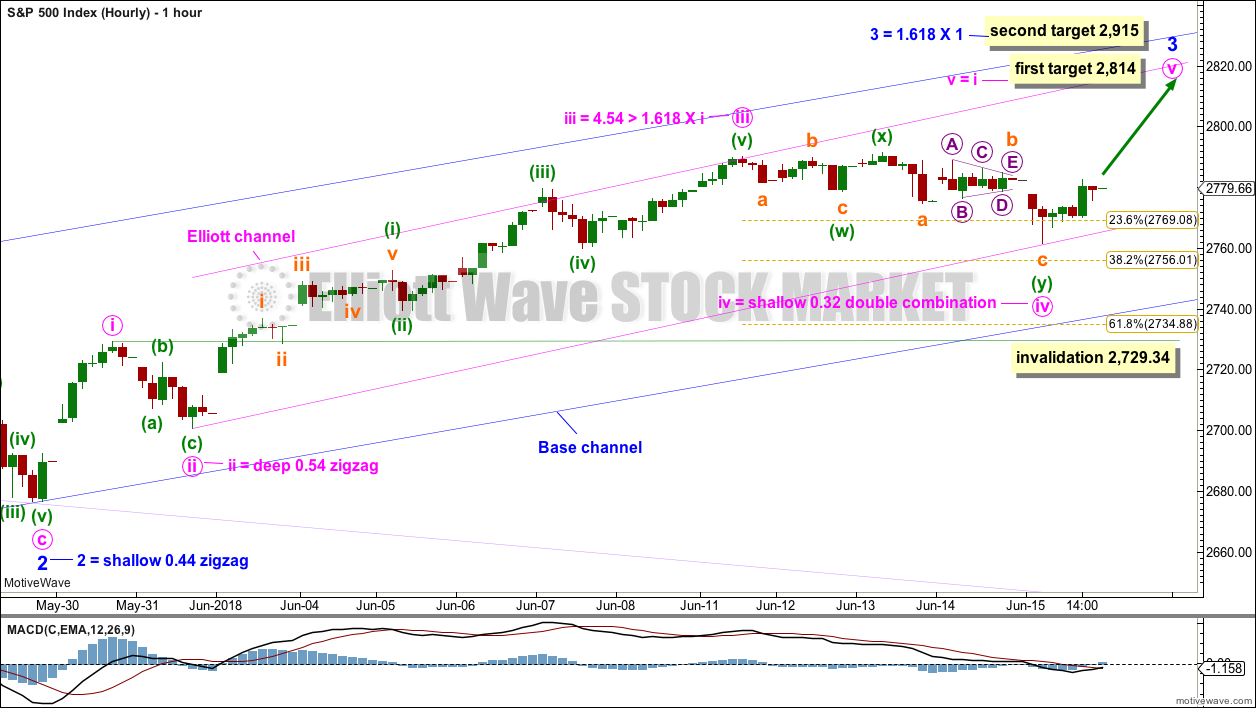
Minor wave 3 may only subdivide as an impulse, and within it all third waves at all degrees may only subdivide as impulses.
At this time, this impulse still looks very good: Minute wave iii is close to 1.618 the length of minute wave i; there is perfect alternation between minute waves ii and iv; and, the whole structure fits well into an Elliott channel with a typical throw-over of the middle of the third wave for minuette wave (iii). What does not look textbook perfect now is the disproportion in duration between minute waves ii and iv. However, combinations do tend to be longer lasting structures than zigzags.
The first target expects minute wave v to exhibit the most common Fibonacci ratio to minute wave i. The second target expects minor wave 3 to exhibit the most common Fibonacci ratio to minor wave 1.
If the structure of minute wave v may be seen as complete when price approaches the first target, then it may end there. But if price keeps rising through the first target, or if it gets there and the structure is incomplete, then the second target would be used.
Until there is a strong upwards thrust out of minute wave iv, the invalidation point must remain the same. The risk here is still that minute wave iv may not be over, that it may continue lower; although that risk at the end of Friday’s session is now judged to be somewhat lower, it does still remain. Minute wave iv may not move into minute wave i price territory below 2,729.34.
TECHNICAL ANALYSIS
WEEKLY CHART
Click chart to enlarge. Chart courtesy of StockCharts.com.
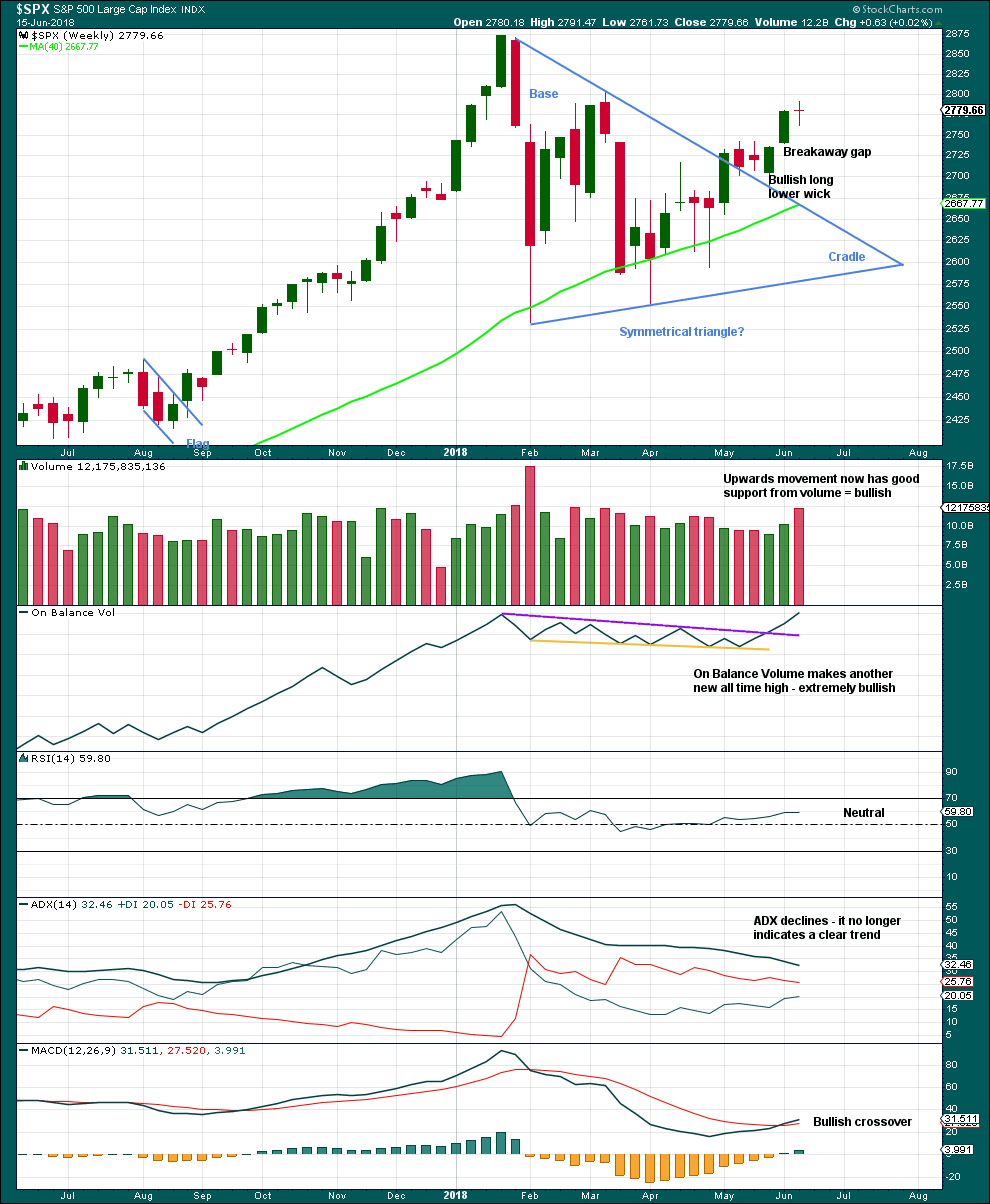
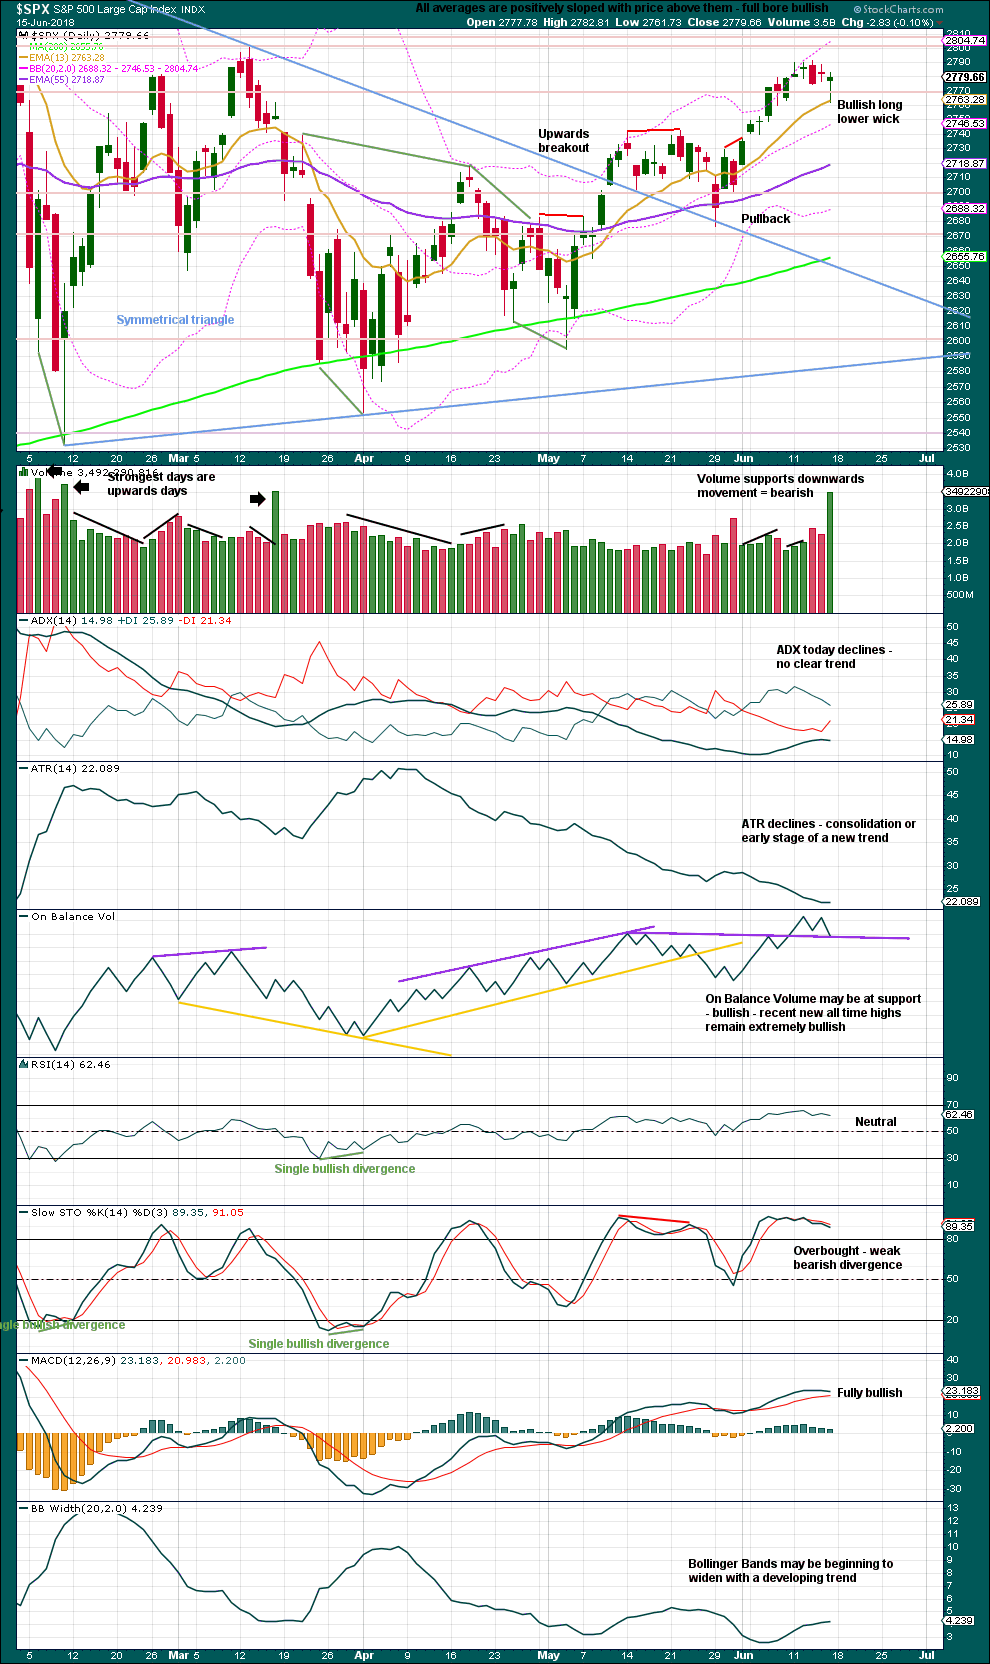
The small doji candlestick on its own is not a reversal signal. A doji signals a pause, a balance between bulls and bears.
Much weight in this analysis this week will be given to the new all time high for On Balance Volume. This is extremely bullish. It is likely that price shall follow through within a few weeks to new all time highs.
This chart is very bullish.
DAILY CHART
Click chart to enlarge. Chart courtesy of StockCharts.com.
The symmetrical triangle may now be complete. The base distance is 340.18. Added to the breakout point of 2,704.54 this gives a target at 3,044.72. This is above the Elliott wave target at 2,922, so the Elliott wave target may be inadequate.
The purple support line on On Balance Volume is slightly adjusted to be as conservative as possible (there is some leeway in exactly how that line may be drawn). As it is drawn here, the support line may be offering some support.
Overall, this chart is more bullish and neutral. Only the volume spike for Friday is bearish.
VOLATILITY – INVERTED VIX CHART
Click chart to enlarge. Chart courtesy of StockCharts.com. So that colour blind members are included, bearish signals
will be noted with blue and bullish signals with yellow.
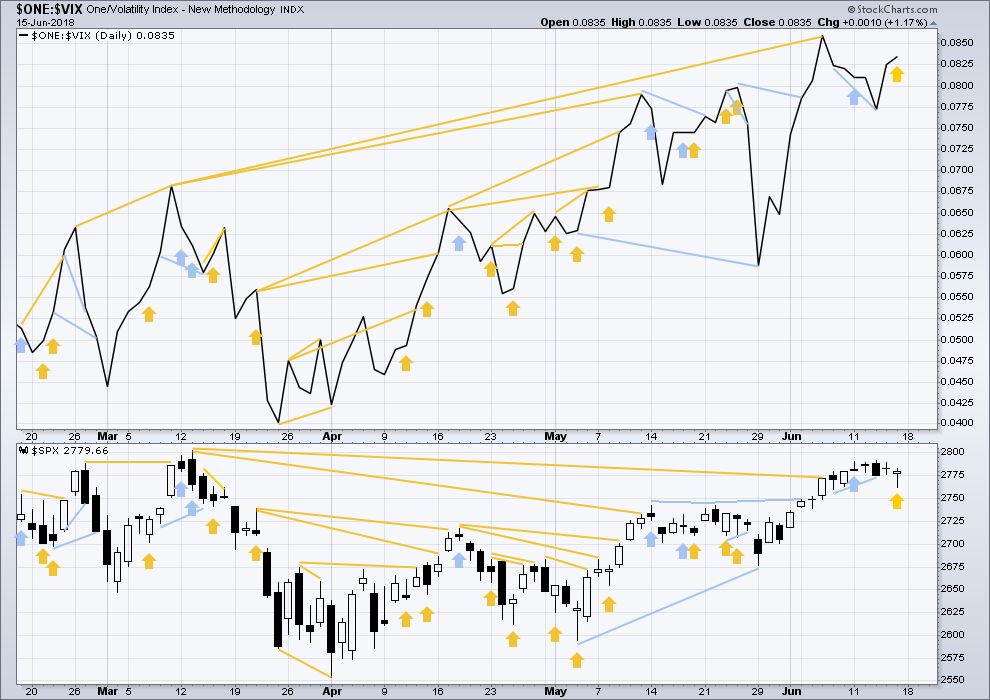
Normally, volatility should decline as price moves higher and increase as price moves lower. This means that normally inverted VIX should move in the same direction as price.
Inverted VIX has made a new high above the prior swing high of the 9th of March, but price has not made a corresponding new swing high about the same point yet. This divergence is bullish. Inverted VIX is still a little way off making a new all time high.
Price moved lower on Friday, but inverted VIX moved higher. This divergence is bullish and supports the Elliott wave count.
BREADTH – AD LINE
Click chart to enlarge. Chart courtesy of StockCharts.com.
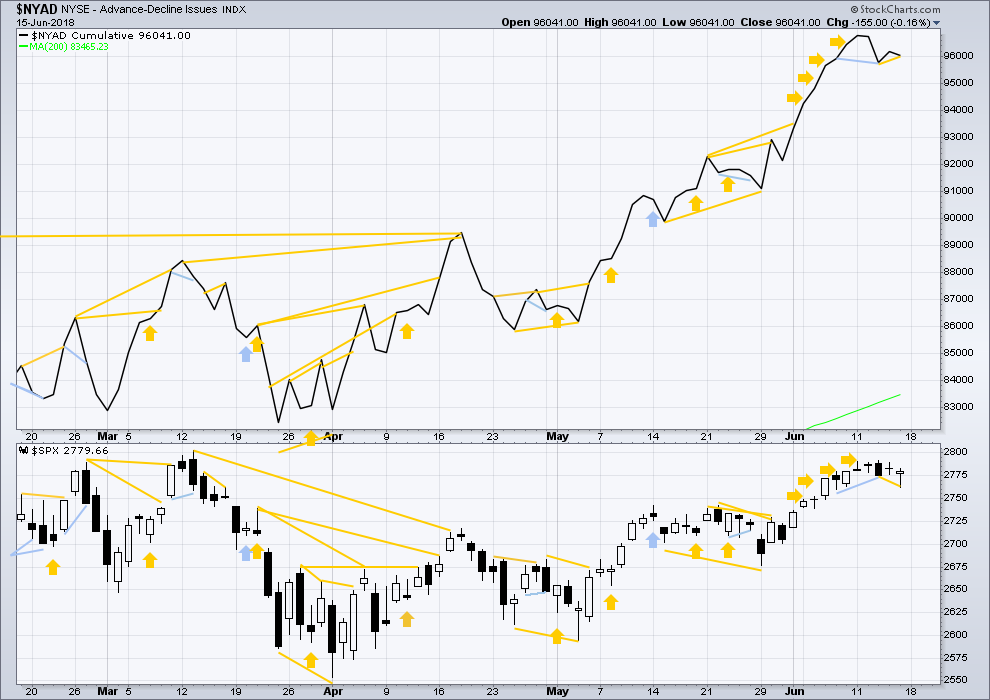
There is normally 4-6 months divergence between price and market breadth prior to a full fledged bear market. This has been so for all major bear markets within the last 90 odd years. With no longer term divergence yet at this point, any decline in price should be expected to be a pullback within an ongoing bull market and not necessarily the start of a bear market. New all time highs from the AD line means that any bear market may now be an absolute minimum of 4 months away. It may of course be a lot longer than that. My next expectation for the end of this bull market may now be October 2019.
Small caps and mid caps have both made new all time highs. It is large caps that usually lag in the latter stages of a bull market, so this perfectly fits the Elliott wave count. Expect large caps to follow to new all time highs.
Breadth should be read as a leading indicator.
Price and the AD line moved slightly lower. Price has made a new low below the low two sessions prior, but the AD line has not. This divergence is bullish and supports the Elliott wave count.
Overall, the AD line still remains mostly bullish as it has made more than one new all time high this week. Price may reasonably be expected to follow through in coming weeks.
DOW THEORY
The following lows need to be exceeded for Dow Theory to confirm the end of the bull market and a change to a bear market:
DJIA: 23,360.29.
DJT: 9,806.79.
S&P500: 2,532.69.
Nasdaq: 6,630.67.
Only Nasdaq at this stage is making new all time highs. DJIA and DJT need to make new all time highs for the ongoing bull market to be confirmed.
Charts showing each prior major swing low used for Dow Theory may be seen at the end of this analysis here.
Published @ 07:21 p.m. EST on 16th June, 2018.
Texas tea anyone? Oil futures have bounced off a major 62%. I’m not directly trading oil, but trading oil stocks, and I absolutely want to see that fibo hold. Then the trend line break and polarity reversal and some upward movement.
Kevin, I wanted to pay you a compliment…superb charting and analysis as of late. Keep it up!
Yes, I second that. Thank you very much Kevin for sharing your expertise and tips on various markets.
You’re both welcome. Doing the work to the level of “sharable” is part of my discipline around assuring I’m not taking wild swings, and perhaps others can get some value out of it too.
It looks now like the triangle of a couple of days ago may have been wave X, not wave b.
This still fits as a double combination, although it now has a strong slope which is not the typical look for a combination.
It could also fit as a double zigzag, with inadequate alternation between minute ii single zigzag.
OR
I may have to change the degree of labelling, this could be a fourth wave counter part to minor 2…. I’ll have an alternate today for that idea.
This idea, maybe? Wave W of minute iv unfolding as an expanding ending diagonal? If so, I’d expect one more push down to near 38% retrace.
Correction: it would be wave C or Y. Or something…
The FANG set up and trigger from last week is playing out according to Hoyle. Hourly TL break + polarity inversion => trend change! Other oil co’s are approaching similar trigger points (PE, RSPP, MTDR).
If anyone likes that kind of action, here’s a similar set up with trigger pending. It’s definitely my huckleberry-to-be!!! This is AMTD hourly, and the higher TF’s are bullish as all get out.
NASDAQ looks precarious to me. Until I see the trend colors (CCI/ADX) turn neutral then up (green), and the downtrend line is broken, and the (blue) 21 ema exceeded. Right now, it’s a bit of look out below.
The low today looks to be unstable; it’s not at any fibo level, just kind of “lost in space”, and hence, I’m doubtful it’s a bottom here. HOWEVER, there is one swing high from back on 2/16 that does provide support. So…maybe it’s a real bottom. But a move down to the 38% around 2748 wouldn’t surprise me in the slightest.
Overall, I’m starting to wonder if in fact this sideways/down price action isn’t the minor 4.
well a clear 3/5 up on the 5 min off today’s low…. let’s see if we can retest and go!
Not really how I’m seeing this Peter. I think it’s a larger WXY down, and price is in the b leg up of the Y down. Meaning, a final c leg down is coming. Should take price to that 38% fibo…or lower. Could be wrong!
Also, you can draw a downtrend line over this 4 wave action. Until that down trend line gets broken to the upside…I’m short term bearish here. It’s gotta “prove it” to me.
I did manage to grab a Dec SPX call option off the lows and get a decent little bite long. Nothing like scalps using SPX options (leverage!!!). Along with buying back a BLUE call I sold last week (blue has sold off big time in the last few days), I’m over target for the day. Which is good because I don’t think that much is going to happen here for awhile.
AMGN has triggered short, breaking a major up trend line at the hourly/daily level, and bouncing cleaning of multiple overlapped fibos, and polarity inverting to “down”. I’ve taken a bear put debit spread.
ABBV at the monthly looks to be in the middle stages of a polarity shift pattern similar to the same in 2016. As it sets up a rising lows pattern on the monthly, there should be excellent swing long opportunities at the lower tf’s. The first one off these fibo clusters might be setting up very soon.
Reasons to be cautious in SPX and even take short term sell triggers tomorrow. Pullbacks aren’t over until they are over. If the 23% holds all is well. otherwise, its to the 38% at least, and the 62% would come into play next. A sharp “trade fears” move I suppose they’d say should it develop. The hourly trend is down going into tomorrow, and price can go deeper first and fit an alternate wave count here just fine. That all said, the more probable scenario is Lara’s main hourly calling for minute v action upward.
Your caution is well warranted
Reason to believe there will be a turn back to “up” in the 44-47 zone for HAL: multiple fibo’s of support, four or more swing pivots in that zone, the 200 day ma, and a symmetric projection. Trend line breaks and polarity inversion at the hourly, trend change to green on the daily, all will provide triggers for getting on board the likely next wave up.
The larger tf (weekly/monthly) indicates this is going to break out to the upside, not the down side. Price is at the high leverage point right now, having just tagged the combination of the 200 daily ma and a many times tested 38% fibo. For those or who like to trade set ups that provide reward>>risk. An entry can be triggered in at the hourly/5 min tf level. Obviously, if the levels here don’t hold, don’t hold!!! In fact, a stop and reverse isn’t a horrible idea at all, should that happen.
Sorry…it’s JPM, one of the forlorn financials. How they have been spurned. Could change anytime!
Note: I provide all information here for educational and entertainment purposes only, for your own independent assessment, decision making, and management. “Not trading advice.” Just perspectives to consider within the context of your own plan and execution. Thanks.
In the arena of “super hot stocks” do look at AMTD. The weekly chart is tracking a steep up trend line on the weekly, and on the daily it’s once again pulled back right to and tagged and turned off that trend line. Looking for price (1) staying above that weekly level up trend line, (2) breaking the fastest down trend line and (3) showing hourly swing high/low polarity inversion to “up”.
AMGN is swinging wildly at the weekly level, and on it’s current up move just tagged and turned off a combined 62% and 78% fibo level.
Could be a good short for a 10+ point ride back down on sell triggers at the daily/hourly time frames. Looking for polarity inversion and the break of the weekly/daily level up trend line. I’ll use a put debit spread on this.
To all those who are fathers and to all those who have a father, Happy Father’s Day.