
A consolidation was expected to end about 2,769. Sideways movement overall fits the form of a consolidation, although it has turned out so far to be more shallow than expected.
Summary: It looks most likely that the correction is over today. Tomorrow looks most likely to print a green candlestick. The first short term target is now at 2,831. The second short term target is at 2,915. At one of these targets a sideways consolidation to last about a week is expected.
The mid to longer term target is at 2,922 (Elliott wave) or 3,045 (classic analysis). Another multi week to multi month correction is expected at one of these targets.
The final target for this bull market to end remains at 3,616.
The Elliott wave count has good support from classic technical analysis. New all time highs this week from On Balance Volume and the AD line add strong confidence to this analysis.
Pullbacks are an opportunity to join the trend.
Always practice good risk management. Always trade with stops and invest only 1-5% of equity on any one trade.
New updates to this analysis are in bold.
The biggest picture, Grand Super Cycle analysis, is here.
Last historic analysis with monthly charts is here, video is here.
ELLIOTT WAVE COUNT
WEEKLY CHART
Click chart to enlarge.
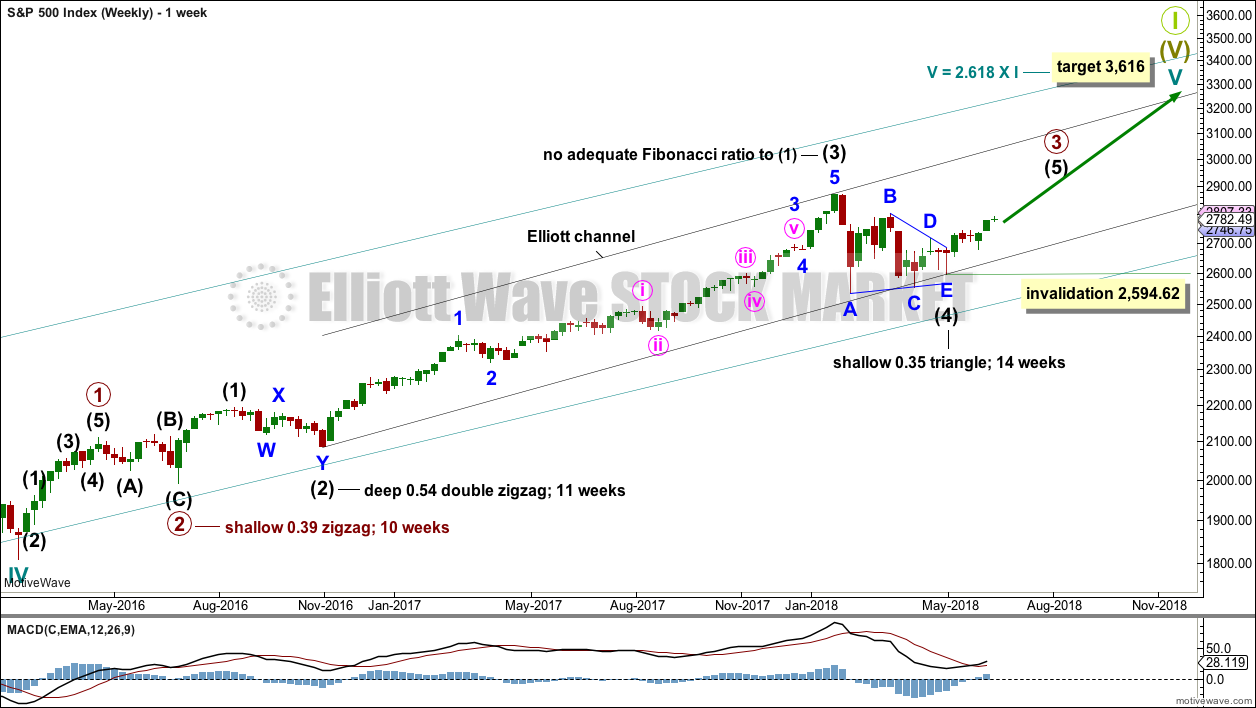
Cycle wave V must complete as a five structure, which should look clear at the weekly chart level and also now at the monthly chart level. It may only be an impulse or ending diagonal. At this stage, it is clear it is an impulse.
Within cycle wave V, the third waves at all degrees may only subdivide as impulses.
Intermediate wave (4) has breached an Elliott channel drawn using Elliott’s first technique. The channel is redrawn using Elliott’s second technique: the first trend line from the ends of intermediate waves (2) to (4), then a parallel copy on the end of intermediate wave (3). Intermediate wave (5) may end either midway within the channel, or about the upper edge.
Intermediate wave (4) may now be a complete regular contracting triangle lasting fourteen weeks, one longer than a Fibonacci thirteen. There is perfect alternation and excellent proportion between intermediate waves (2) and (4).
If intermediate wave (4) were to continue further as either a flat or combination, both possibilities would require another deep pullback to end at or below 2,532.69. With both On Balance Volume and the AD line making new all time highs, that possibility looks extremely unlikely.
If intermediate wave (4) were to continue further, it would now be grossly disproportionate to intermediate wave (2). Both classic technical analysis and Elliott wave analysis now suggest these alternate ideas should be discarded based upon a very low probability.
Within intermediate wave (5), no second wave correction may move beyond the start of its first wave below 2,594.62.
DAILY CHART
Click chart to enlarge.
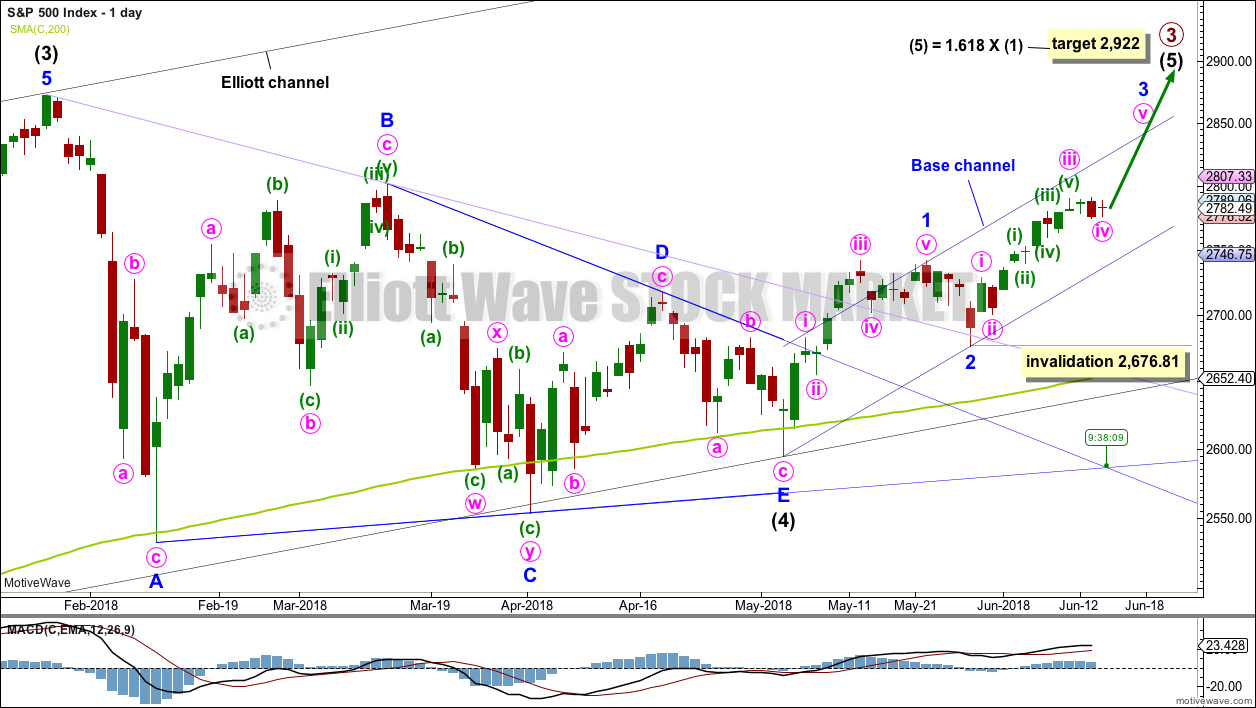
It is possible that intermediate wave (4) is a complete regular contracting triangle, the most common type of triangle. Minor wave E may have found support just below the 200 day moving average and ending reasonably short of the A-C trend line. This is the most common look for E waves of triangles.
Intermediate wave (3) exhibits no Fibonacci ratio to intermediate wave (1). It is more likely then that intermediate wave (5) may exhibit a Fibonacci ratio to either of intermediate waves (1) or (3). The most common Fibonacci ratio would be equality in length with intermediate wave (1), but in this instance that would expect a truncation. The next common Fibonacci ratio is used to calculate a target for intermediate wave (5) to end.
Price has clearly broken out above the upper triangle B-D trend line. This indicates that it should now be over if the triangle is correctly labelled.
A trend line in lilac is added to this chart. It is the same line as the upper edge of the symmetrical triangle on the daily technical analysis chart. Price has found support about this line at the last two small swing lows. The suppport at this line has reasonable technical significance now that it has been tested twice, and this line should be assumed to continue to provide support until proven otherwise.
Sometimes the point at which the triangle trend lines cross over sees a trend change. A trend change at that point may be a minor one or a major one. That point is today, and it may signal the end of minute wave iv.
Minor wave 3 may only subdivide as an impulse, and within it the subdivisions of minute waves ii and iv may show up as one or more red daily candlesticks or doji.
Within minor wave 3, no second wave correction may move beyond the start of its first wave below 2,676.81. Along the way up, any deeper corrections may now find support at the lower edge of the base channel drawn about minor waves 1 and 2. Minor wave 3 may have the power to break above the upper edge of the base channel. If it does, then that upper edge may then provide support.
HOURLY CHART
Click chart to enlarge.
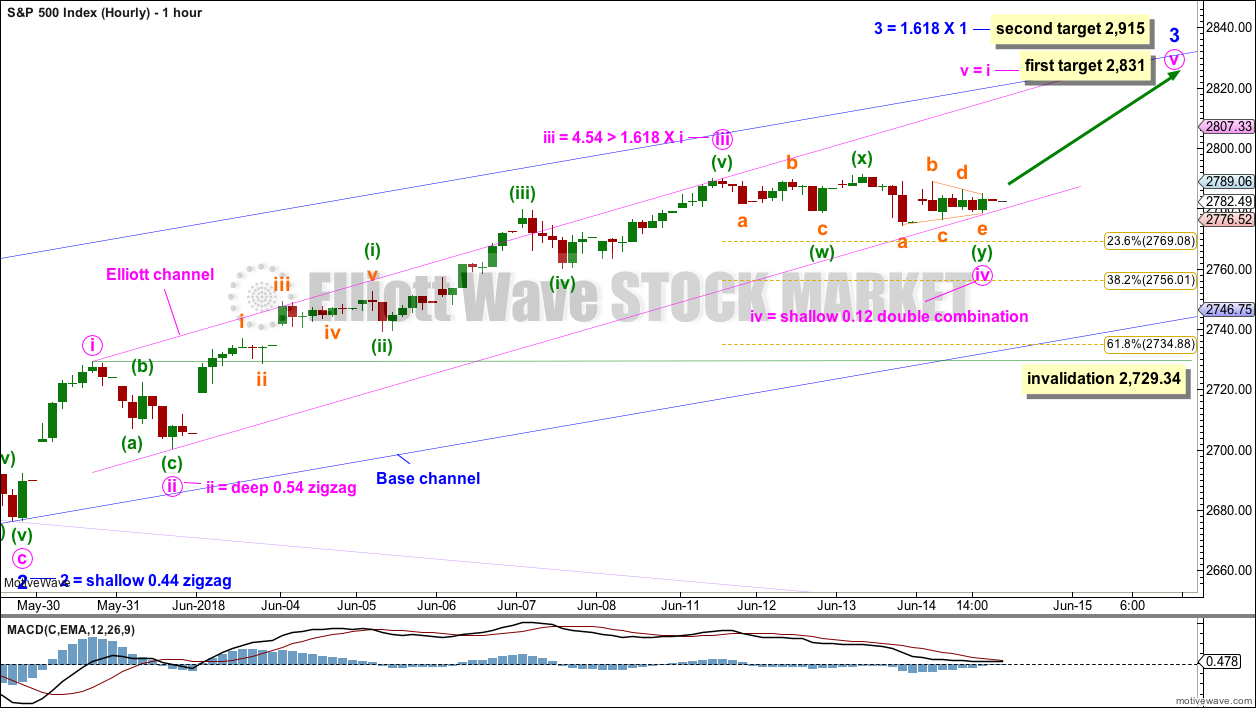
Minor wave 3 may only subdivide as an impulse, and within it all third waves at all degrees may only subdivide as impulses.
At this time, this impulse looks textbook perfect: Minute wave iii is close to 1.618 the length of minute wave i; there is perfect alternation between minute waves ii and iv; and, the whole structure fits well into an Elliott channel with a typical throw-over of the middle of the third wave for minuette wave (iii).
If this wave count is correct, then it looks most likely that price may find support here. Minute wave iv may be over at the end of today’s session; tomorrow may see minute wave v move higher.
The first target expects minute wave v to exhibit the most common Fibonacci ratio to minute wave i. The second target expects minor wave 3 to exhibit the most common Fibonacci ratio to minor wave 1.
If the structure of minute wave v may be seen as complete when price approaches the first target, then it may end there. But if price keeps rising through the first target, or if it gets there and the structure is incomplete, then the second target would be used.
Until there is a strong upwards thrust out of minute wave iv, the invalidation point must remain the same. The risk here is that minute wave iv may not be over, that it may continue lower. Minute wave iv may not move into minute wave i price territory below 2,729.34.
TECHNICAL ANALYSIS
WEEKLY CHART
Click chart to enlarge. Chart courtesy of StockCharts.com.
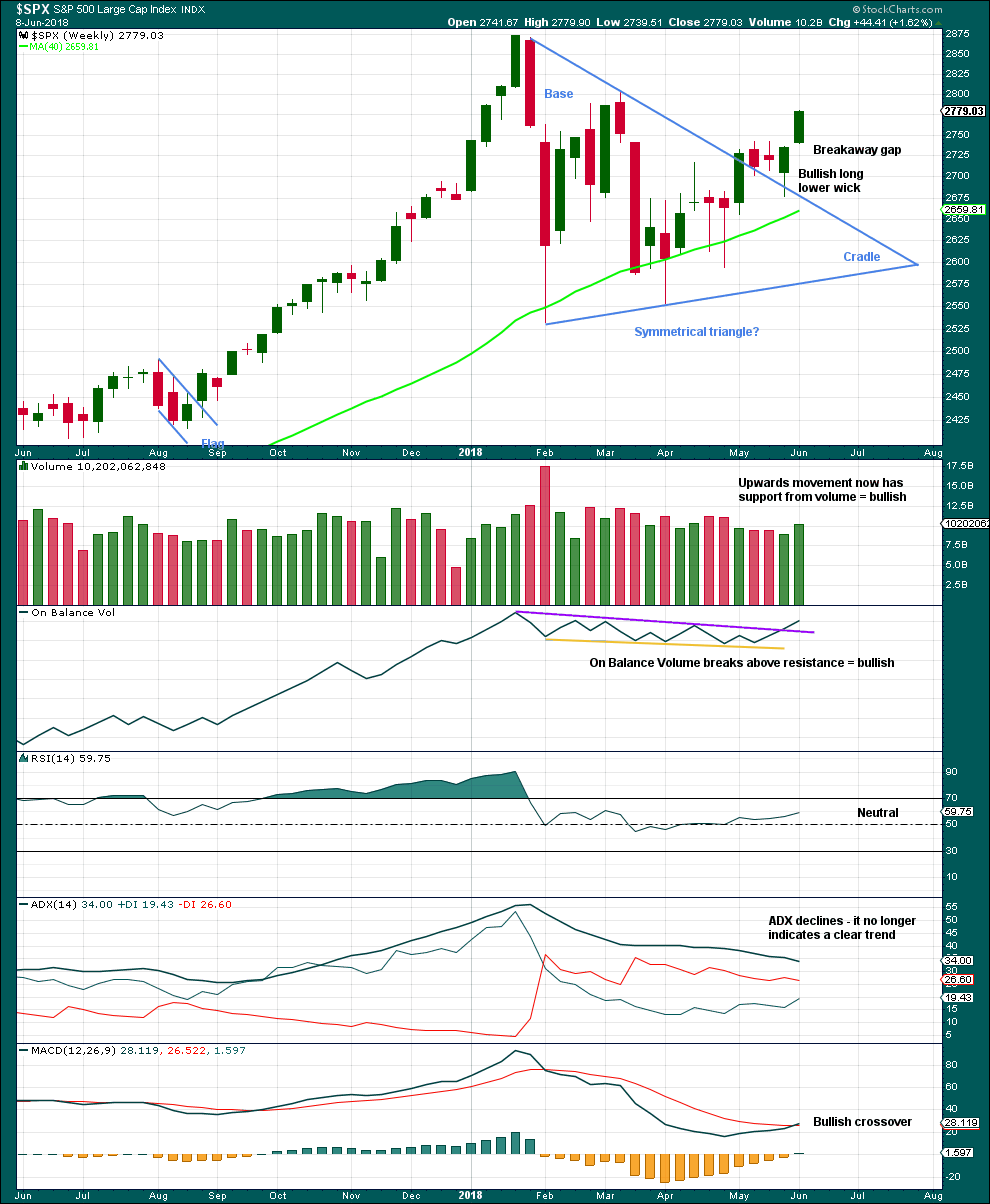
Last week closes very bullish with support from volume. The gap open last week moves up from a small three week consolidation, so it may be a breakaway gap; if this is correct, then the lower edge may provide support at 2,736.93.
The bullish signal from On Balance Volume is now very clear. If this week sees On Balance Volume move higher again, then it may make a new all time high at the weekly chart level; if it does, then that would be a very bullish signal.
Overall, this chart is fairly bullish.
DAILY CHART
Click chart to enlarge. Chart courtesy of StockCharts.com.
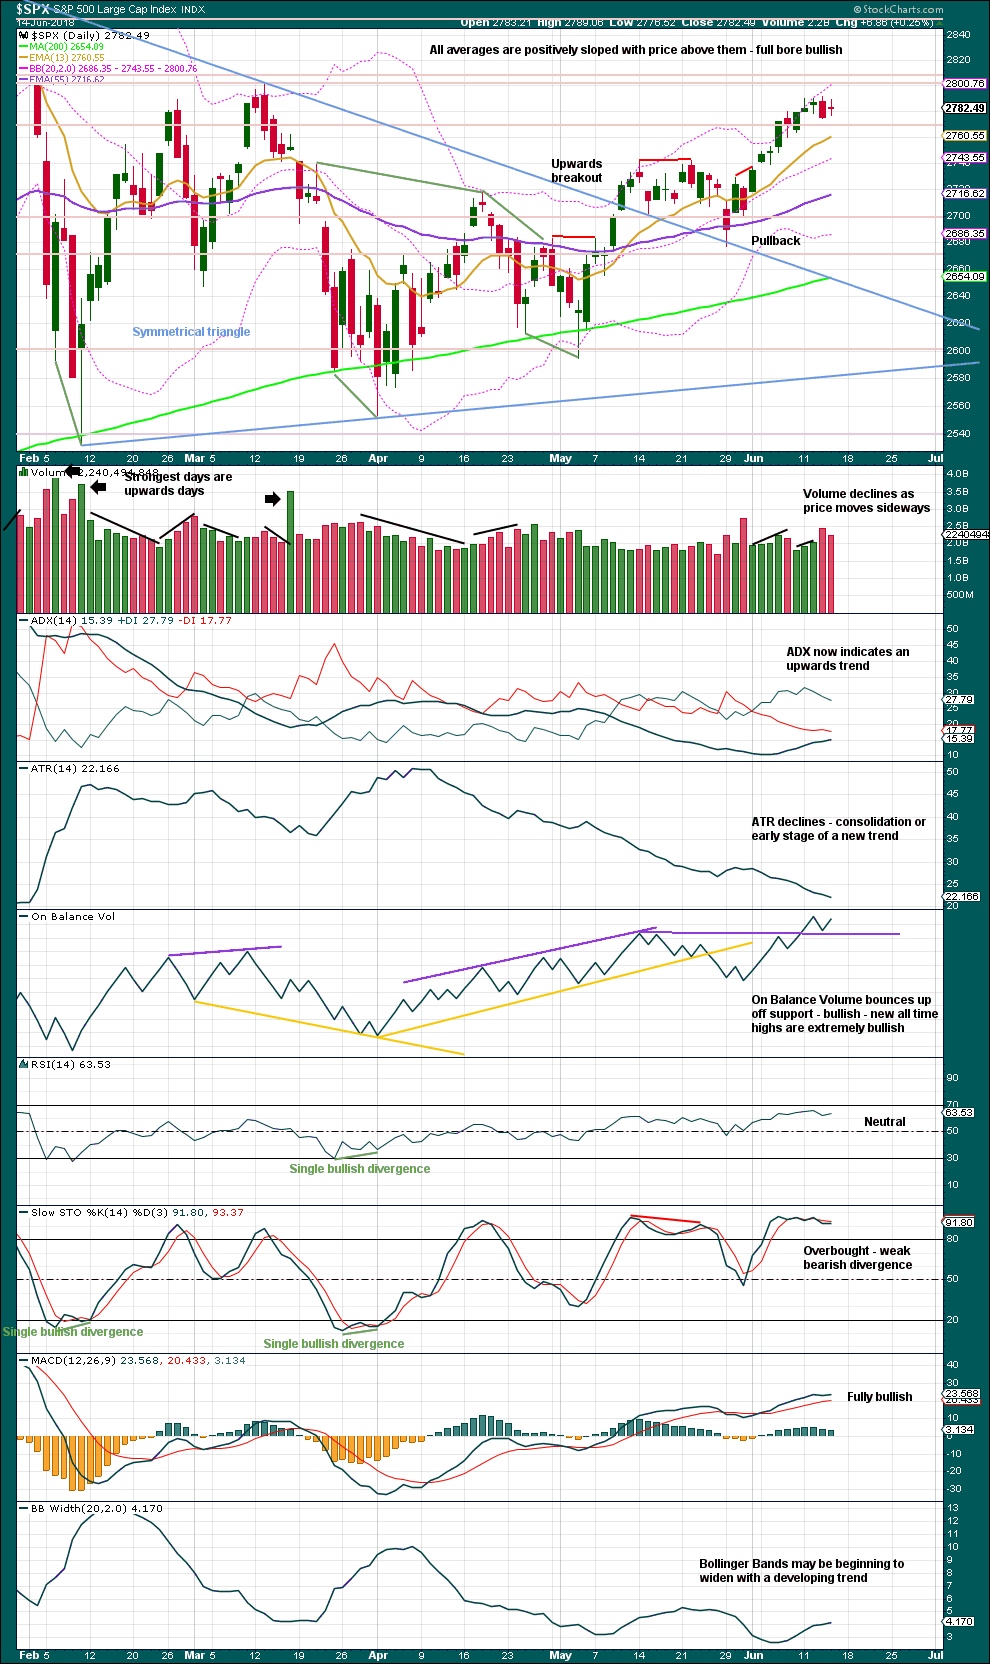
The symmetrical triangle may now be complete. The base distance is 340.18. Added to the breakout point of 2,704.54 this gives a target at 3,044.72. This is above the Elliott wave target at 2,922, so the Elliott wave target may be inadequate.
Today’s doji candlestick is neutral. A sideways day closes red, but the balance of volume is upwards. A decline in volume for a small range inside day is neutral. With On Balance Volume bouncing up off support, this chart is overall bullish. Note that ADX now indicates an upwards trend. Stochastics may remain extreme for long periods of time when this market is in a bull trend.
VOLATILITY – INVERTED VIX CHART
Click chart to enlarge. Chart courtesy of StockCharts.com. So that colour blind members are included, bearish signals
will be noted with blue and bullish signals with yellow.
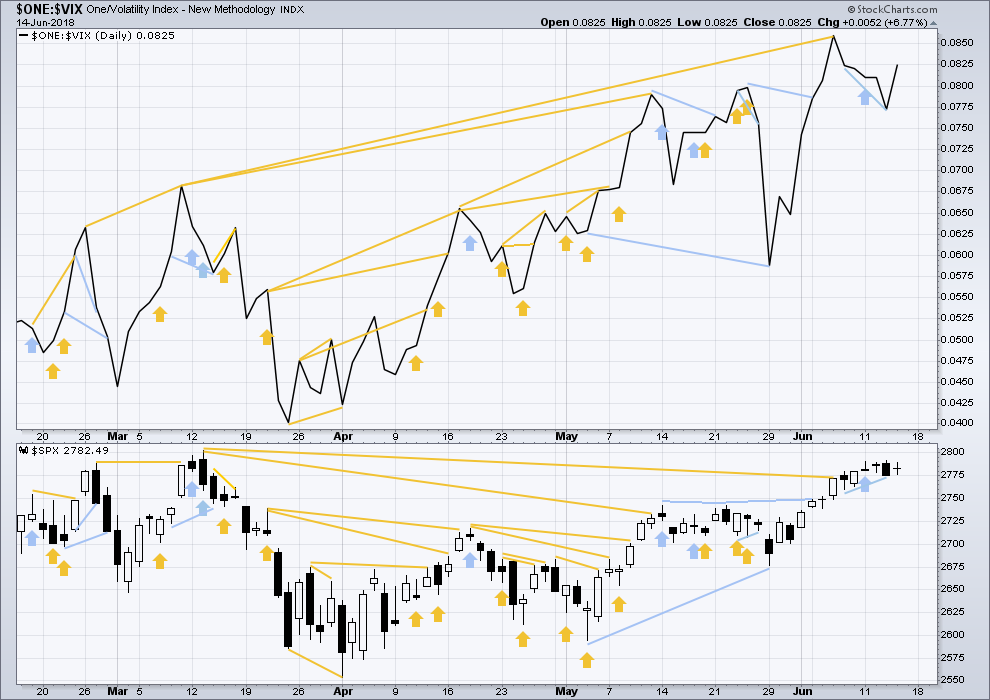
Normally, volatility should decline as price moves higher and increase as price moves lower. This means that normally inverted VIX should move in the same direction as price.
Inverted VIX has made a new high above the prior swing high of the 9th of March, but price has not made a corresponding new swing high about the same point yet. This divergence is bullish. Inverted VIX is still a little way off making a new all time high.
Bearish divergence noted in last analysis has now been followed by a small red daily candlestick. It may be resolved here, or it may need another downwards day to resolve it.
Price moved sideways. Inverted VIX moved strongly higher. The strong decline in volatility is bullish; this supports the hourly Elliott wave count.
BREADTH – AD LINE
Click chart to enlarge. Chart courtesy of StockCharts.com.
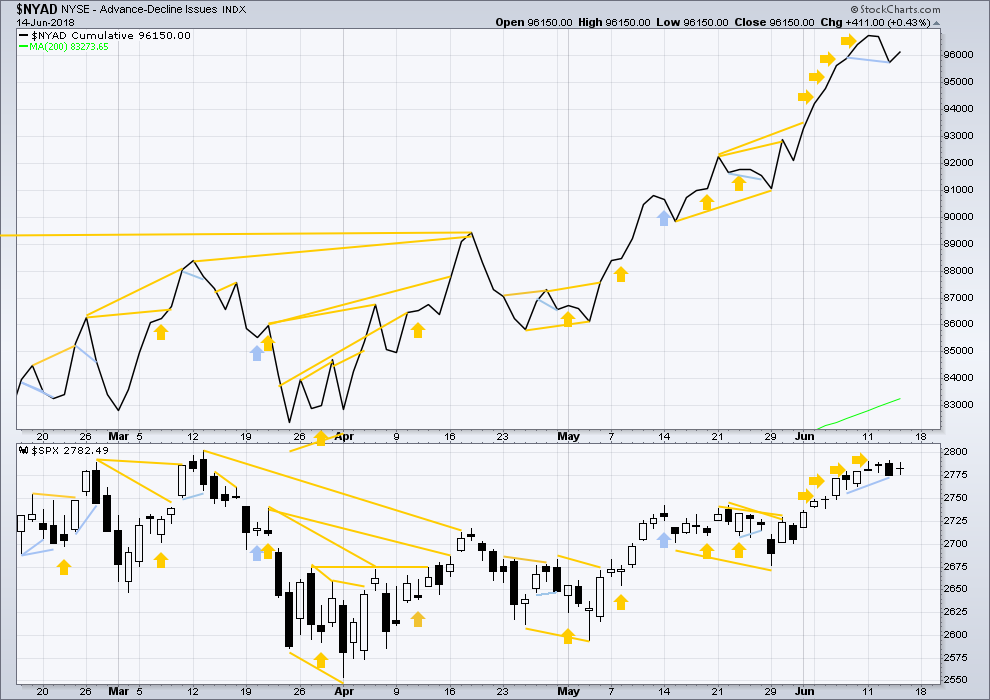
There is normally 4-6 months divergence between price and market breadth prior to a full fledged bear market. This has been so for all major bear markets within the last 90 odd years. With no longer term divergence yet at this point, any decline in price should be expected to be a pullback within an ongoing bull market and not necessarily the start of a bear market. New all time highs from the AD line means that any bear market may now be an absolute minimum of 4 months away. It may of course be a lot longer than that. My next expectation for the end of this bull market may now be October 2019.
Small caps and mid caps have both made new all time highs. It is large caps that usually lag in the latter stages of a bull market, so this perfectly fits the Elliott wave count. Expect large caps to follow to new all time highs.
Breadth should be read as a leading indicator.
Price completed an inside day today. The AD line moved slightly higher. This is slightly bullish.
Upwards movement during this last session has support from rising market breadth. This offers a little support to the hourly Elliott wave count.
Overall, the AD line still remains mostly bullish as it has made more than one new all time high this week. Price may reasonably be expected to follow through in coming weeks.
DOW THEORY
The following lows need to be exceeded for Dow Theory to confirm the end of the bull market and a change to a bear market:
DJIA: 23,360.29.
DJT: 9,806.79.
S&P500: 2,532.69.
Nasdaq: 6,630.67.
Only Nasdaq at this stage is making new all time highs. DJIA and DJT need to make new all time highs for the ongoing bull market to be confirmed.
Charts showing each prior major swing low used for Dow Theory may be seen at the end of this analysis here.
Published @ 11:45 p.m. EST.
Minute iv has moved lower. The triangle was wave B within a zigzag of minuette (y), as Peter S suspected.
Minute iv breached the channel as it was drawn using Elliott’s first technique so the channel is redrawn using his second technique. The first target is recalculated.
Minute iv is right within the price territory of the fourth wave of one lesser degree.
If SPX doesn’t hold here at the 23% (2464.5 area), then its going down to the 38% (next…no guarantee it stops there!), at 2747.7.
Big money wants to gobble up cheap SPY today.
You feeling this move up? I’m in!
That was quite a ramp there the last half hour, let’s see if the hourly holds or we get a long upper wick… Not sure how this seemingly odd day fits in with the overall count, but I’m a teensy bit wary going into next week. Some of the asian indices are lagging, and London, which has been a leader these last few months, looks fairly bearish. I am still massively bullish for the mid term (3-6 months out) but the price action here confuses me. What is the new labeling for this 4 down? Sure looks like we have a bottom now, but the labeling will have to change.
Indeed, now it looks like a minute 4 on the daily chart, and the action indicates that probably price is kicking off the minute 5. But I won’t get overly excited until price pushes up past 2804 area, and that’s not happening today. I managed to snap up an SPX call close to the lows and took it pretty close to the high of this move, and got some SPY calls for the longer term. That plus a couple of month old expiring BLUE short puts and whiles it’s a cold foggy day outside, I’m feelin’ toasty!
Mind the gap…
I agree the 2804 area is the place to watch, lots of resistance there for the time being. For the short term I am a bit worried that small caps have run a little bit to hot and we won’t see a stronger move up until there’s time for some consolidation. We had what, 7 straight days of ATHs on the AD-line? That’s quite a run. Nice job catching the lows.
AMTD (Ameritrade) is one of the hottest stocks out there, with consistent price growth for a long time. It’s done a major pullback within it’s up channel and is ON SALE NOW, BLUE LIGHT SPECIAL. I just might head over to that aisle myself…
For the fast and furious…there’s always BLUE! The volatility is insane, up to almost 200 yesterday, back down to 183 today…which means you can make (or lose) money fast. I like selling very expensive puts well below market, owning it, and selling calls up above myself. Buying low and selling high works too! Today I’ll be cashing several puts sold a month ago below market.
Now looks like we have the C of the (y) and yesterday was all B. Tricky
“Until there is a strong upwards thrust out of minute wave iv, the invalidation point must remain the same” when I saw this last night, I had to set a tight stop loss. Thanks Lara for keeping things in perspective !
You’re welcome.
I’m still holding a long position, I’m leaving my stop far away enough to give the market room to move.
I’m intending to let it hold on until the target is hit, or a trend line is breached. Whichever comes first.
GUSH looks like bottom of E. Bought some here. Set stop at 34.00 which would invalidate triangle.
I looked at GLD yesterday and I thought to myself “I don’t trust this market; every time it gives an indication of going up, it sells off again…over and over and over.” So I got out of my couple of GLD or GLD related positions for very small gains. Sho’nuf, over night tankage in gold. Meanwhile, I’m extremely pleased with the bonds/TLT/TMF/TMV action, “everything is proceeding as I have foreseen!”.
As for this little iv, don’t they always seem to go on longer, and go deeper, than you expect? That seems to have been the pattern recently, long sideways movement, “it’s over”, but it’s not. Maybe today and once clear of options expiration and SPY ex-div, the market will be free to rally into minute v finally.
GUSH might retrace to it’s 62% fibo of the Mar-May upmove, at $28.39, before turning. It’s broken the 38% fibo now 3 times so that’s not holding. The 50% might at $32, where there’s a bunch of consolidation in late April.
I removed my stop. I have very small position at about 35.50 It did take out bottom of triangle so that theory is out. I think it will retract enough to get out w/out loss and small profit (I hope). Should have waited. My position is super small so not a major problem.
Don’t tell Lara that !
Peter S is right. Acknowledging that you are trading without stops can get your membership cancelled.
I am extremely serious about risk management. It is the most important aspect of trading. Trading without stops, even on a small position, exposes the entire equity in your account to risk.
In July 2016 when the S&P broke out to a new all time high after a huge consolidation that lasted over a year, I had an alternate wave count which expected that but the main wave count at the time expected a huge fall.
On the day the market made a new all time high there were plenty of members positioned short, very few hedged. But on that day the analysis switched from bearish to very bullish. The target at that time was about 2,500.
One member was short and did not have stops, and he came into comments complaining he was losing money, and cried help for other members to try and get him out of his losing position. I am pretty sure that later on he blamed me for his losses.
Do not trade without stops, and then have unexpected losses. And if you ever do that, for goodness sake, do not blame me for it.
Let this be a final warning to you and all members. Anyone found to be ignoring my risk management rules may have their membership cancelled and they may be blacklisted, never to return.
Yes, slv went over its upper B.B. yesterday. It looks like every Friday some force out there moves slv down to about 15.5 where a lot of strikes end worthless. It amazes me how easily this market is moved. Either this force has deep pockets or they manipulate through other means. The fact that gold stocks didn’t move much yesterday when silver and gold surged was a hint. I wouldn’t be surprised if a big bank is manipulating gold and silver with the wink of our government. Maybe they are getting a cut. How I wish somebody would uncover some of the dirty deeds out there.
Every action in the market could be viewed as “manipulation”. After all, what is manipulation but active buying/selling? Yes, my take is gold in particular is under the control of some strong/big $$$, who pretty much want it right where it’s at, and not surging, so every time it gives bull signals and threatens to attract a bunch of buyers who might bid it up…they sell it hard. It’s become predictable!! I’ve heard one “famous trader” 2 or 3 times now in the last few months issue his alert, “gold is initiating a major move to the upside!” Oops.
Jerry, gold futures are manipulated to suppress the price, much in the same way VIX futures are manipulated. The difference in the whether it’s big money pushing price, or manipulation is that central banks are using printed money to achieve outcomes based on political agenda. All of the huge VAR models, Risk Parity, Target Date, etc, etc are designed to pair down equity exposition if VIX or gold rises. That is their goal. BTW literally no smart money has ever or will ever short VIX unless it’s made a 3 or 4 STD move, so compressing and slamming volatility down while it’s already low is only done with one goal in mind.
Speaking of market manipulation…..see the last 20 min
Waaaayy too slick by half… moore droopage methinks….
They already have. Bart Chilton hearings JPM busted.
So insane