
Sideways movement was expected as most likely for Wednesday’s session, which is what happened.
Summary: It looks like this small consolidation may end tomorrow about 2,769. Thereafter, the upwards trend is expected to resume.
The mid to longer term target is at 2,922 (Elliott wave) or 3,045 (classic analysis). Another multi week to multi month correction is expected at one of these targets.
The final target for this bull market to end remains at 3,616.
The Elliott wave count has good support from classic technical analysis. New all time highs this week from On Balance Volume and the AD line add strong confidence to this analysis.
Pullbacks are an opportunity to join the trend.
Always practice good risk management. Always trade with stops and invest only 1-5% of equity on any one trade.
New updates to this analysis are in bold.
The biggest picture, Grand Super Cycle analysis, is here.
Last historic analysis with monthly charts is here, video is here.
ELLIOTT WAVE COUNT
WEEKLY CHART
Click chart to enlarge.
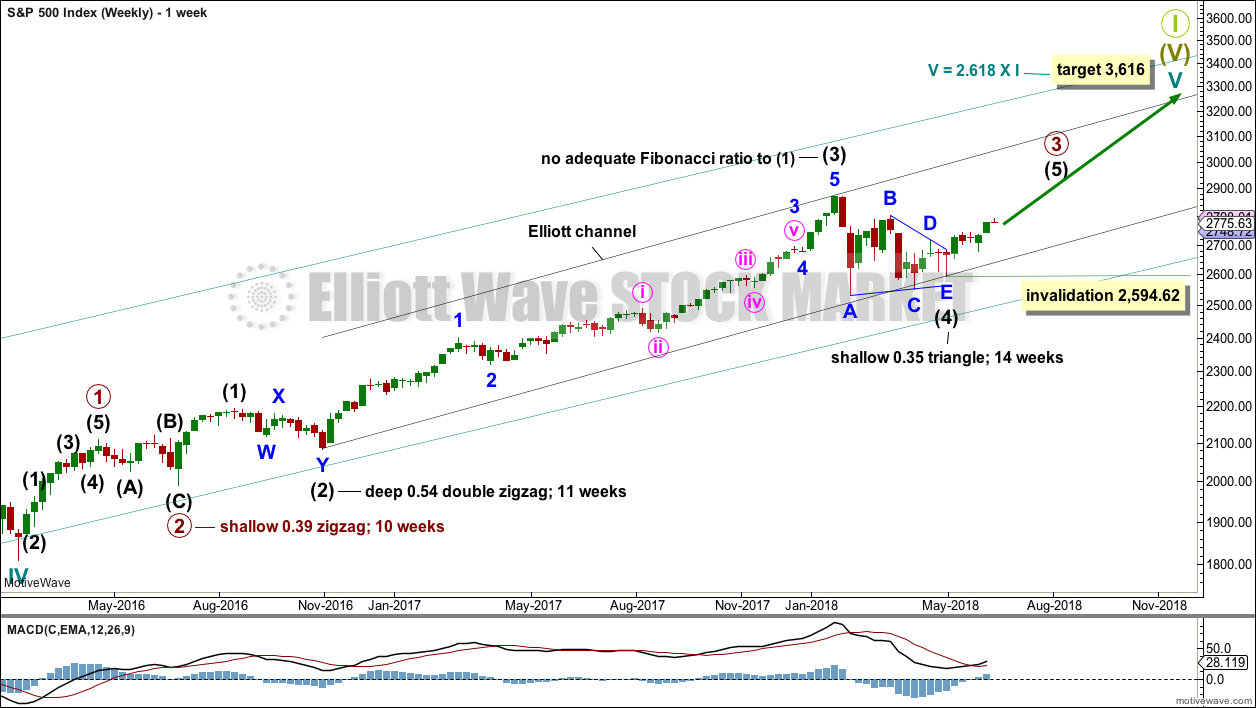
Cycle wave V must complete as a five structure, which should look clear at the weekly chart level and also now at the monthly chart level. It may only be an impulse or ending diagonal. At this stage, it is clear it is an impulse.
Within cycle wave V, the third waves at all degrees may only subdivide as impulses.
Intermediate wave (4) has breached an Elliott channel drawn using Elliott’s first technique. The channel is redrawn using Elliott’s second technique: the first trend line from the ends of intermediate waves (2) to (4), then a parallel copy on the end of intermediate wave (3). Intermediate wave (5) may end either midway within the channel, or about the upper edge.
Intermediate wave (4) may now be a complete regular contracting triangle lasting fourteen weeks, one longer than a Fibonacci thirteen. There is perfect alternation and excellent proportion between intermediate waves (2) and (4).
If intermediate wave (4) were to continue further as either a flat or combination, both possibilities would require another deep pullback to end at or below 2,532.69. With both On Balance Volume and the AD line making new all time highs, that possibility looks extremely unlikely.
If intermediate wave (4) were to continue further, it would now be grossly disproportionate to intermediate wave (2). Both classic technical analysis and Elliott wave analysis now suggest these alternate ideas should be discarded based upon a very low probability.
Within intermediate wave (5), no second wave correction may move beyond the start of its first wave below 2,594.62.
DAILY CHART
Click chart to enlarge.
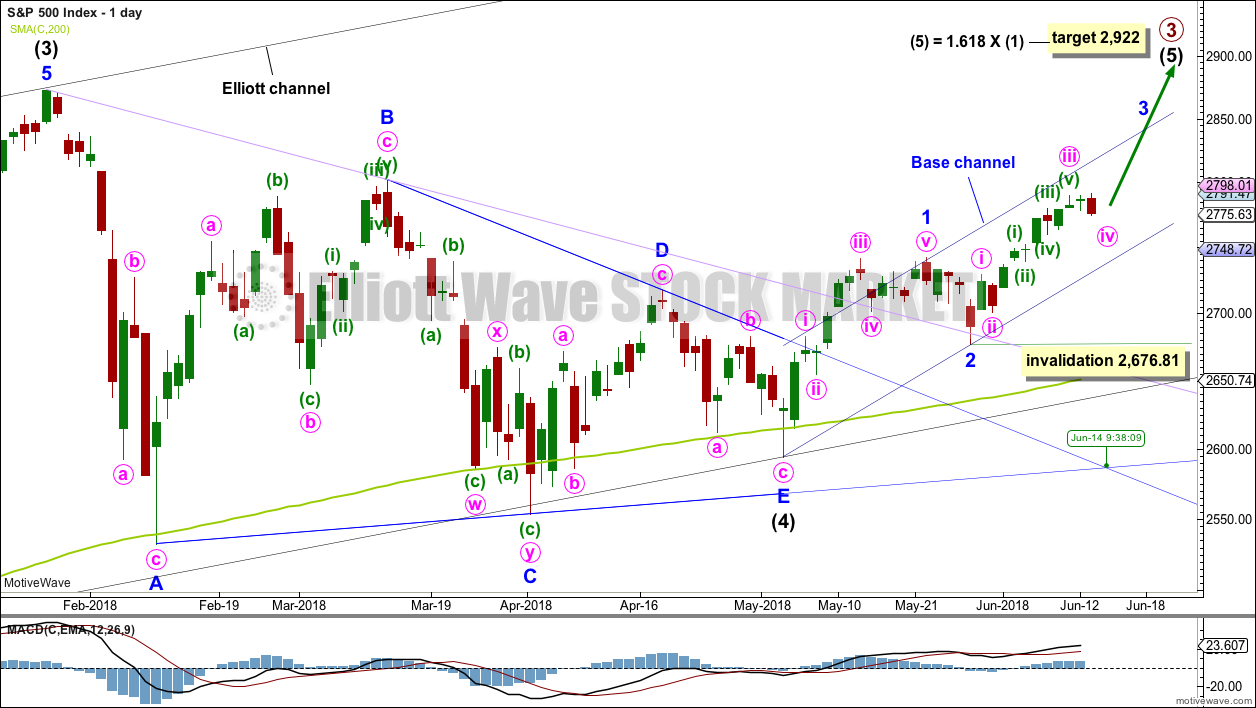
It is possible that intermediate wave (4) is a complete regular contracting triangle, the most common type of triangle. Minor wave E may have found support just below the 200 day moving average and ending reasonably short of the A-C trend line. This is the most common look for E waves of triangles.
Intermediate wave (3) exhibits no Fibonacci ratio to intermediate wave (1). It is more likely then that intermediate wave (5) may exhibit a Fibonacci ratio to either of intermediate waves (1) or (3). The most common Fibonacci ratio would be equality in length with intermediate wave (1), but in this instance that would expect a truncation. The next common Fibonacci ratio is used to calculate a target for intermediate wave (5) to end.
Price has clearly broken out above the upper triangle B-D trend line. This indicates that it should now be over if the triangle is correctly labelled.
A trend line in lilac is added to this chart. It is the same line as the upper edge of the symmetrical triangle on the daily technical analysis chart. Price has found support about this line at the last two small swing lows. The suppport at this line has reasonable technical significance now that it has been tested twice, and this line should be assumed to continue to provide support until proven otherwise.
Sometimes the point at which the triangle trend lines cross over sees a trend change. A trend change at that point may be a minor one or a major one. That point is now about the 14th of June.
Minor wave 3 may only subdivide as an impulse, and within it the subdivisions of minute waves ii and iv may show up as one or more red daily candlesticks or doji.
Within minor wave 3, no second wave correction may move beyond the start of its first wave below 2,676.81. Along the way up, any deeper corrections may now find support at the lower edge of the base channel drawn about minor waves 1 and 2. Minor wave 3 may have the power to break above the upper edge of the base channel. If it does, then that upper edge may then provide support.
HOURLY CHART
Click chart to enlarge.
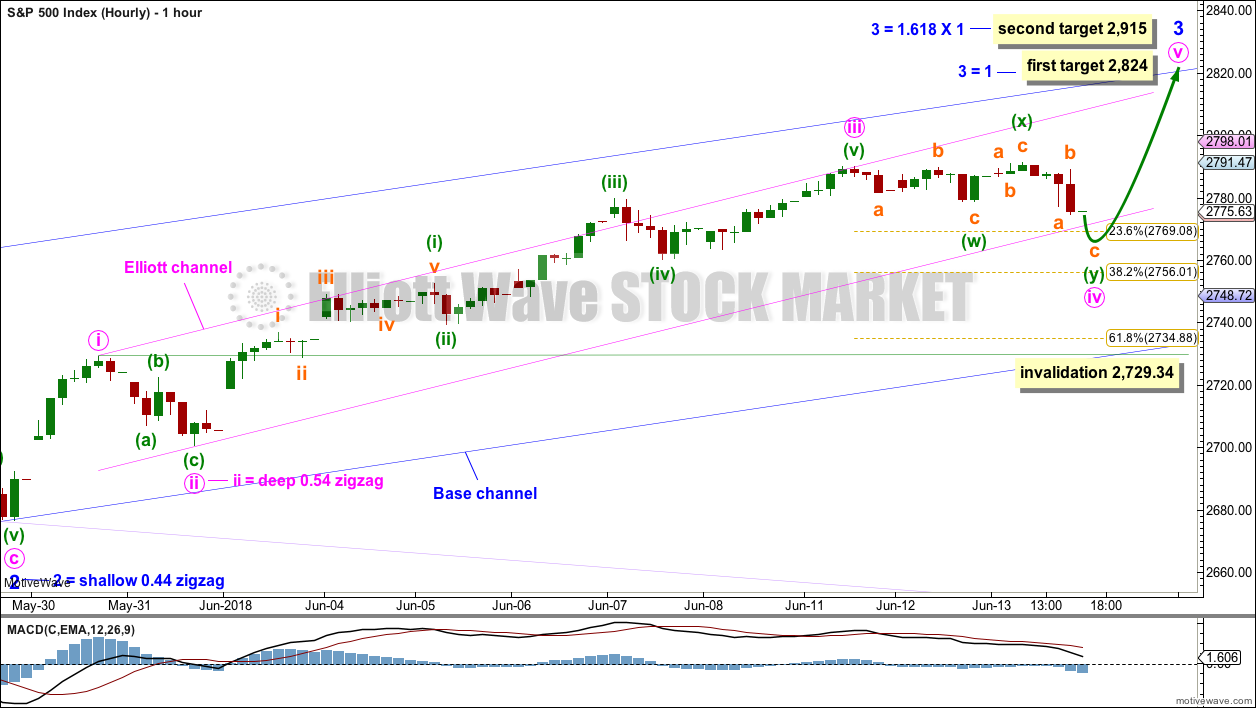
Minor wave 3 may only subdivide as an impulse, and within it all third waves at all degrees may only subdivide as impulses.
Minute wave iv may be expected to exhibit alternation with minute wave ii. Minute wave iv may most likely be shallow, and may most likely be a flat, combination or triangle. All these structures are sideways types of corrections although expanded flats can end with strong downwards waves.
Minute wave iv may end within the price territory of the fourth wave of one lesser degree; minuette wave (iv) has its range from 2,779.90 to 2,460.16. The 0.236 Fibonacci ratio at 2,769 is within this range and may be a favoured target for minute wave iv to end.
Minute wave ii was over within one session, lasting exactly a Fibonacci 8 hours. Minute wave iv now has lasted two sessions; combinations are usually more time consuming structures than zigzags.
Minute wave iv now looks most likely to be a double combination: regular flat – X – zigzag. The zigzag of minuette wave (y) may move a little lower tomorrow and may find support about the lower edge of the pink Elliott channel, or it may end closer to the 0.236 Fibonacci ratio.
Minute wave iv may not move into minute wave i price territory below 2,729.34.
TECHNICAL ANALYSIS
WEEKLY CHART
Click chart to enlarge. Chart courtesy of StockCharts.com.
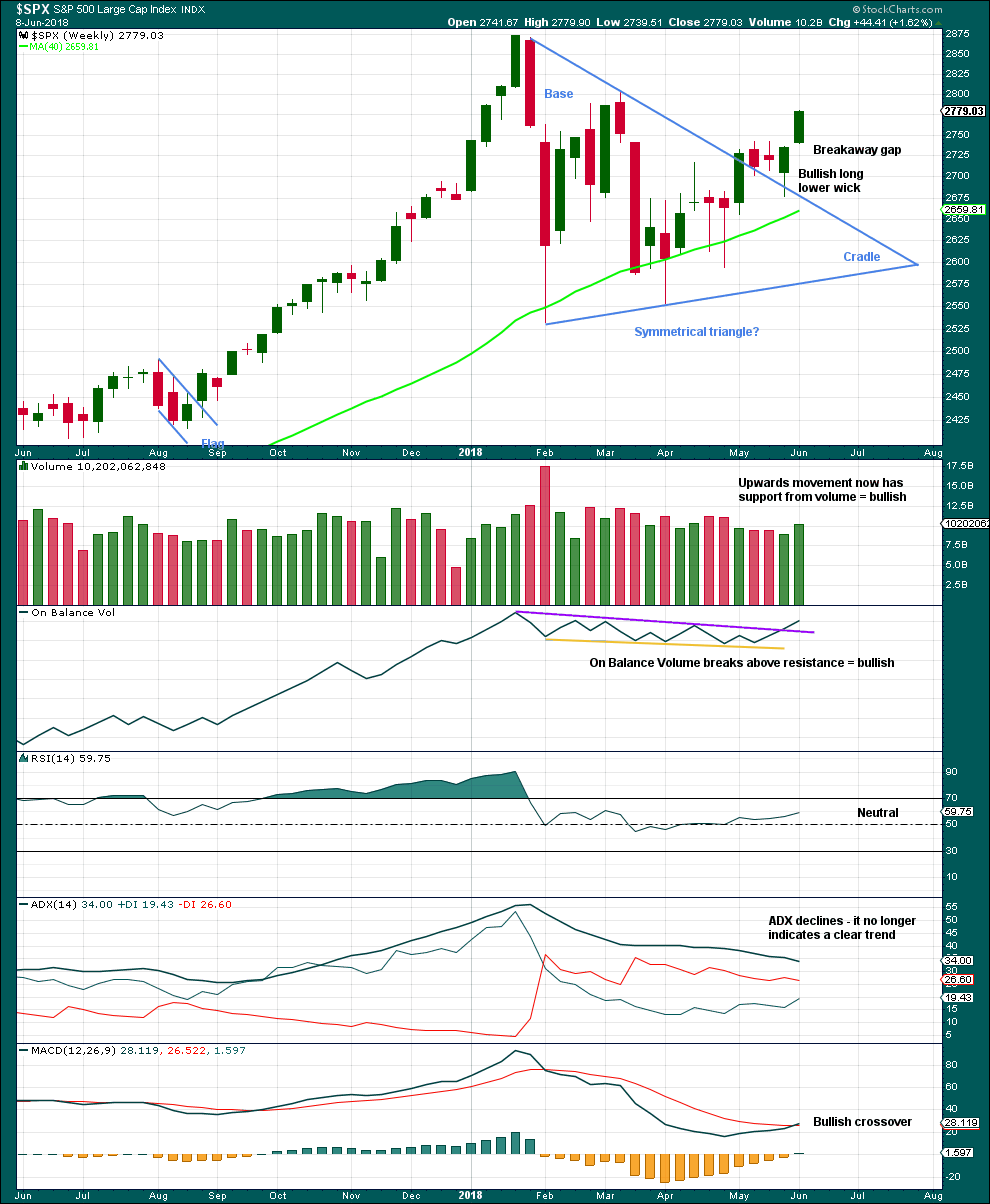
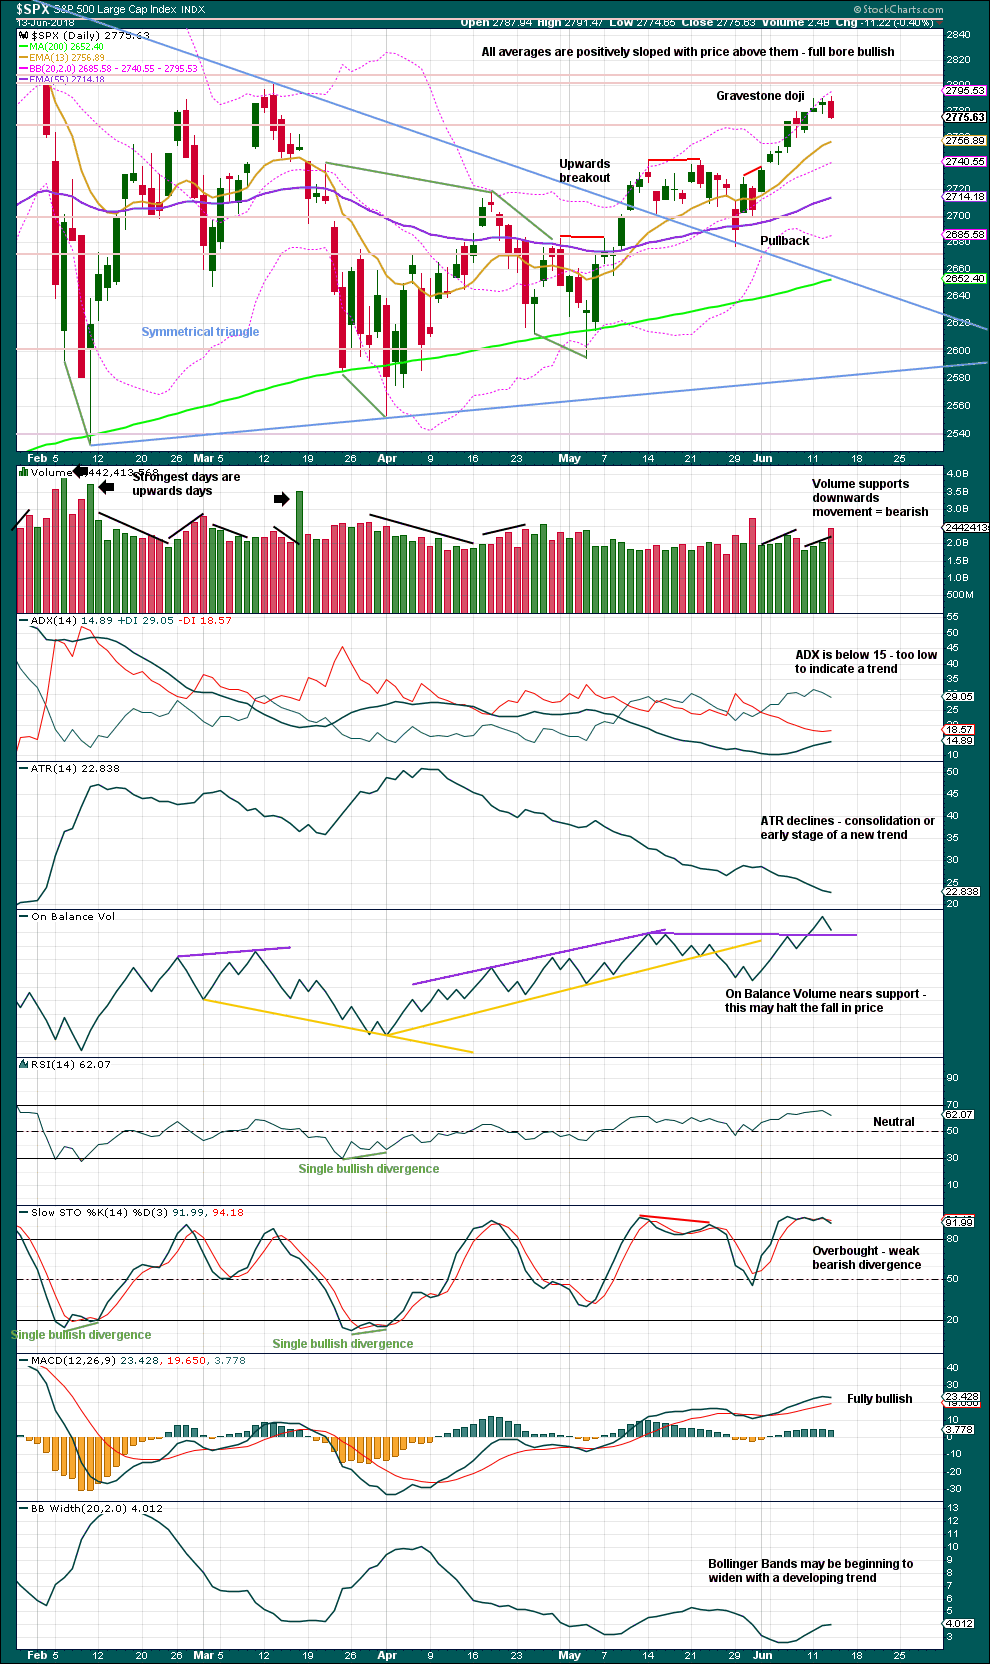
Last week closes very bullish with support from volume. The gap open last week moves up from a small three week consolidation, so it may be a breakaway gap; if this is correct, then the lower edge may provide support at 2,736.93.
The bullish signal from On Balance Volume is now very clear. If this week sees On Balance Volume move higher again, then it may make a new all time high at the weekly chart level; if it does, then that would be a very bullish signal.
Overall, this chart is fairly bullish.
DAILY CHART
Click chart to enlarge. Chart courtesy of StockCharts.com.
The symmetrical triangle may now be complete. The base distance is 340.18. Added to the breakout point of 2,704.54 this gives a target at 3,044.72. This is above the Elliott wave target at 2,922, so the Elliott wave target may be inadequate.
Today’s candlestick is bearish, and today’s volume supports downwards movement. Price is likely to move lower tomorrow. There is support very close by for On Balance Volume, but this support line does not have strong technical significance.
VOLATILITY – INVERTED VIX CHART
Click chart to enlarge. Chart courtesy of StockCharts.com. So that colour blind members are included, bearish signals
will be noted with blue and bullish signals with yellow.
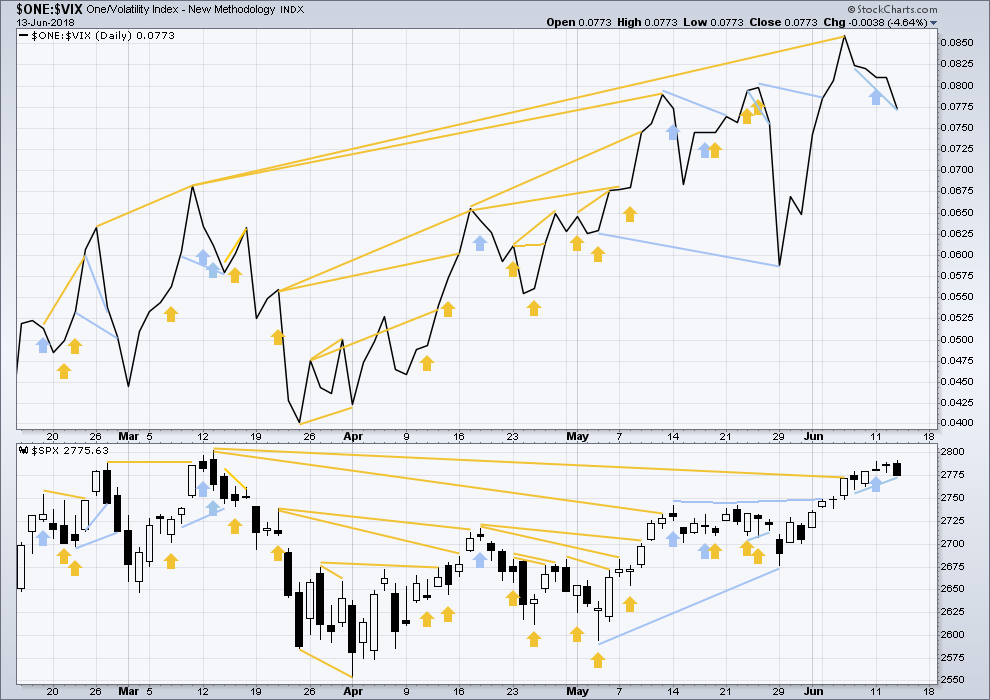
Normally, volatility should decline as price moves higher and increase as price moves lower. This means that normally inverted VIX should move in the same direction as price.
Inverted VIX has made a new high above the prior swing high of the 9th of March, but price has not made a corresponding new swing high about the same point yet. This divergence is bullish. Inverted VIX is still a little way off making a new all time high.
Inverted VIX has made a new small low below the low of the 7th of June, but price has not. This divergence is bearish. It may be resolved by one or two more downwards days.
BREADTH – AD LINE
Click chart to enlarge. Chart courtesy of StockCharts.com.
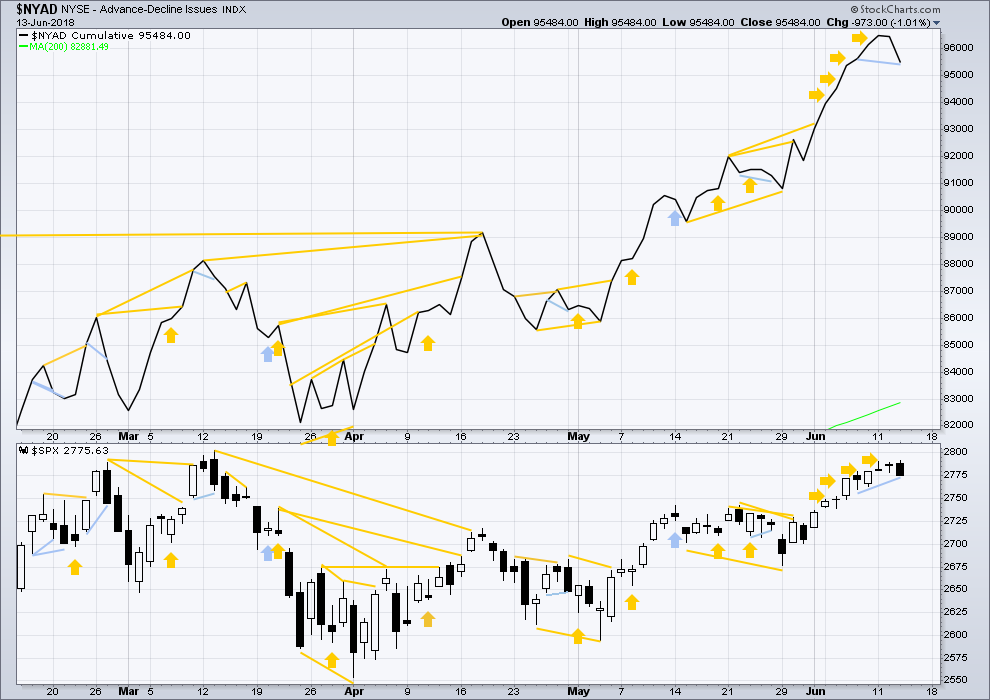
There is normally 4-6 months divergence between price and market breadth prior to a full fledged bear market. This has been so for all major bear markets within the last 90 odd years. With no longer term divergence yet at this point, any decline in price should be expected to be a pullback within an ongoing bull market and not necessarily the start of a bear market. New all time highs from the AD line means that any bear market may now be an absolute minimum of 4 months away. It may of course be a lot longer than that. My next expectation for the end of this bull market may now be October 2019.
Small caps and mid caps have both made new all time highs. It is large caps that usually lag in the latter stages of a bull market, so this perfectly fits the Elliott wave count. Expect large caps to follow to new all time highs.
Breadth should be read as a leading indicator.
The AD line has made a new small low below the low of the 7th of June, but price has not. This divergence is bearish. It may be resolved by one or two downwards days.
Overall, the AD line still remains mostly bullish as it has made more than one new all time high this week. Price may reasonably be expected to follow through in coming weeks.
DOW THEORY
The following lows need to be exceeded for Dow Theory to confirm the end of the bull market and a change to a bear market:
DJIA: 23,360.29.
DJT: 9,806.79.
S&P500: 2,532.69.
Nasdaq: 6,630.67.
Only Nasdaq at this stage is making new all time highs. DJIA and DJT need to make new all time highs for the ongoing bull market to be confirmed.
Charts showing each prior major swing low used for Dow Theory may be seen at the end of this analysis here.
Published @ 10:00 p.m. EST.
Anyone notice the big phat green candle on the USD today? Something to admire.
Makes me wonder if it’s a B wave, or a new leg of a higher trend…
more than noticed, I took uup long via a spread. I’m expecting follow through.
Good move Kevin! I was puzzled how USD exploded to the upside and the precious metal complex didn’t tank with it…
The miners actually moved up modestly with the USD exploding up. I know they’re not always correlated, but this fact really surprised me today…
Are you still bullish GLD? I know you posted about it a few days ago…
I had a bullish bias on GLD/GDX, but USD today makes more cautious on this view. Today was a classic example they’re not always correlated… but generally when I’m bullish GLD/GDX, I prefer to be bearish USD simultaneously. But I’m not bearish USD
Good morning everybody.
I think Peter S is onto it, minuette (y) looks like it’s turned into a small triangle.
So far price is finding support around about the lower edge of the pink Elliott channel. If the triangle is correct then that should continue.
If this count is correct then short term we should be expecting a sharp upwards thrust out of the triangle to new highs above 2,790.21.
But wait… according to EW rules, can we truly have a triangle as the terminal structure of a combination?
Yes, I believe for fourth waves it is very common for a terminal thrust out of a triangle to complete a 5th wave move.
Yes. A triangle may be the second structure in a double combination.
From Frost and Prechter, page 91:
“A ‘double three’ flat combination comprises (in order) a zigzag an a flat, a flat and a zigzag, a flat and a flat, a zigzag and a triangle, or a flat and a triangle.”
Thank you for the clarification, Lara!
Yes indeed tiddies and bundlemen! (all due respect to Mr. Lewis)
Deploying massive SPX 279/280 bull put credit spread three weeks out
All Aboard! 😉
Lara Rocks!!
well…. I do not know what tiddies and bundlemen are…
but thanks Verne!
An interesting scene from C.S. Lewis’ “That Hideous Strength”. The speaker was apparently suffering from temporary cognitive linguistic dissonance when he addressed the gathering…!
Should have been “Ladies and Gentlemen!”
can this triangle also be the B of the (y) and still have a C still to go?
absolutely it could be.
until we get a convincing upwards thrust out of this consolidation, I’ll leave the invalidation point at the high of minute wave i.
Or this ?
Ha ha! Exactly! (well, almost, you need to place your labels more accurately which would lead to D over at the last small high, and E only beginning)
That’s what I thought when I looked at the 5 minute chart.
Yep! 🙂
SPX on the hourly will polarity invert to “down” if there’s a break back below yesterday’s low at 2774.65. That could spell deeper sell off trouble. Hard to see it coming given that the monsters or tech are up a combined 1.1% and the NQ is up 1.1%. But….??? Bonds are up, XLF is headed back down, and SPX just isn’t going too far IMO without finance participation. I’m cautious until SPX finally breaks up and through all the 2800 area resistance. It certainly appears that sector rotation back into tech is in full swing. But not finance yet.
Not sure if this follows the rules.
Nope. The triangle breaches the rules for a contracting triangle: C may not move beyond the end of A, E may not move beyond the end of C.
Did Y turn into a triangle?
We hit Lara’s 23% on /ES (SP500 futures) last night and had a strong reversal from there. When we hit these targets during non-working hours, how do you feel about that being completion? Do we still generally expect to hit 2769 during market hours?
that’s a good question and one I get asked regularly
the data I am using from BarChart is NY session only
and so the wave count is using only NY session, and so it is only the candlesticks within the NY session that have to fit the wave count
what happens after hours does not affect the wave count
(your comment was waiting in moderation, now it’s approved all your future comments will be automatically approved)
The minute iv is looking much more legitimate now. I’m not going to be too surprised if the tightest channel line gets busted to the downside, and price drops into the range of the prior minuette iv, which has a low around 2764. And price can go a lot lower than that before being “required” to turn back up (2729). Again, I suspect big money drives the market down tomorrow, to accumulate for a hold on Friday. It should be an an excellent “get long/get longer” opportunity.
Here’s TLT, first a weekly showing an interesting repeating (??) pattern. And then the hourly, showing were I’m looking for turns back up based on fibo’s and symmetric move projections, in order to get long to trade TLT to the high side of the “next quadrangle” on the weekly. Note the precise pattern repeat itself inside the two ellipses. Doesn’t mean the next move will be the same as last time…but it appears indicative to me, enough to support taking long set ups and triggers.
A four hour chart of TLT, with symmetric projections and the key fibo’s. Price is bouncing around now between the 38% and 62%.
It’s about to polarity reverse to the long side and break the slowest of the recent down trend speed lines. Both together = buy trigger for me. I’ll use TMF (3x leverage).
Kevin, we’re you the one with the $45 million options bet on increasing treasuries that expires in August???
I think that was Lara!
Could always be Verne!!
So sad, no, was not me. I’m placing my bets on Verne here.
Probably going back to around 150. Adjusted long term account two weeks ago with TMV exit. Some heavy hitters just went long bonds to tune of 75 mega bucks. 45 was initial installment. 🙂
Yes, methinks we will see 2.85ish at least on the 10y. Man getting pounded today on VIX Verne, good thing I have a war chest to buy more, lol extending maturities to August on new buys. Also. opening 9 over 7 UVXY bull put spread(not trading advice) .
Yes indeed! The assault is more ferocious than I have seen in quite some time. I also moved “perpetual spreads” out a few more weeks. I keep buying back the short leg of a 11/13 bull put spread every time price approaches 13, and re-selling 13 strike puts as it approaches 12. Holding the 11 puts allows me to lever up on each succesive short sale. Turn around time about every four days. So far so good. Please keep it quiet! 🙂
Nice, lock and load!!!
Yeah, Baby!!
We LOVE BB!