
Last analysis expected a brief shallow pullback. A small range day, closing as a doji candlestick, perfectly fits this expectation with a slightly lower high and slightly lower low.
Summary: It looks slightly more likely that this small pullback may continue sideways for another one to two days. But if tomorrow sees strong upwards movement, it may have been over at today’s low.
If it continues sideways, then it may end about 2,769.
The mid to longer term target is at 2,922 (Elliott wave) or 3,045 (classic analysis). Another multi week to multi month correction is expected at one of these targets.
The final target for this bull market to end remains at 3,616.
The Elliott wave count has good support from classic technical analysis. New all time highs today from On Balance Volume and the AD line add strong confidence to this analysis.
Pullbacks are an opportunity to join the trend. An upwards trend is expected to be developing. It is possible that upwards movement may show a further increase in momentum over the next several days.
Always practice good risk management. Always trade with stops and invest only 1-5% of equity on any one trade.
New updates to this analysis are in bold.
The biggest picture, Grand Super Cycle analysis, is here.
Last historic analysis with monthly charts is here, video is here.
ELLIOTT WAVE COUNT
WEEKLY CHART
Click chart to enlarge.
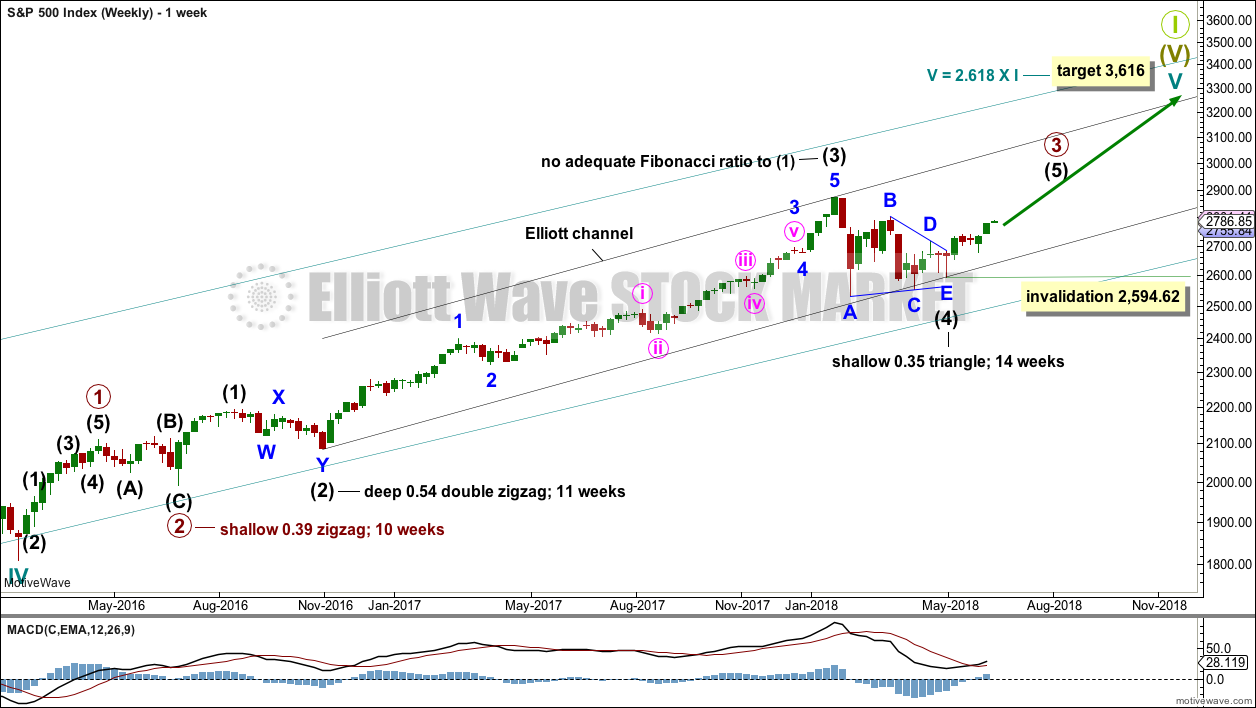
Cycle wave V must complete as a five structure, which should look clear at the weekly chart level and also now at the monthly chart level. It may only be an impulse or ending diagonal. At this stage, it is clear it is an impulse.
Within cycle wave V, the third waves at all degrees may only subdivide as impulses.
Intermediate wave (4) has breached an Elliott channel drawn using Elliott’s first technique. The channel is redrawn using Elliott’s second technique: the first trend line from the ends of intermediate waves (2) to (4), then a parallel copy on the end of intermediate wave (3). Intermediate wave (5) may end either midway within the channel, or about the upper edge.
Intermediate wave (4) may now be a complete regular contracting triangle lasting fourteen weeks, one longer than a Fibonacci thirteen. There is perfect alternation and excellent proportion between intermediate waves (2) and (4).
If intermediate wave (4) were to continue further as either a flat or combination, both possibilities would require another deep pullback to end at or below 2,532.69. With both On Balance Volume and the AD line making new all time highs, that possibility looks extremely unlikely.
If intermediate wave (4) were to continue further, it would now be grossly disproportionate to intermediate wave (2). Both classic technical analysis and Elliott wave analysis now suggest these alternate ideas should be discarded based upon a very low probability.
Within intermediate wave (5), no second wave correction may move beyond the start of its first wave below 2,594.62.
DAILY CHART
Click chart to enlarge.
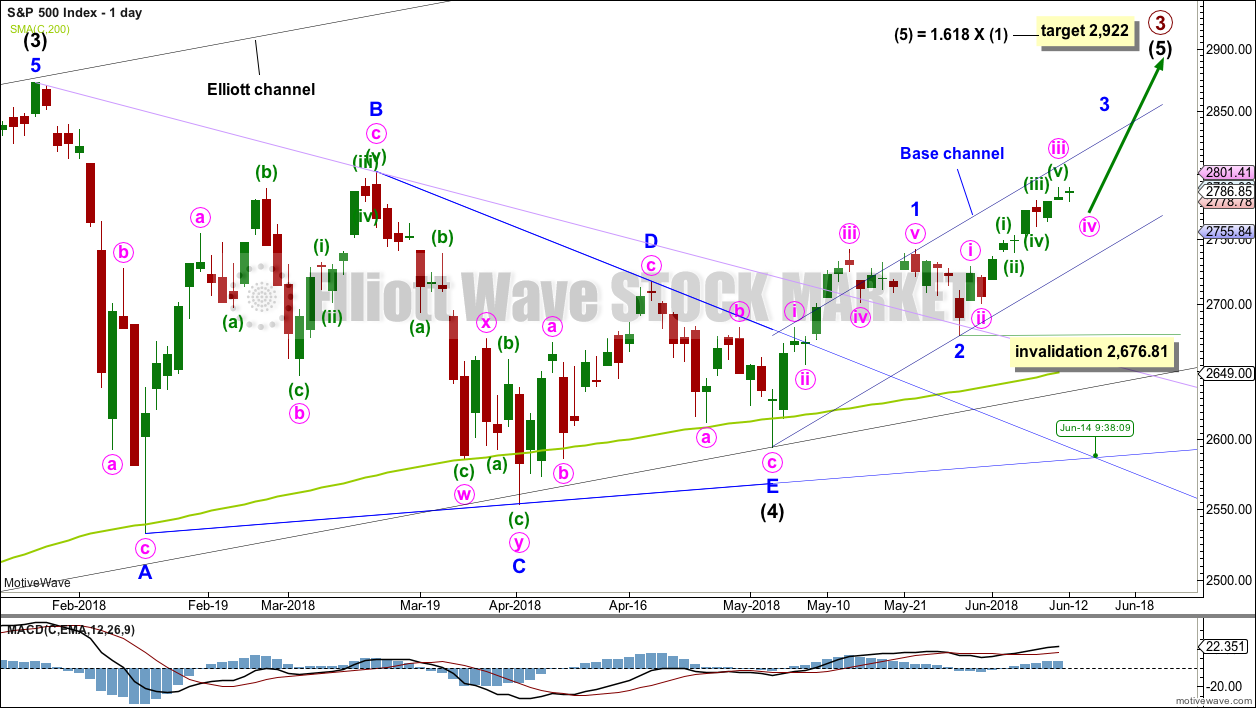
It is possible that intermediate wave (4) is a complete regular contracting triangle, the most common type of triangle. Minor wave E may have found support just below the 200 day moving average and ending reasonably short of the A-C trend line. This is the most common look for E waves of triangles.
Intermediate wave (3) exhibits no Fibonacci ratio to intermediate wave (1). It is more likely then that intermediate wave (5) may exhibit a Fibonacci ratio to either of intermediate waves (1) or (3). The most common Fibonacci ratio would be equality in length with intermediate wave (1), but in this instance that would expect a truncation. The next common Fibonacci ratio is used to calculate a target for intermediate wave (5) to end.
Price has clearly broken out above the upper triangle B-D trend line. This indicates that it should now be over if the triangle is correctly labelled.
A trend line in lilac is added to this chart. It is the same line as the upper edge of the symmetrical triangle on the daily technical analysis chart. Price has found support about this line at the last two small swing lows. The suppport at this line has reasonable technical significance now that it has been tested twice, and this line should be assumed to continue to provide support until proven otherwise.
Sometimes the point at which the triangle trend lines cross over sees a trend change. A trend change at that point may be a minor one or a major one. That point is now about the 14th of June.
Minor wave 3 may only subdivide as an impulse, and within it the subdivisions of minute waves ii and iv may show up as one or more red daily candlesticks or doji.
Within minor wave 3, no second wave correction may move beyond the start of its first wave below 2,676.81. Along the way up, any deeper corrections may now find support at the lower edge of the base channel drawn about minor waves 1 and 2. Minor wave 3 may have the power to break above the upper edge of the base channel. If it does, then that upper edge may then provide support.
HOURLY CHART
Click chart to enlarge.
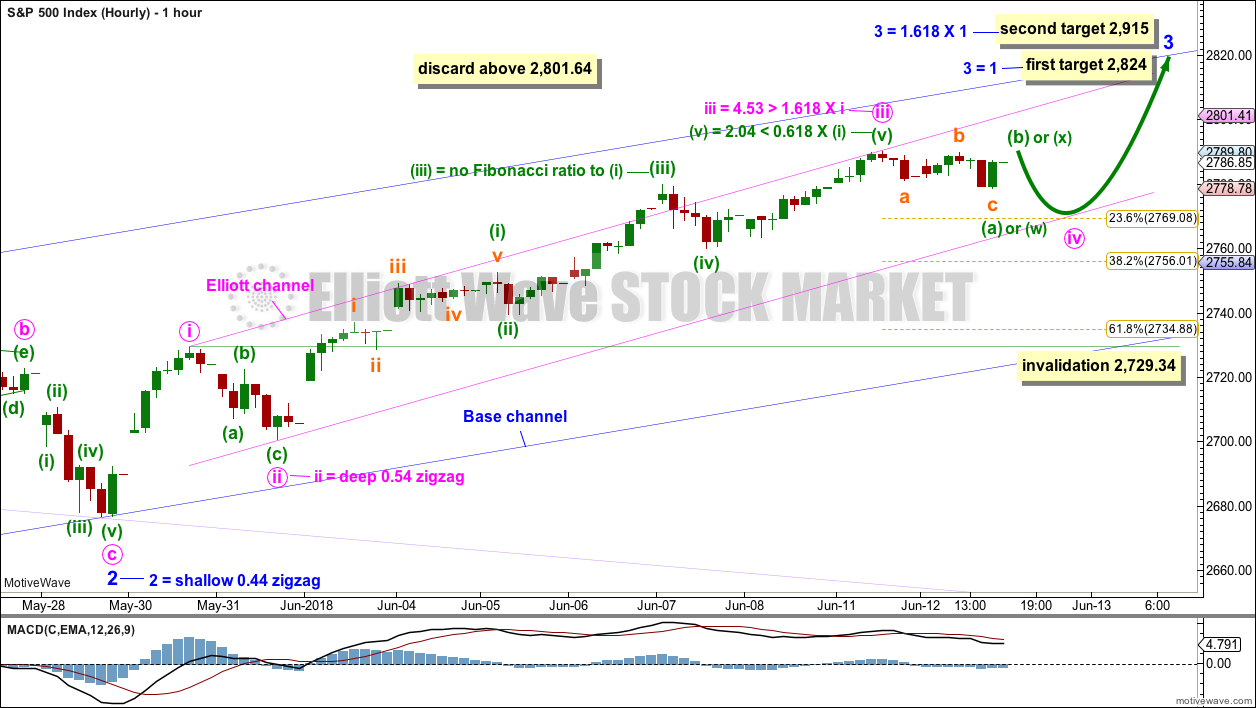
Minor wave 3 may only subdivide as an impulse, and within it all third waves at all degrees may only subdivide as impulses.
Minute wave iii may be over.
Minute wave iv may be expected to exhibit alternation with minute wave ii. Minute wave iv may most likely be shallow, and may most likely be a flat, combination or triangle. All these structures are sideways types of corrections although expanded flats can end with strong downwards waves.
Minute wave iv may end within the price territory of the fourth wave of one lesser degree; minuette wave (iv) has its range from 2,779.90 to 2,460.16. The 0.236 Fibonacci ratio at 2,769 is within this range and may be a favoured target for minute wave iv to end.
Minute wave ii was over within one session, lasting exactly a Fibonacci 8 hours. Minute wave iv may also be as brief, but it may be a little longer as sideways corrections do tend to be longer lasting than zigzags.
If minute wave iv is a flat correction, then within it minuette wave (a) may have been over at today’s low. Minuette wave (b) may move a little higher tomorrow to reach a minimum 0.9 length of minuette wave (a) at 2,789.07. The common range for minuette wave (b) within a flat correction is from 1 to 1.38 the length of minuette wave (a), from 2,790.21 to 2,794.55. When minuette wave (b) completes as a three wave structure, then minuette wave (c) would be likely to make at least a slight new low below the end of minuette wave (a) at 2,778.78 to avoid a truncation.
If minute wave iv is a combination, then within it minuette wave (w) may be over at today’s low as a regular flat correction. Minuette wave (x) may be over at today’s high, or it may move a little higher. There is no minimum nor maximum requirement for X waves within combinations; there is only an expectation that they are usually fairly deep. The second structure in a double may be a zigzag (most likely) or a triangle (this is uncommon) for minuette wave (y). Minuette wave (y) may end about the same level as minuette wave (w) at 2,778.78, so that the whole structure takes up time and moves price sideways. It may complete in one or two more sessions.
If minute wave iv is a triangle, then within it minuette wave (a) may be over at today’s low and minuette wave (b) may be over at today’s high. But if minuette wave (b) is not over and moves higher, then it may make a new high above the start of minuette wave (a) at 2,790.21 as in a running triangle. Note that there is no minimum nor maximum length for B waves within triangles. Minuette wave (c) of a contracting or barrier triangle may not move beyond the end of minuette wave (a) below 2,778.78. Sideways movement in an ever decreasing range may continue for another one or two sessions.
The pink channel is redrawn using Elliott’s first technique. In the first instance, look for minute wave iv to find support about the lower edge, if it gets that low.
Minute wave iv may not move into minute wave i price territory below 2,729.34.
Today this main hourly wave count is judged to be only slightly more likely than the alternate below.
ALTERNATE HOURLY CHART
Click chart to enlarge.
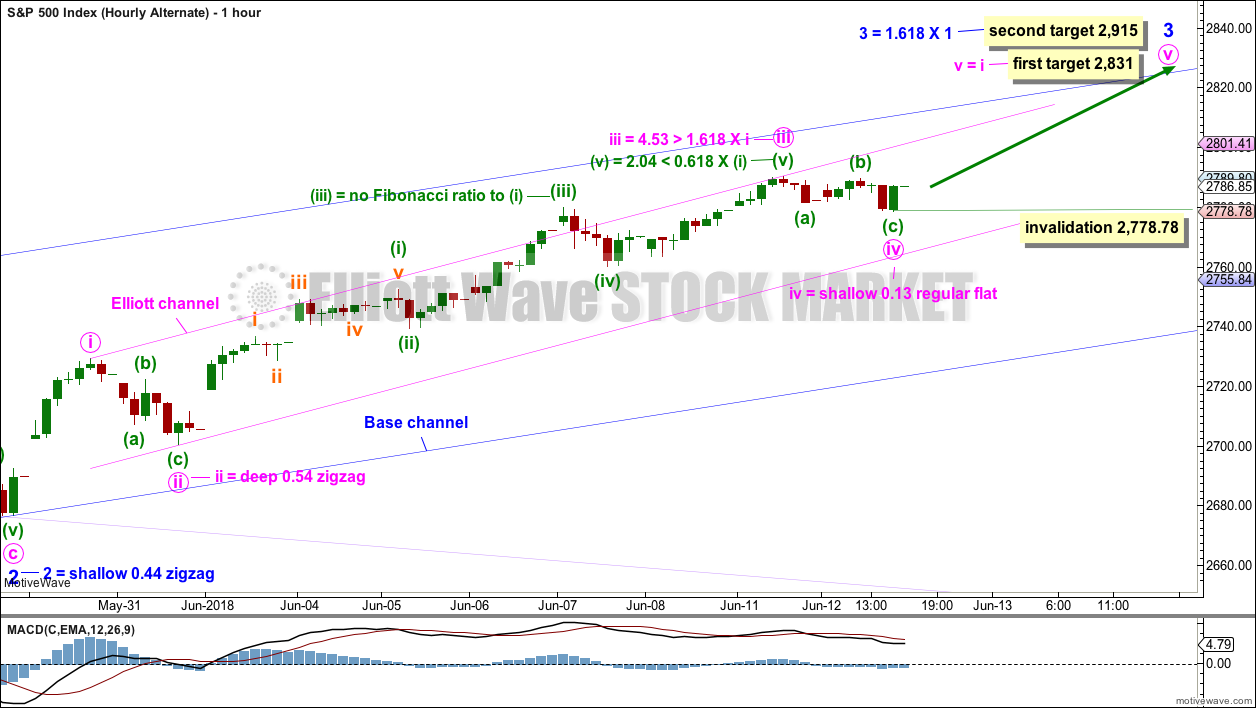
If the degree of labelling within today’s movement is moved up one degree, minute wave iv may be over at the low for today’s session as a regular flat correction.
This wave count has perfect alternation between minute waves ii and iv.
The first target for minor wave 3 to end is changed for this wave count. It expects to see the most common Fibonacci ratio for minute wave v.
This wave count has support today from a new all time high on On Balance Volume at the daily chart level, but a flat inverted VIX and a very slight decline for the AD line suggest it may be slightly less likely than the main wave count.
Within minute wave v, no second wave correction may move beyond the start of its first wave below 2,778.78.
TECHNICAL ANALYSIS
WEEKLY CHART
Click chart to enlarge. Chart courtesy of StockCharts.com.
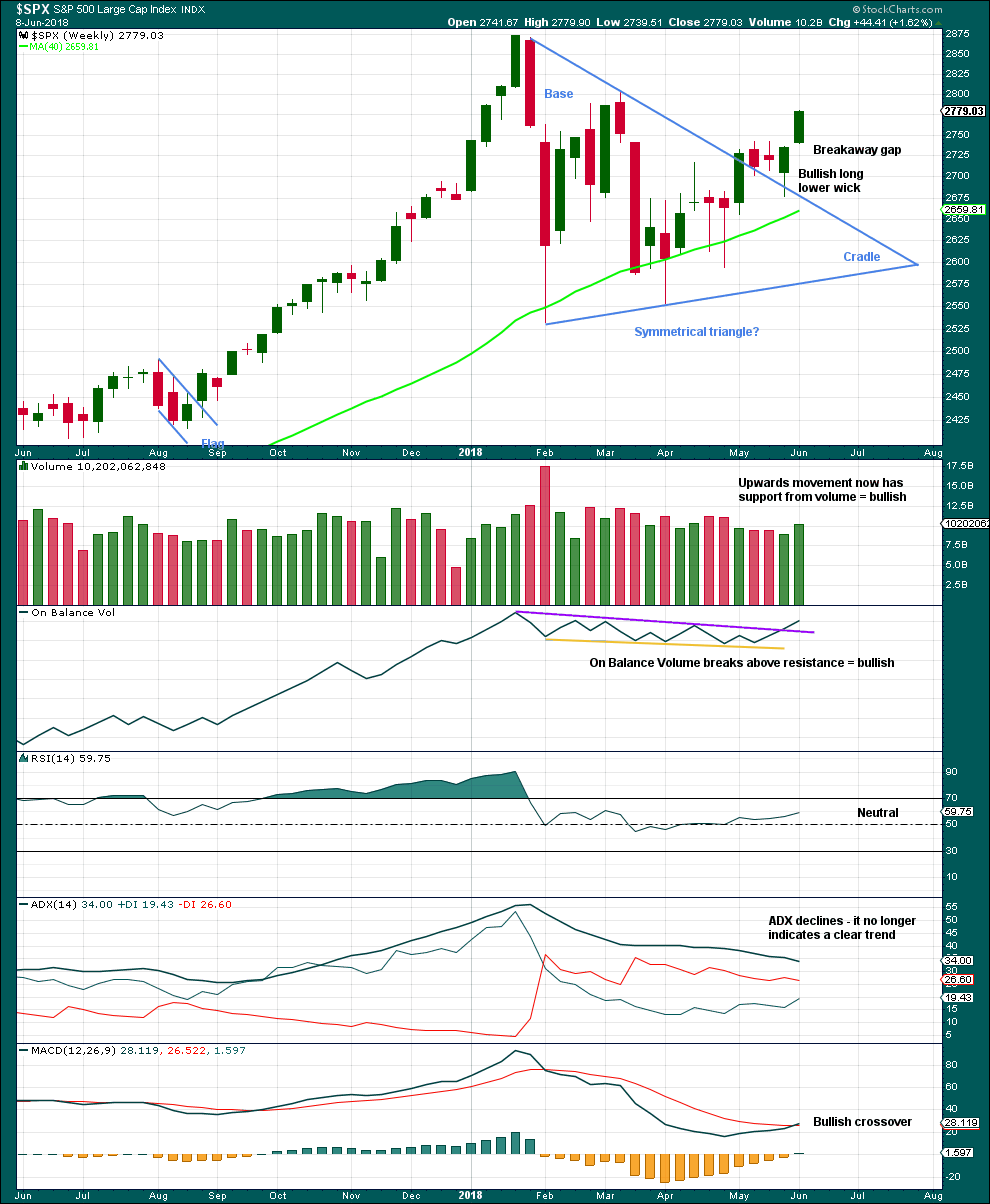
Last week closes very bullish with support from volume. The gap open last week moves up from a small three week consolidation, so it may be a breakaway gap; if this is correct, then the lower edge may provide support at 2,736.93.
The bullish signal from On Balance Volume is now very clear. If this week sees On Balance Volume move higher again, then it may make a new all time high at the weekly chart level; if it does, then that would be a very bullish signal.
Overall, this chart is fairly bullish.
DAILY CHART
Click chart to enlarge. Chart courtesy of StockCharts.com.
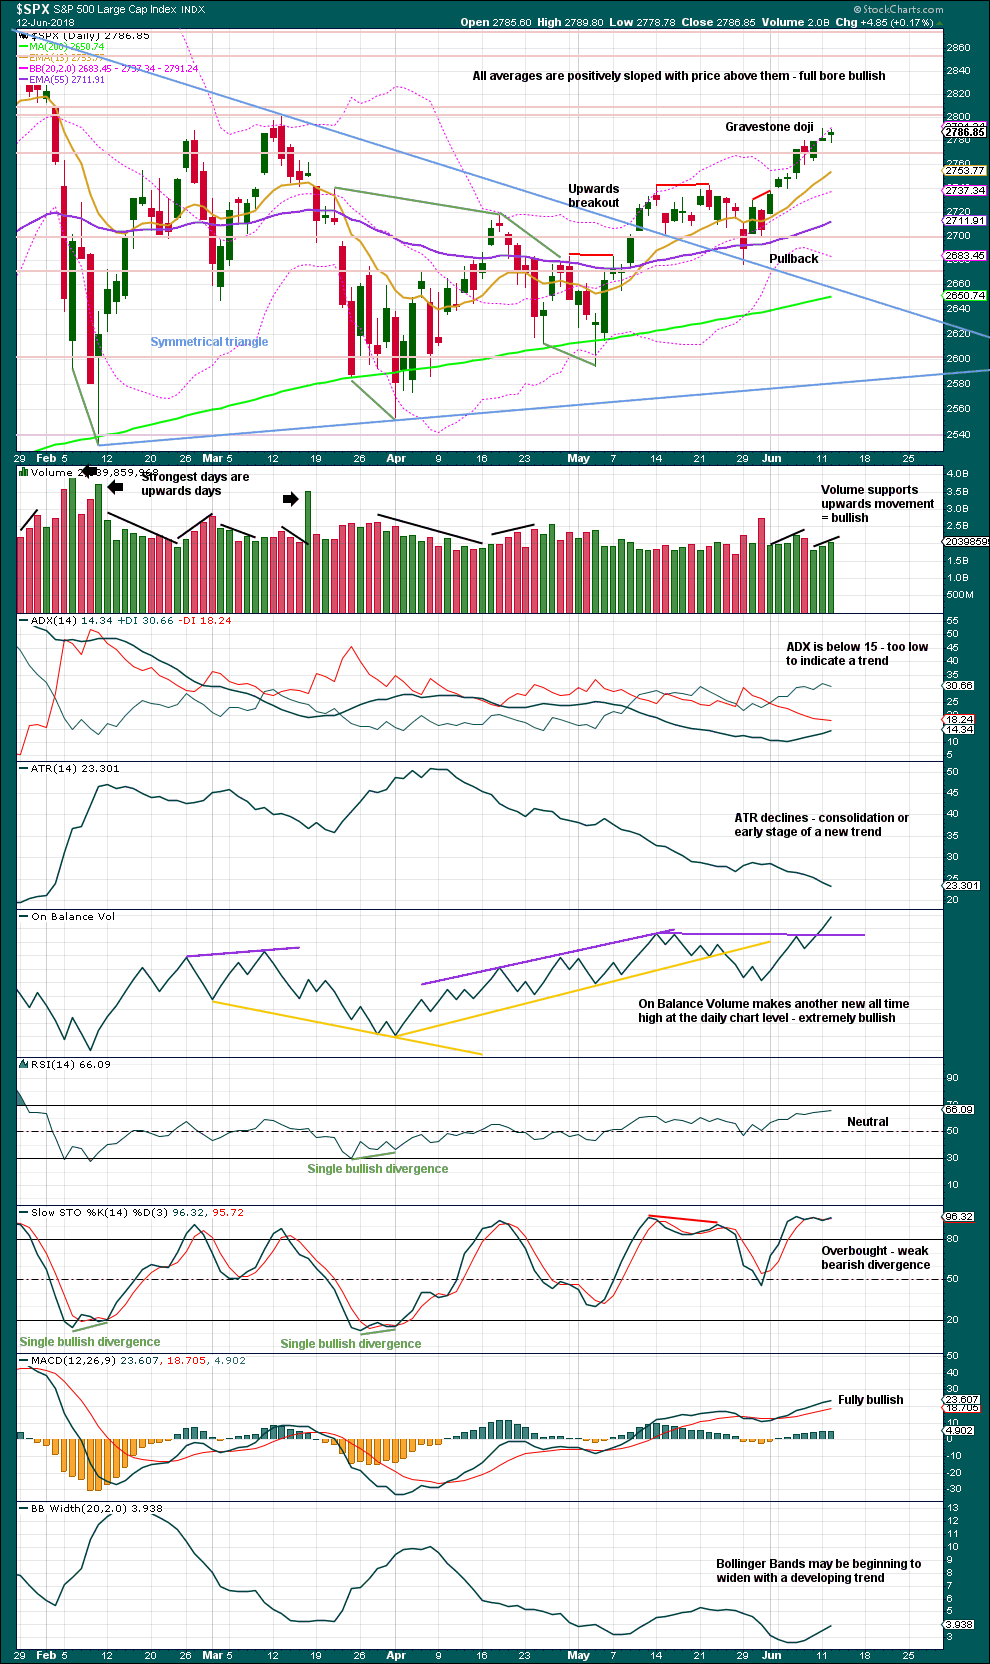
The symmetrical triangle may now be complete. The base distance is 340.18. Added to the breakout point of 2,704.54 this gives a target at 3,044.72. This is above the Elliott wave target at 2,922, so the Elliott wave target may be inadequate.
Volume and On Balance Volume are bullish. Stochastics is slightly bearish. Overall, this chart remains very bullish.
VOLATILITY – INVERTED VIX CHART
Click chart to enlarge. Chart courtesy of StockCharts.com. So that colour blind members are included, bearish signals
will be noted with blue and bullish signals with yellow.
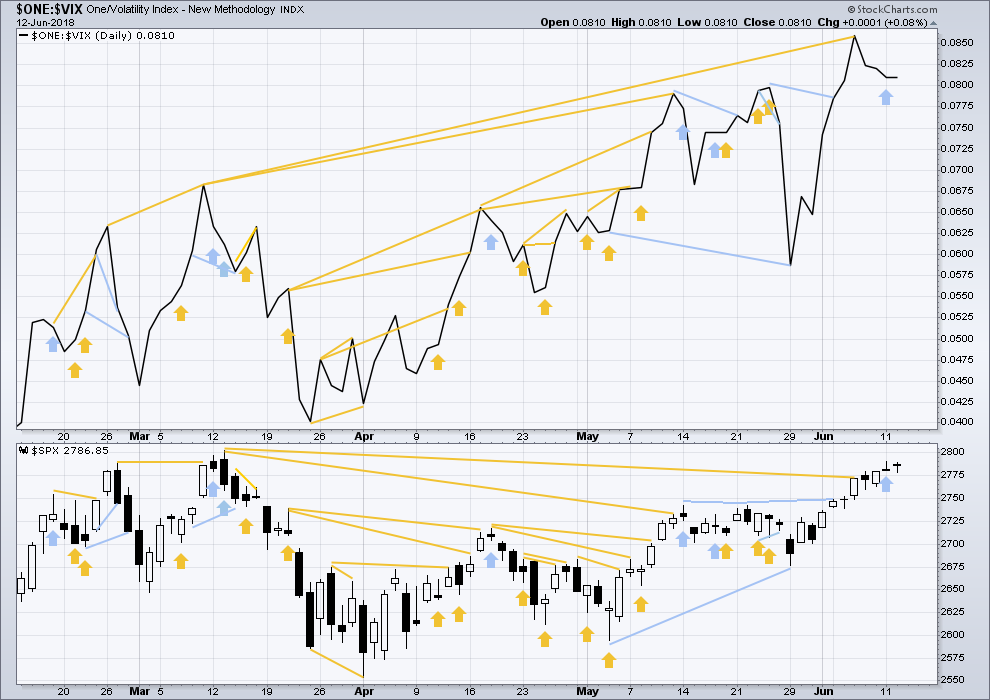
Normally, volatility should decline as price moves higher and increase as price moves lower. This means that normally inverted VIX should move in the same direction as price.
Inverted VIX has made a new high above the prior swing high of the 9th of March, but price has not made a corresponding new swing high about the same point yet. This divergence is bullish. Inverted VIX is still a little way off making a new all time high.
Price moved slightly lower today and inverted VIX is essentially flat. There is no new divergence.
BREADTH – AD LINE
Click chart to enlarge. Chart courtesy of StockCharts.com.
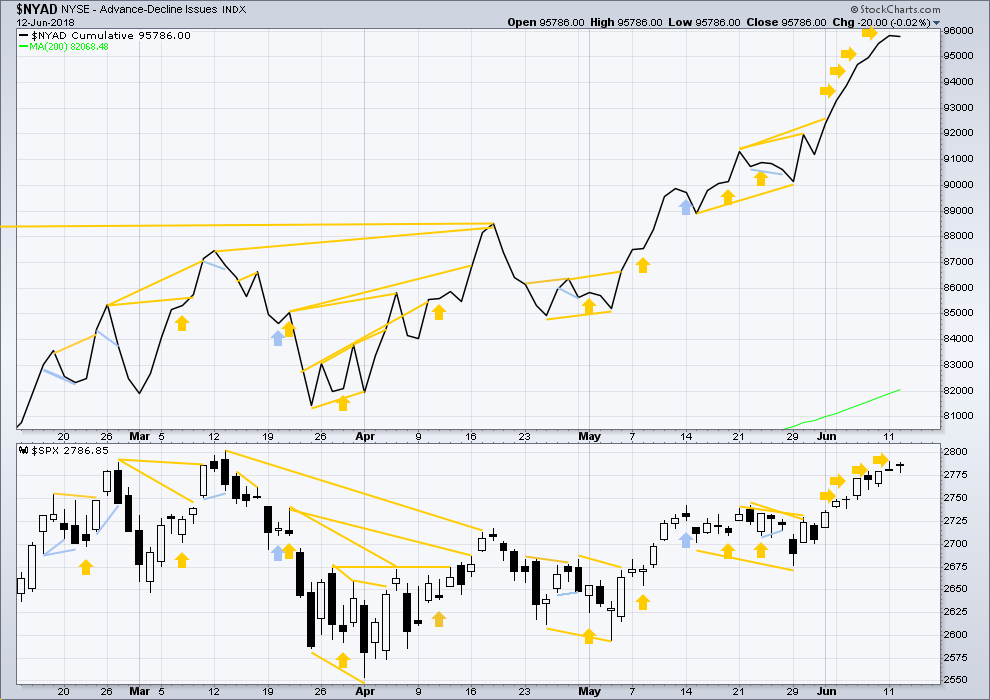
There is normally 4-6 months divergence between price and market breadth prior to a full fledged bear market. This has been so for all major bear markets within the last 90 odd years. With no longer term divergence yet at this point, any decline in price should be expected to be a pullback within an ongoing bull market and not necessarily the start of a bear market. New all time highs from the AD line means that any bear market may now be an absolute minimum of 4 months away. It may of course be a lot longer than that. My next expectation for the end of this bull market may now be October 2019.
Small caps and mid caps have both made new all time highs. It is large caps that usually lag in the latter stages of a bull market, so this perfectly fits the Elliott wave count. Expect large caps to follow to new all time highs.
Breadth should be read as a leading indicator.
Today both price and the AD line moved very slightly lower. There is no new divergence. The slight fall in price today has support from slightly declining market breadth.
DOW THEORY
The following lows need to be exceeded for Dow Theory to confirm the end of the bull market and a change to a bear market:
DJIA: 23,360.29.
DJT: 9,806.79.
S&P500: 2,532.69.
Nasdaq: 6,630.67.
Only Nasdaq at this stage is making new all time highs. DJIA and DJT need to make new all time highs for the ongoing bull market to be confirmed.
Charts showing each prior major swing low used for Dow Theory may be seen at the end of this analysis here.
Published @ 11:08 p.m. EST.
Updated hourly chart:
I’ll be discarding the alternate today. It does look like minute iv is continuing sideways. It may be done tomorrow.
It could still be either a flat, combination or triangle. They’re all still open possibilities.
i’m still quite bullish NAIL, and it’s on a blue light special right now.
Just from a fundamental perspective: won’t the rising interest rates slow down housing in a non rising income environment?
Mortgage rates will be hitting 5% soon it seems like… on top of that people have to pay more for gas and healthcare…
I don’t worry about that too much given the TF I’m trading in Ari. I just need price action support.
GS looks to me to be in a leading diagonal minor 1 up. (However, the iv doesn’t quite overlap the top of the i, so I guess technically it’s an impulse up really.) It’s launching minute v, and it should be going up to the 242-246 price area.
Technically, yeah. I’m gonna go with being technical
The dollar may be starting up a larger decline. Breaking below the 21 ema (blue) and the 23% fibo here might get me short. The options market for uup is quite liquid. I’ll also be looking at EEM on the long side, under the theory a weakening $ helps emerging markets. EEM also has very liquid options.
And don’t forget GLD and GDX also if you want exposure to this move…
Not forgotten Ari! GLD put credit spread and a straddle on NUGT to try to profit from volatility rise.
My hourly trend is down (2nd hour now). Tons of support at from 2778-2782 but if price break below that zone, a much larger move down would appear to be starting. If price gets up to new highs I’m going to have a mental “all clear” moment.
Macy’s (M) has triggered for me on the short side. A little put debit spread.
i tried to short this yesterday, and TDameritrade was not working in the morning until about 1:30/2 pm central time 🙁
So I missed out on this great set up… and I’m seriously thinking about leaving TD…
Interactive Brokers (for the quality and lowest costs). But NOT an analysis platform!! Leave $10 at Ameritrade so you have ToS access for the rest of your life. (I have $11….literally). They NEVER, ever close accounts with a positive balance.
Great advice. Thanks Kevin…
I second, third, and fourth that advice Kevin
Yeah, thanks very much Kevin for sharing that. That’s exactly the kind of tip newer members may need. And I get asked from time to time.
Deployed July 39/38 debit spread yesterday on M , Per your having me look at . Next support is down at the 36 area . THX Kevin for the ideas .
Watching the new “Lost in Space” (great fun and very well done by NFLX, great family fare, I recommend it), so I’m going to say, “danger, Will Robinson!”.
There is huge resistance right overhead in SPX. 2789 (right here and now, a prior pivot high), 2796 (78% fibo), 2802 (another prior pivot).
Assuming the minute iv is over…the minute v is under NO REQUIREMENT to go any further than into new high territory here, BEFORE A MINOR 2 DOWN LAUNCHES, which could drop as far as 2677 without violating the count.
So careful! “It could start up any time.” I’m not going to let it surprise me.
In theory the minute v is likely to be at least on the order of the size of the minute i, would would take price to about 2829, which is also the area of a symmetric swing projection. And maybe it will, and maybe further, as minute iii was very large and extended. But don’t be surprised by a massive sell off starting up ANY TIME now, because that would be 100% legit. 2730 would be a likely minor 2 ending area at this point.
Kevin, wht are you looking for a Minor 2? Lara’s count has that over about 11 days ago.
You caught me mixing up my ii’s and iv’s again. However…some part of my brain was thinking this overall minor 3 action up is NOT at the minute level, but at the minuette level, mean the 5 wave top coming will be the completion of only the minute i of the minor 3. Leaving a minute ii down to come next. Some part of my brain “was there”, and is there. This supposed minor iii looks rather short and…not iii-ish enough. What it looks like to me is a strong i of the minor 3, with lots more up expected BUT…first a minute ii back down.
I’m usually all washed up with these alternative theses, but I still like to consider them.
That is possible of course. I’m going to let MACD lead my EW count on the daily chart for this intermediate (5). So far with increased momentum beyond minor 1, it could be minor 3 well underway.