
A strong upwards day fits expectations perfectly.
The Elliott wave count has good support from classic technical analysis.
Summary: The short term target is at 2,824 or 2,915. The mid to longer term target is at 2,922. The final target for this bull market to end remains at 3,616.
The Elliott wave count has good support from classic technical analysis. Price has support from rising market breadth and declining volatility and rising volume.
Pullbacks are an opportunity to join the trend. An upwards trend is expected to be developing.
Always practice good risk management. Always trade with stops and invest only 1-5% of equity on any one trade.
New updates to this analysis are in bold.
The biggest picture, Grand Super Cycle analysis, is here.
Last historic analysis with monthly charts is here, video is here.
ELLIOTT WAVE COUNT
WEEKLY CHART
Click chart to enlarge.
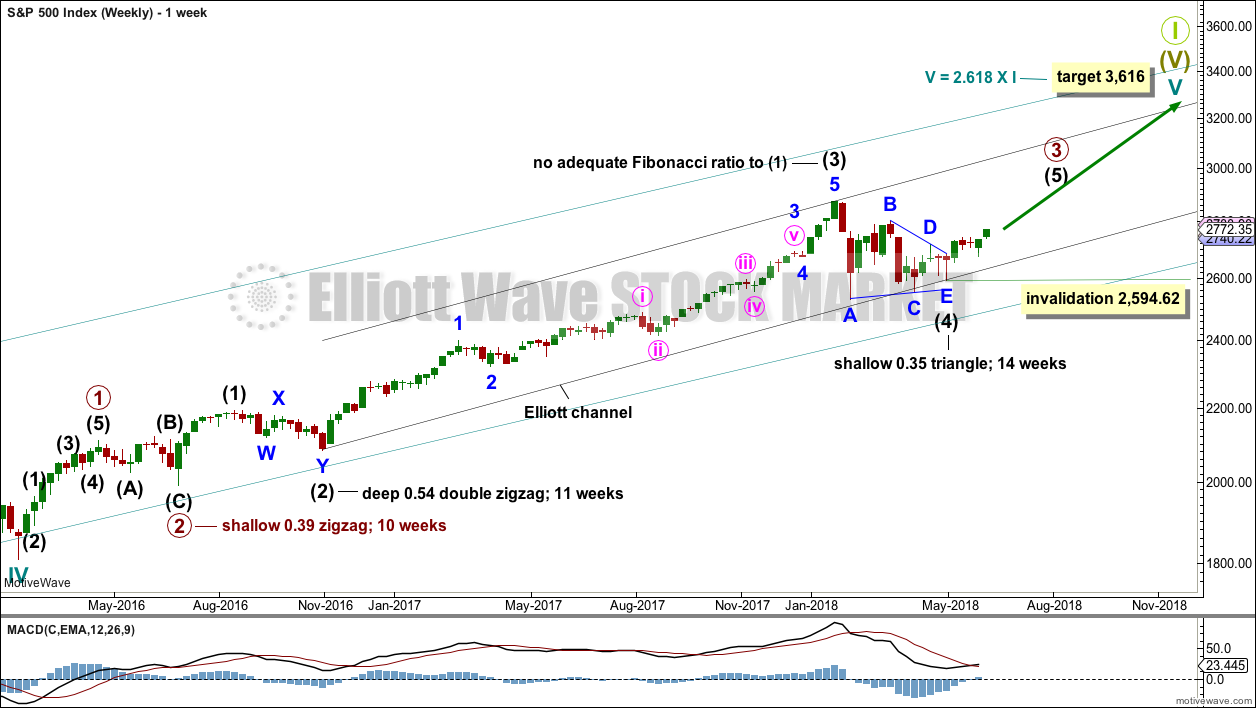
Cycle wave V must complete as a five structure, which should look clear at the weekly chart level and also now at the monthly chart level. It may only be an impulse or ending diagonal. At this stage, it is clear it is an impulse.
Within cycle wave V, the third waves at all degrees may only subdivide as impulses.
Intermediate wave (4) has breached an Elliott channel drawn using Elliott’s first technique. The channel is redrawn using Elliott’s second technique: the first trend line from the ends of intermediate waves (2) to (4), then a parallel copy on the end of intermediate wave (3). Intermediate wave (5) may end either midway within the channel, or about the upper edge.
Intermediate wave (4) may now be a complete regular contracting triangle lasting fourteen weeks, one longer than a Fibonacci thirteen. There is perfect alternation and excellent proportion between intermediate waves (2) and (4).
If intermediate wave (4) were to continue further as either a flat or combination, both possibilities would require another deep pullback to end at or below 2,532.69. With both On Balance Volume and the AD line making new all time highs, that possibility looks extremely unlikely.
If intermediate wave (4) were to continue further, it would now be grossly disproportionate to intermediate wave (2). Both classic technical analysis and Elliott wave analysis now suggest these alternate ideas should be discarded based upon a very low probability.
Within intermediate wave (5), no second wave correction may move beyond the start of its first wave below 2,594.62.
DAILY CHART
Click chart to enlarge.
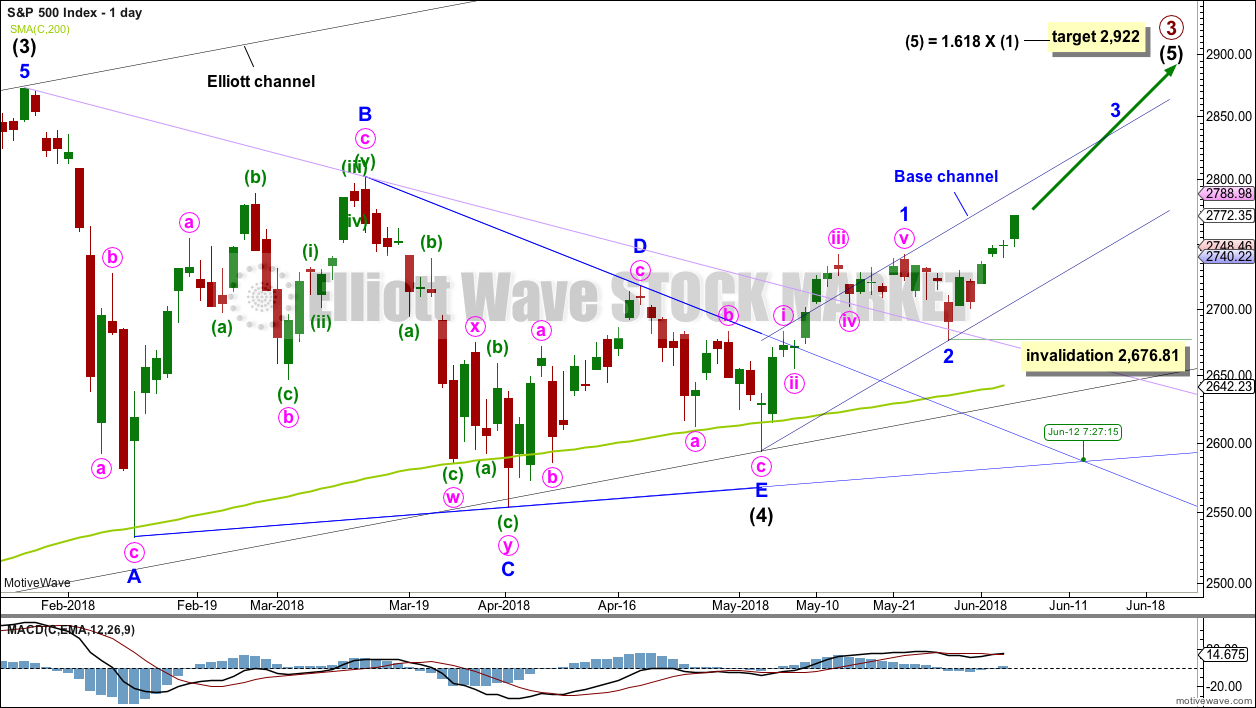
It is possible that intermediate wave (4) is a complete regular contracting triangle, the most common type of triangle. Minor wave E may have found support just below the 200 day moving average and ending reasonably short of the A-C trend line. This is the most common look for E waves of triangles.
Intermediate wave (3) exhibits no Fibonacci ratio to intermediate wave (1). It is more likely then that intermediate wave (5) may exhibit a Fibonacci ratio to either of intermediate waves (1) or (3). The most common Fibonacci ratio would be equality in length with intermediate wave (1), but in this instance that would expect a truncation. The next common Fibonacci ratio is used to calculate a target for intermediate wave (5) to end.
Price has clearly broken out above the upper triangle B-D trend line. This indicates that it should now be over if the triangle is correctly labelled.
A trend line in lilac is added to this chart. It is the same line as the upper edge of the symmetrical triangle on the daily technical analysis chart. Price has found support about this line at the last two small swing lows. The suppport at this line has reasonable technical significance now that it has been tested twice, and this line should be assumed to continue to provide support until proven otherwise.
Sometimes the point at which the triangle trend lines cross over sees a trend change. A trend change at that point may be a minor one or a major one. That point is now about the 12th of June.
Minor wave 3 may only subdivide as an impulse, and within it the subdivisions of minute waves ii and iv may show up as one or more red daily candlesticks or doji.
Within minor wave 3, no second wave correction may move beyond the start of its first wave below 2,676.81. Along the way up, any deeper corrections may now find support at the lower edge of the base channel drawn about minor waves 1 and 2. Minor wave 3 may have the power to break above the upper edge of the base channel. If it does, then that upper edge may then provide support.
HOURLY CHART
Click chart to enlarge.
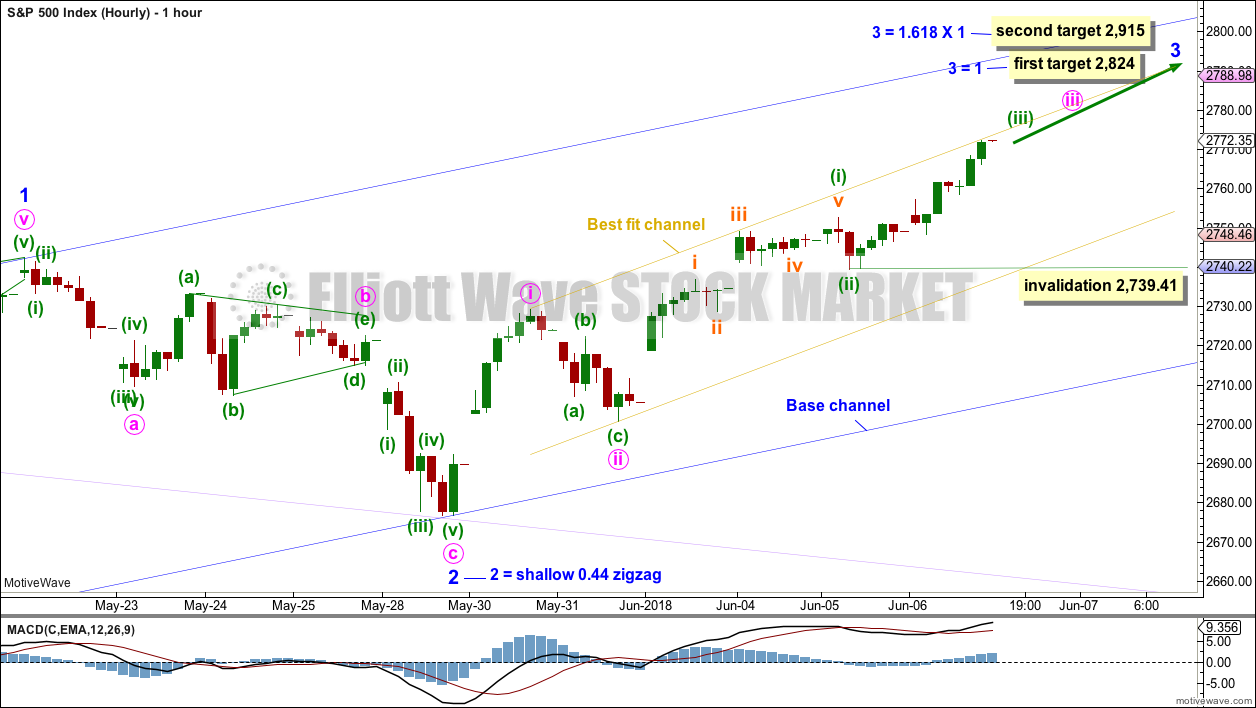
Minor wave 2 may be a complete zigzag. There is no adequate Fibonacci ratio between minute waves a and c.
The daily chart is on a semi-log scale. This hourly chart is on an arithmetic scale, and this is why the lilac trend line sits slightly differently on each chart. On this hourly chart, price perfectly found support at the lilac trend line. Minor wave 2 ends with a strong bullish engulfing candlestick pattern.
Copy the base channel over from the daily chart. Use the lower edge as final support for any deeper corrections along the way up towards the end of minor wave 3.
Minor wave 2 was relatively shallow, less than 0.5 of minor wave 1. Look out for corrections now within minor wave 3 to possibly be more shallow than otherwise expected.
Two targets are given for minor wave 3 to end, and both fit with the higher target for primary wave 3 to end on the daily chart. If price keeps on rising after the first target has been reached, or the structure is incomplete, then the second target will be used.
The labelling within minor wave 3 is changed at the hourly chart level today. Minute waves i and ii may be complete. Minute wave iii may be incomplete and moving now through the middle strongest portion. This fits with the increased slope of today’s upwards movement and strength in volume and breadth.
At 2,786 minute wave iii would reach 1.618 the length of minute wave i. As price approaches this first target, if the structure may be seen as complete, then it may end there. If price keeps rising through this first target, then the next target would be at 2,838 where minute wave iii would reach 2.618 the length of minute wave i. This second target fits only with the second target for minor wave 3.
Within minuette wave (iii), no second wave correction may move beyond the start of its first wave below 2,739.41.
TECHNICAL ANALYSIS
WEEKLY CHART
Click chart to enlarge. Chart courtesy of StockCharts.com.
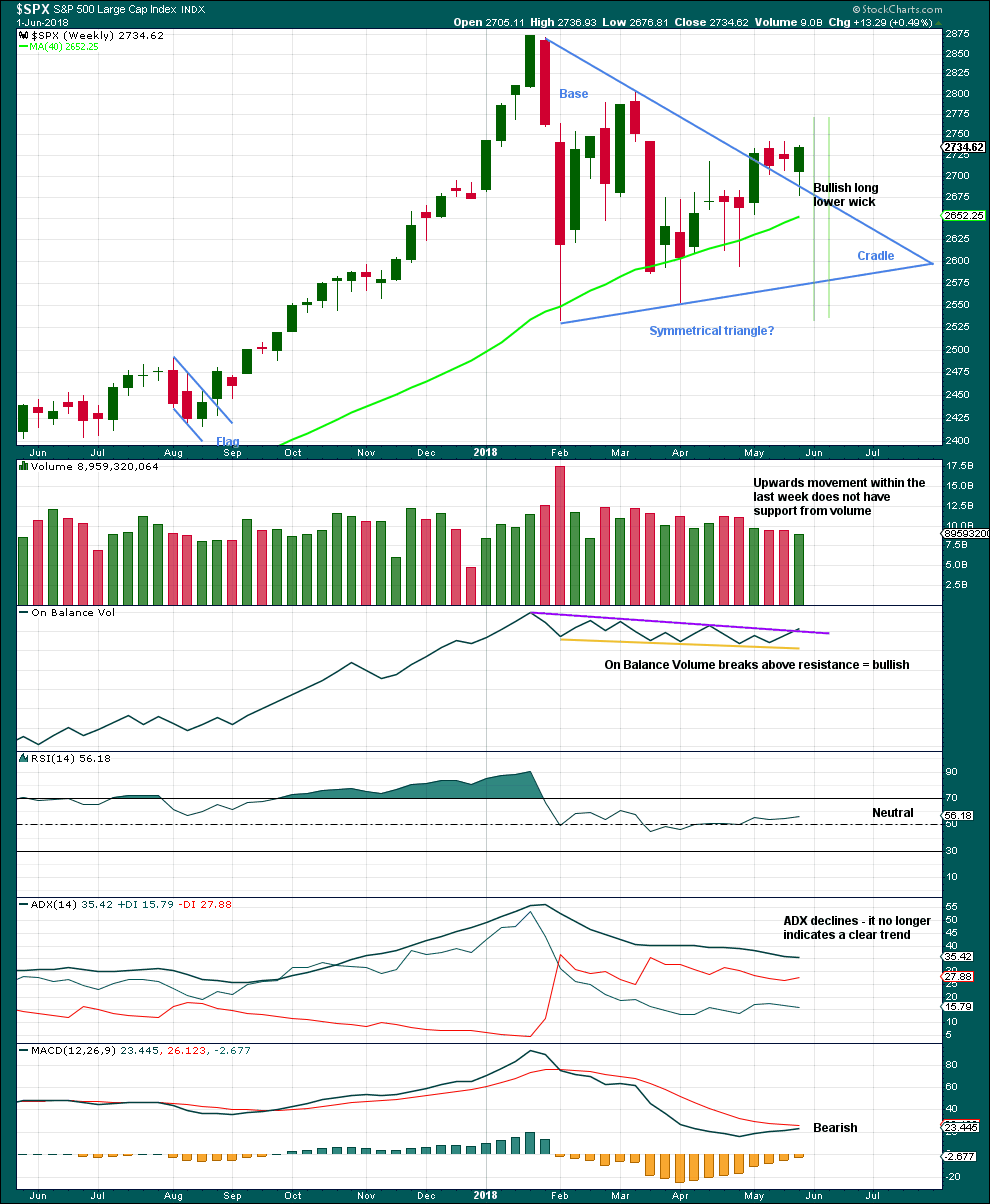
From Dhalquist and Kirkpatrick on trading triangles:
“The ideal situation for trading triangles is a definite breakout, a high trading range within the triangle, an upward-sloping volume trend during the formation of the triangle, and especially a gap on the breakout.”
For this example, the breakout may have now happened. There was a high trading range within the triangle, but volume declined. Last week may be the end of the pullback, with a long lower wick slightly overshooting the triangle trend line.
The bullish signal from On Balance Volume Last week is reasonable, but really does need to be clearer for confidence. If this week continues upwards, it would be clear and then should be given reasonable weight.
DAILY CHART
Click chart to enlarge. Chart courtesy of StockCharts.com.
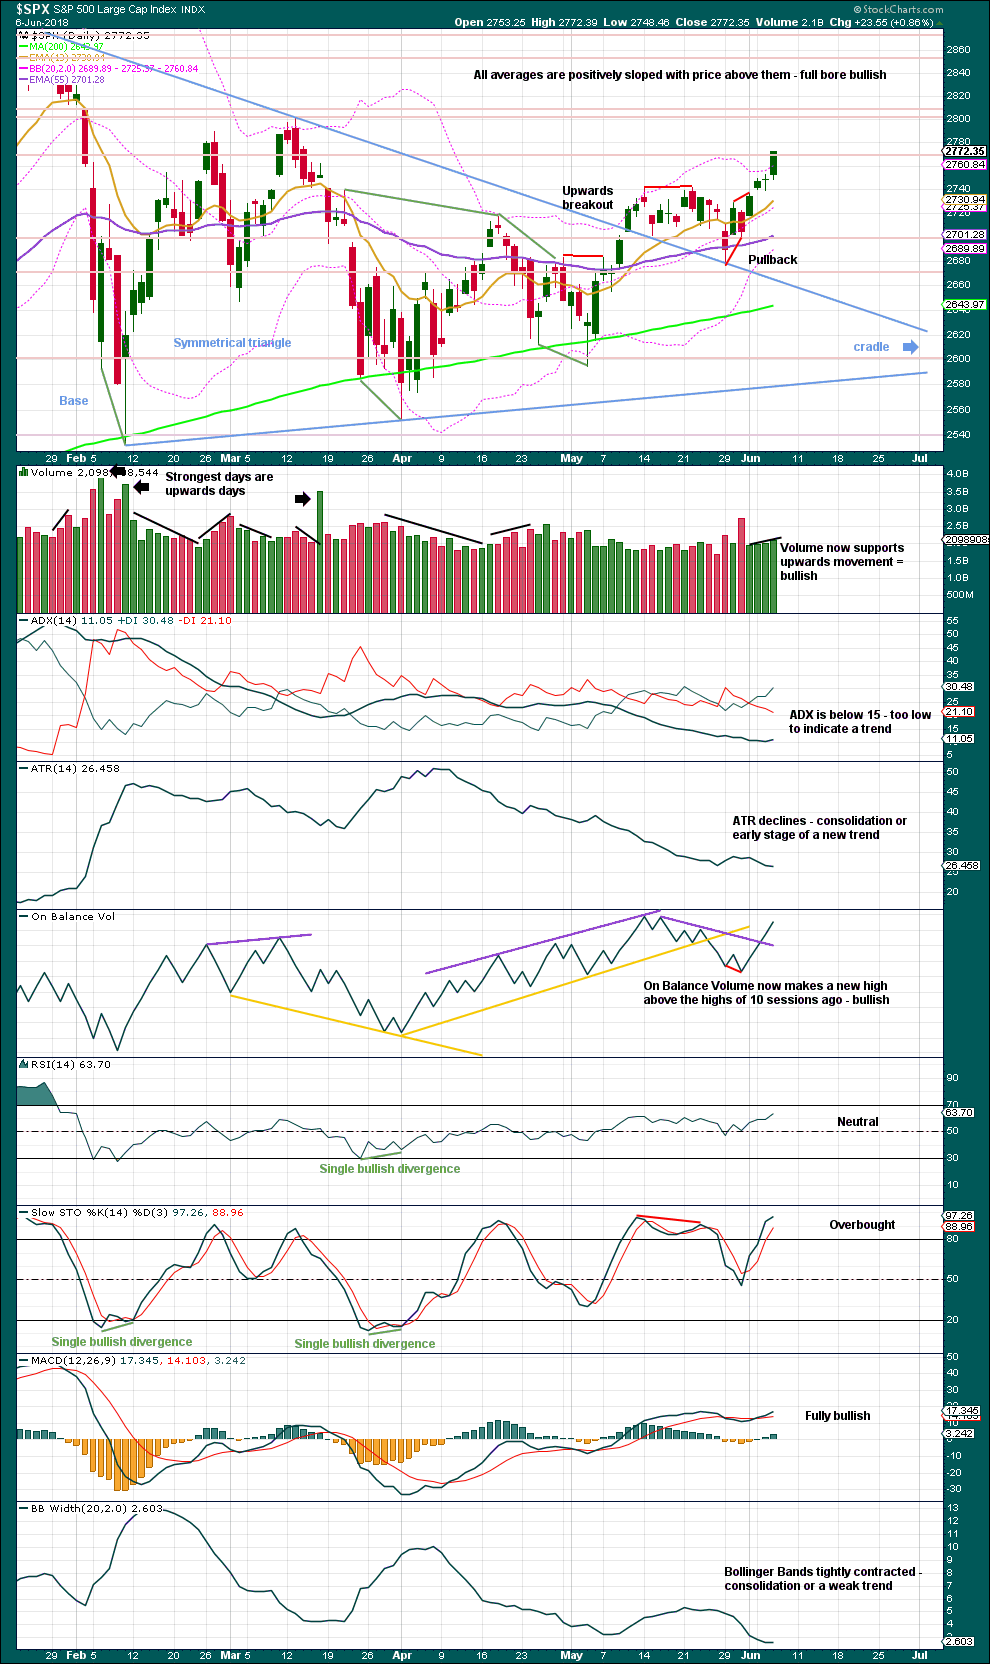
The symmetrical triangle may now be complete, and price has completed an upwards breakout. There may be some small cause for concern that the upwards breakout does not have support from volume. However, in current market conditions only some small concern is had here. Rising price on light and declining volume has been a feature of this market for years, yet price continues to rise.
After an upwards breakout, pullbacks occur 59% of the time. The pullback looks typical. With price now moving up and away from the line, it does look like the pullback may have been over last week.
On Balance Volume made a new all time high on the 14th of May at the daily chart level. This signal remains overall very bullish.
The base distance is 340.18. Added to the breakout point of 2,704.54 this gives a target at 3,044.72. This is above the Elliott wave target at 2,922, so the Elliott wave target may be inadequate.
Bearish divergence noted between highs in price and On Balance Volume has disappeared from the prior highs 11 sessions ago but still slightly remains with the highs 17 sessions ago. If tomorrow continues to move On Balance Volume higher, then this too may disappear.
Volume is now bullish. On Balance Volume is looking now less bearish.
Today’s candlestick is very bullish.
Stochastics may remain overbought for a reasonable period of time during a bull trend for this market.
VOLATILITY – INVERTED VIX CHART
Click chart to enlarge. Chart courtesy of StockCharts.com. So that colour blind members are included, bearish signals
will be noted with blue and bullish signals with yellow.
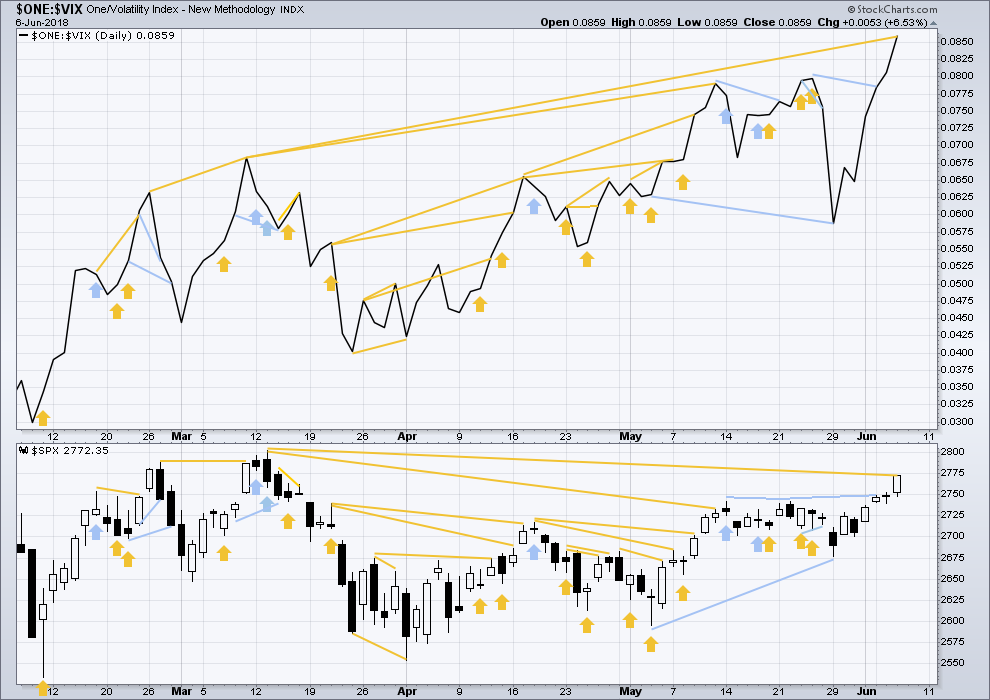
Normally, volatility should decline as price moves higher and increase as price moves lower. This means that normally inverted VIX should move in the same direction as price.
Today inverted VIX has made a new high above the prior swing high of the 9th of March, but price has not made a corresponding new swing high about the same point yet. This divergence is bullish. Inverted VIX is still a little way off making a new all time high.
BREADTH – AD LINE
Click chart to enlarge. Chart courtesy of StockCharts.com.
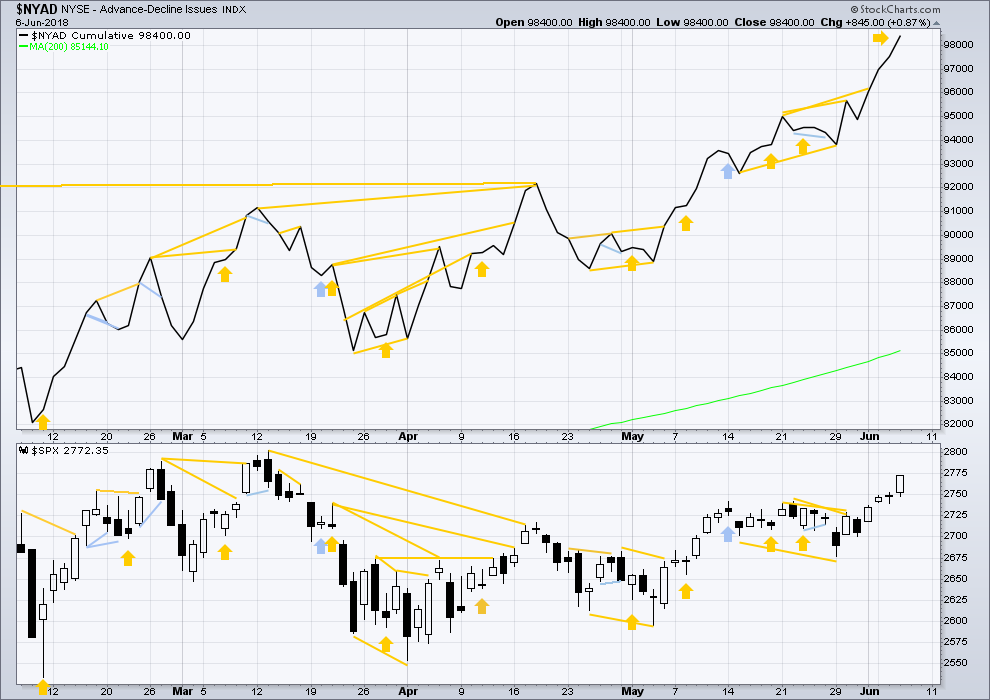
There is normally 4-6 months divergence between price and market breadth prior to a full fledged bear market. This has been so for all major bear markets within the last 90 odd years. With no longer term divergence yet at this point, any decline in price should be expected to be a pullback within an ongoing bull market and not necessarily the start of a bear market. New all time highs from the AD line means that any bear market may now be an absolute minimum of 4 months away. It may of course be a lot longer than that. My next expectation for the end of this bull market may now be October 2019.
Small caps have made another new all time high, but mid and large caps have yet to do so. This divergence may be interpreted as bullish. Small caps may now be leading the market.
Breadth should be read as a leading indicator.
The AD line is daily making new all time highs. This is a very bullish signal and will be given the most weight in today’s analysis. Price is likely to follow within days or a very few weeks.
DOW THEORY
The following lows need to be exceeded for Dow Theory to confirm the end of the bull market and a change to a bear market:
DJIA: 23,360.29.
DJT: 9,806.79.
S&P500: 2,532.69.
Nasdaq: 6,630.67.
At this stage, only DJIA has made a new major swing low. DJT also needs to make a new major swing low for Dow Theory to indicate a switch from a bull market to a bear market. For an extended Dow Theory, which includes the S&P500 and Nasdaq, these two markets also need to make new major swing lows.
Charts showing each prior major swing low used for Dow Theory may be seen at the end of this analysis here.
Published @ 09:03 p.m. EST.
Lara,
I can’t believe someone called you or anyone else stupid. But then again, I don’t do social media subjecting myself to such poor manners.
My thinking is this: We need a move above 2802+ the high of Minor B in the Intermediate 4 triangle to ensure we have absolutely exited the corrective triangle. But my guess is that the market will not give it so easily. A correction at that point may be the next bear attack. If so, then their stop loss points will be above 2802+ which in turn can give the necessary short covering needed in the next up wave to just pass 2800 by in a powerful manner propelling the SPX toward 2900 and a new ATH.
(Continuing an earlier conversation) We have a powerful undertow in the areas of the ocean nearest my home. Most often it is not safe to enter. But if we find some great weather, I will try to convince Grandma to get the grand-kids out of the pool and into the ocean. But I suspect that may be a loosing proposition. Grandmother bears can be powerful! I’d rather fight a Grizzly bear.
Bonds took off the to upside breaking the daily downtrend line…the proceeded to do a big reversal and is now squatting on top of that same downtrend line. I’ve squeeze a little juice out of it on the long side via TMF today but now I’m neutral and waiting for the daily trend to clarify. I really like the TMF/TMV pair, as bonds gives good signals and is rather trendy, and these instruments have excellent leverage.
Hourly chart updated:
If I change this it may be to move the degree of labelling within minutte (iii) down one degree, it may be only submineutte i and ii just over today.
If minuette (iii) is over at today’s high then it is shorter than minuette (i). This limits minuette (v) to no longer than equality with minuette (iii) at 2,800.55
the best fit channel is slightly adjusted
Noodling around the internet…shocking to me to find such “serious” traders who haven’t a clue about EW, and thus as far as I’m concerned, are trading half-blind, even with all their knowledge and indicators and technique (all of which I’m aggressively leaching as fast as I can of course). On top of this, the discounting: “oh, it’s subjective, anything can happen and you can always draw an ew over it”, etc etc. Yet they haven’t a clue that the market has exited the big correction and resumed impulsive action at the daily/weekly level, for example. Tactically right here for example, they have no clue that there’s serious structural support pretty darn close below (they see the pivot high that marks the top of the 1, but they don’t give it the proper weight that we know it has, and thus the added trading confidence it provides). Shocking to me, but there ya go. Happy to have the support of a master map maker, ty Lara!
Minuette 4 completed would give an almost perfect 50% retrace of 3 though….
Phony money creates phony markets traded by phony participants…..I am very much looking forward to the destruction and on to a real cycle
You’re welcome.
I made a comment on the Twitters the other day about the AD line, and how bullish I was.
I received a reply that I was stupid, didn’t I know it’s a giant bubble.
LOL
top of (iii) 2780, bottom of (iv) 2760…. would be interesting if (v) is 2800
My first order presumption is that SPX is now in the minute 4, as this looks a bit oversized in price and time for a minuette 4 vs the prior minuette waves in this minute 3 up. In which case, it’s in the B or X wave now most likely…so careful on the bull side! The C or Y down doesn’t have EW stoppage until 2729, top of the minute 1.
this perhaps…
Selling remaing VIX 11.00 strike calls for nice triple!
Holding put spread….
are we gonna bounce off 2760?
Longer-term longs stopped out for a gain, and managed to grab a quick scalp on VXX… maybe one more yet today?
Nope.
Should be setting up for tomorrow if this is now B of an ABC down…
About to break above bullish falling wedge… 😉
Yahtzee Verne!!! took out principal, letting profits go. It’s gonna keep going to 14-15 methinks.
SPX should not be going below 2752.61, if Lara’s detailed count is correct, and I personally believe it’s most likely good. Buyers aren’t too far away in the wings waiting to swoop.
Is this legal? 😀
well, I certainly hope so….
The tax man cometh..! 🙂
Uh huh!
Those Commercials are some wild and crazy guys!
Selling half VIX 11.00 strike calls for a quick double….holding remaining half with sell stop at VIX 12.00 GTC.
/ZB (30 year treasuries) have busted the downtrend line on the daily and polarity inverted hourly. A pretty good long set up for any of TLT, or TMF, etc. Could be bad for the banks again for the next few days or more.
I see three 1,2 in a row for light crude…
Some energy tickers to consider that I’ve been using for longs scalps/swing trades starting really just today (because of hourly level buy signals): rspp, mtdr, pe. Interestingly, when I do a scan on finviz for best “fundamentals” type of companies of enough size/volume, all three of these end up on the list of 35 or so as well as being well set up now for a “buy low” strategy.
Hi Kevin. Thanks for those recommendations.
Do you still like FANG?
For longs, now I do. It’s triggered long, and it’s trade-able long IMO. Broken the sharp downtrend line on the daily, etc.
Note: yesterday, the SPX and RUT moved up a bit very early in the session, even as the FAANGM (FB AMZN AAPL NFLX GOOGL MSFT) crowd was all negative. Then the FAANGM crowd start moving up and positive, and all heck broke out to the upside. So far, the same pattern is occurring today. No guarantees it continues in the same pattern, but obviously those “driver” stocks bear close watching. I have a “combo” ticker for them in ToS that uses: 5.8*FB+6.4*AAPL+12.7*MSFT+AMZN+GOOGL, that I can monitor as a single ticker and chart of the whole complex, kind of neat. They are still falling overall….
A pretty decent signal….”monsters of tech” 5 minute chart as described.
love the charts! always helpful…..
Where oh where does the minor 3 end? Some projections based on prior moves, and based on “3 vs 1” ratios. But first we should have a little (hah!) minute 4, and I suspect the big resistance around 2800 induced that. Just a guess!!
Thanks Lara for the continued excellent analysis and commentary. It looks like it is going to be a profitable summer for me. I hope all subscribers have been able to take advantage of the triangle breakout and test of the upper trend line by getting long.
Have a great day all. Today I am getting 8 new tires for the motorhome as we prepare to take our granddaughters to the ocean beach next month. At only 3 and 6 they are a bit too young to go surfing. But I can show them pictures of Lara!
For 3 and 6 I’d suggest boogie boards; shove ’em into little waves that push ’em onto the sand, they’ll love it and catch the bug too. With some kind of life vests or floats for safety of course.
awesome Rodney!
Kevin’s onto it. boogie boards, perfect
I put my son on a surfboard about age 6. he’d had lots of swimming lessons so no life vest, and he was just in little waves. he got the bug
but then he watched Jaws and now won’t go into the ocean
don’t let them watch Jaws!