
An inside day closes red and remains above the short term invalidation point on the hourly chart.
Overall, the analysis remains the same. A signal today from On Balance Volume prompts two alternate hourly wave counts for the short term picture.
Summary: While price remains above the lower edge of the base channel on the main hourly chart, assume a third wave may be unfolding. The short term target is at 2,824 or 2,915. The mid to longer term target is at 2,922. The final target for this bull market to end remains at 3,616.
Small bearish divergence today from On Balance Volume suggests the pullback may not be over and continue lower to again test the lilac trend line, or to end about 2,651. If price breaks below the base channel on the main hourly chart, then this would increase in probability.
Pullbacks are an opportunity to join the trend. An upwards trend is expected to develop, which has very strong support from new all time highs from the AD line and On Balance Volume.
Always practice good risk management. Always trade with stops and invest only 1-5% of equity on any one trade.
New updates to this analysis are in bold.
The biggest picture, Grand Super Cycle analysis, is here.
Last historic analysis with monthly charts is here, video is here.
ELLIOTT WAVE COUNT
WEEKLY CHART
Click chart to enlarge.
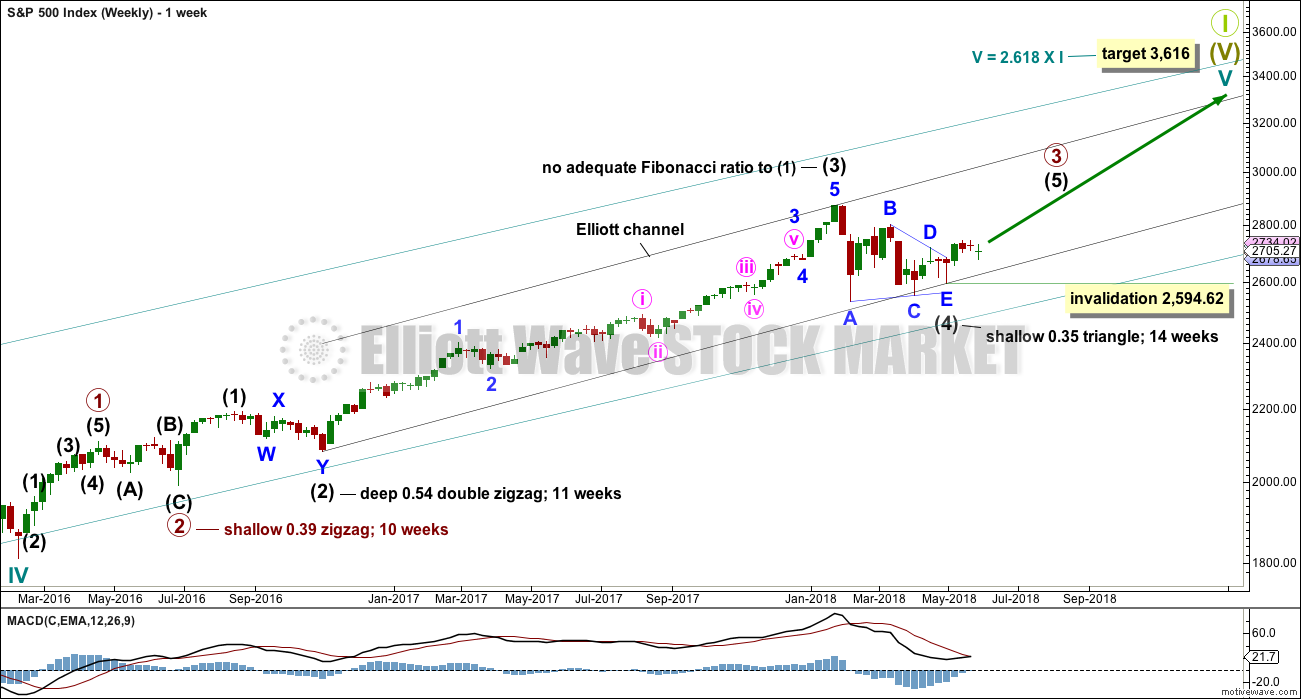
Cycle wave V must complete as a five structure, which should look clear at the weekly chart level and also now at the monthly chart level. It may only be an impulse or ending diagonal. At this stage, it is clear it is an impulse.
Within cycle wave V, the third waves at all degrees may only subdivide as impulses.
Intermediate wave (4) has breached an Elliott channel drawn using Elliott’s first technique. The channel is redrawn using Elliott’s second technique: the first trend line from the ends of intermediate waves (2) to (4), then a parallel copy on the end of intermediate wave (3). Intermediate wave (5) may end either midway within the channel, or about the upper edge.
Intermediate wave (4) may now be a complete regular contracting triangle lasting fourteen weeks, one longer than a Fibonacci thirteen. There is perfect alternation and excellent proportion between intermediate waves (2) and (4).
If intermediate wave (4) were to continue further as either a flat or combination, both possibilities would require another deep pullback to end at or below 2,532.69. With both On Balance Volume and the AD line making new all time highs, that possibility looks extremely unlikely.
If intermediate wave (4) were to continue further, it would now be grossly disproportionate to intermediate wave (2). Both classic technical analysis and Elliott wave analysis now suggest these alternate ideas should be discarded based upon a very low probability.
Within intermediate wave (5), no second wave correction may move beyond the start of its first wave below 2,594.62.
DAILY CHART
Click chart to enlarge.
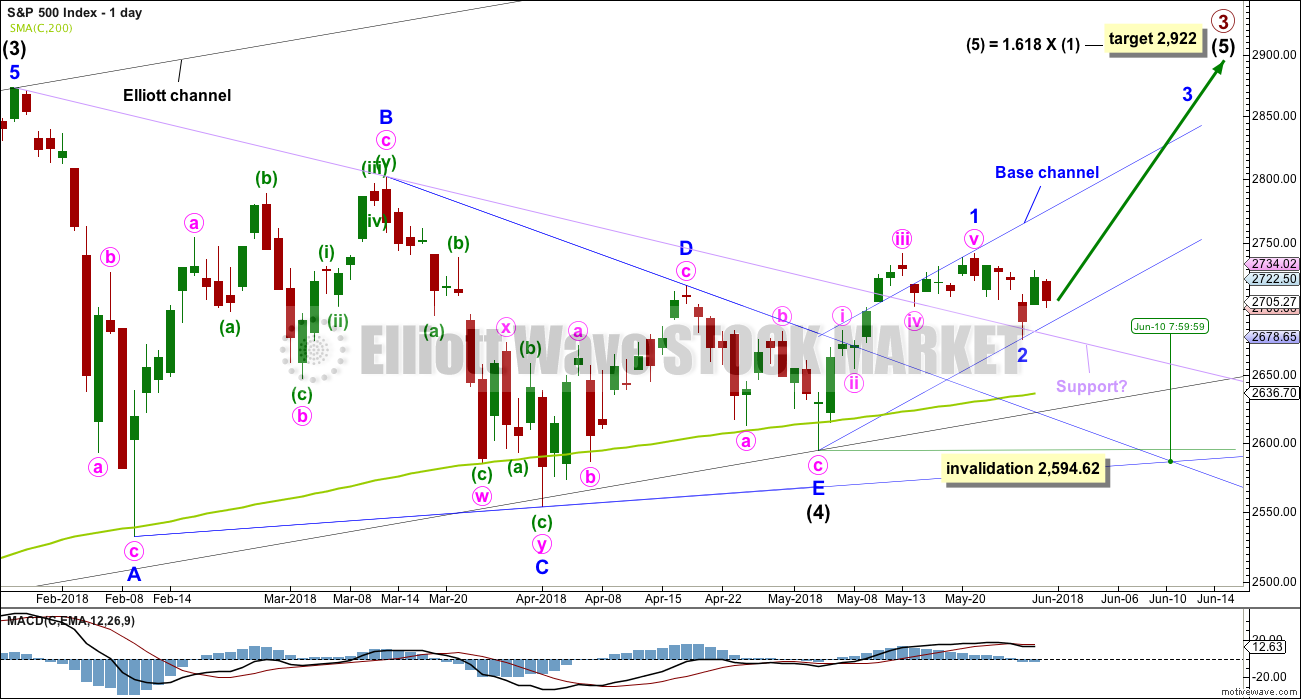
It is possible that intermediate wave (4) is a complete regular contracting triangle, the most common type of triangle. Minor wave E may have found support just below the 200 day moving average and ending reasonably short of the A-C trend line. This is the most common look for E waves of triangles.
Intermediate wave (3) exhibits no Fibonacci ratio to intermediate wave (1). It is more likely then that intermediate wave (5) may exhibit a Fibonacci ratio to either of intermediate waves (1) or (3). The most common Fibonacci ratio would be equality in length with intermediate wave (1), but in this instance that would expect a truncation. The next common Fibonacci ratio is used to calculate a target for intermediate wave (5) to end.
Price has clearly broken out above the upper triangle B-D trend line. This indicates that it should now be over if the triangle is correctly labelled.
A trend line in lilac is added to this chart. It is the same line as the upper edge of the symmetrical triangle on the daily technical analysis chart. Price has found support about this line at the last two small swing lows. The suppport at this line has reasonable technical significance now that it has been tested twice, and this line should be assumed to continue to provide support until proven otherwise.
Sometimes the point at which the triangle trend lines cross over sees a trend change. A trend change at that point may be a minor one or a major one. That point is now about the 10th of June.
HOURLY CHART
Click chart to enlarge.
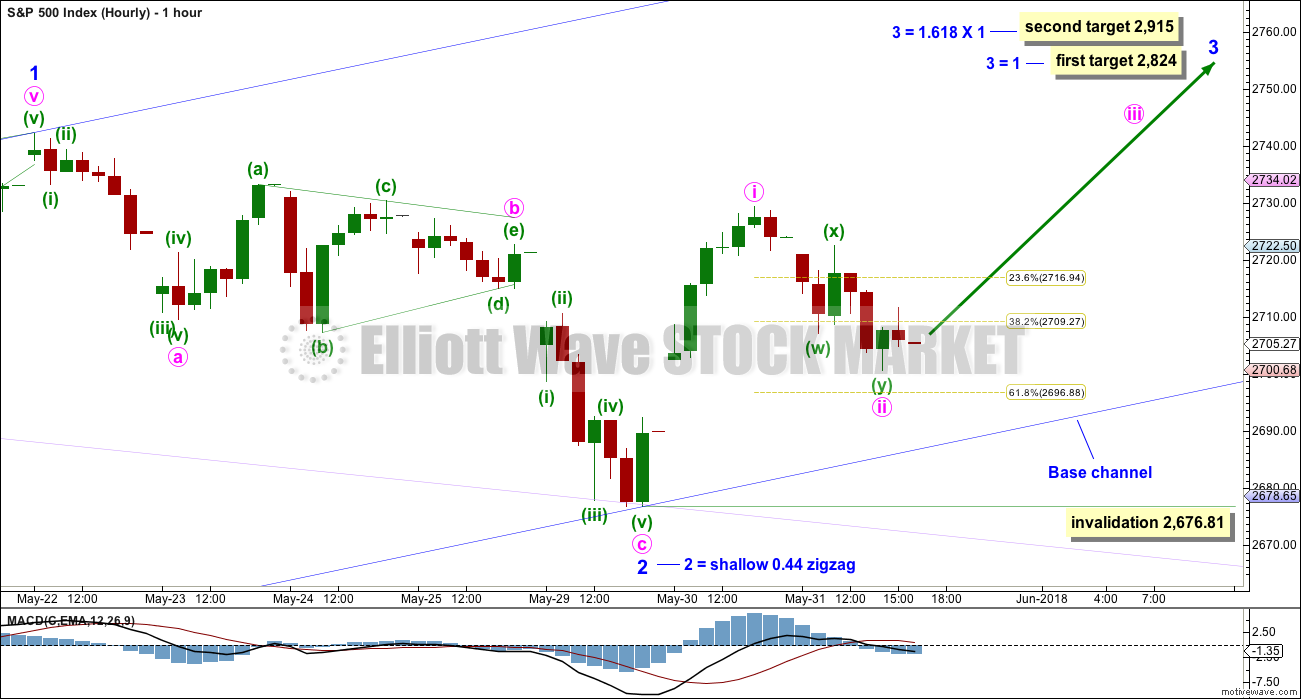
Minor wave 2 may be a complete zigzag. There is no adequate Fibonacci ratio between minute waves a and c.
The daily chart is on a semi-log scale. This hourly chart is on an arithmetic scale, and this is why the lilac trend line sits slightly differently on each chart. On this hourly chart, price perfectly found support at the lilac trend line. Minor wave 2 ends with a strong bullish engulfing candlestick pattern.
A base channel is added to minor waves 1 and 2: draw the first trend line from the start of minor wave 1 on the low of the 3rd of May, to the end of minor wave 2, then place a parallel copy on the end of minor wave 1. Corrections should find support about the lower edge of this base channel as minor wave 3 unfolds along the way up.
Minor wave 2 was relatively shallow, less than 0.5 of minor wave 1. Look out for corrections now within minor wave 3 to possibly be more shallow than otherwise expected.
Minor wave 3 must subdivide as an impulse. If it is extended, then within it minute waves ii and iv may show up on the daily chart lasting from one to a few sessions. So far for this wave count minute wave ii now subdivides as a double zigzag and shows up on the daily chart as one red candlestick. It may be over here, just short of the 0.618 Fibonacci ratio of minute wave i.
If minute wave ii continues lower, it should find strong support at the lower edge of the blue base channel. A breach of that trend line by downwards movement would reduce the probability of this main wave count; alternates would then be more likely. Minute wave ii may not move beyond the start of minute wave i below 2,676.81.
Two targets are given for minor wave 3 to end, and both fit with the higher target for primary wave 3 to end on the daily chart. If price keeps on rising after the first target has been reached, or the structure is incomplete, then the second target will be used.
With the classic technical analysis now very bullish, a more bearish alternate hourly wave count will not be published today.
FIRST ALTERNATE HOURLY CHART
Click chart to enlarge.
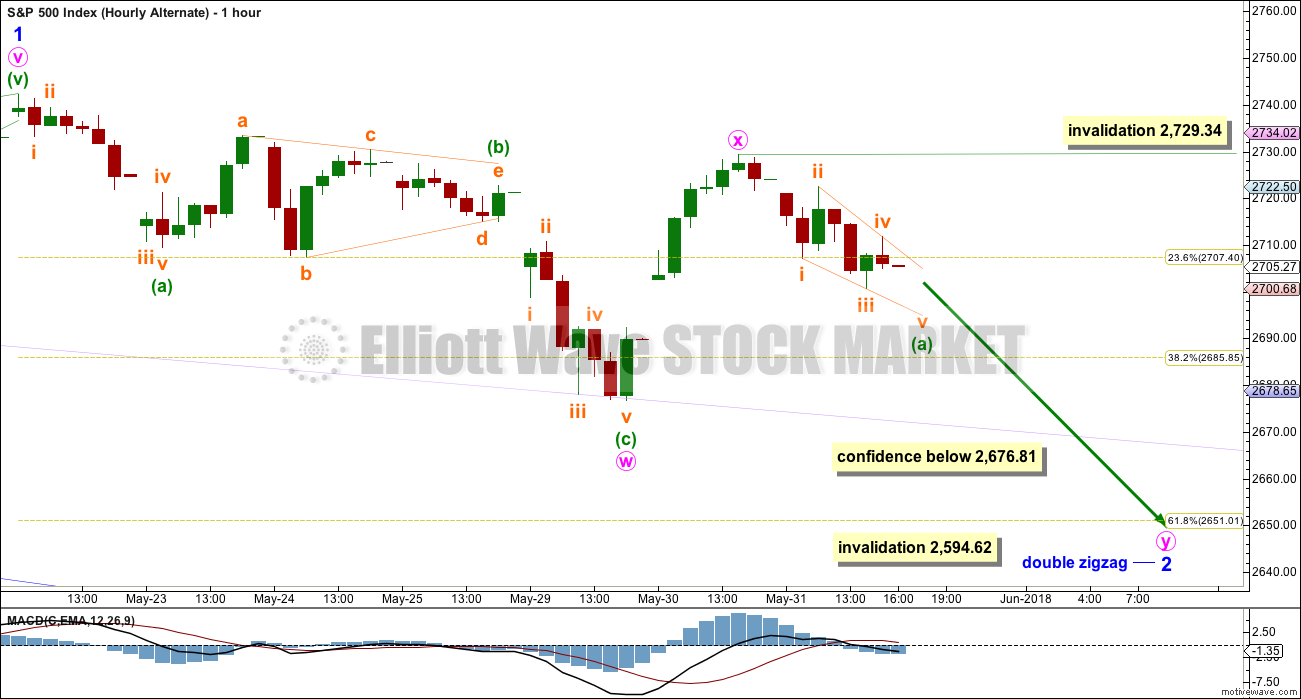
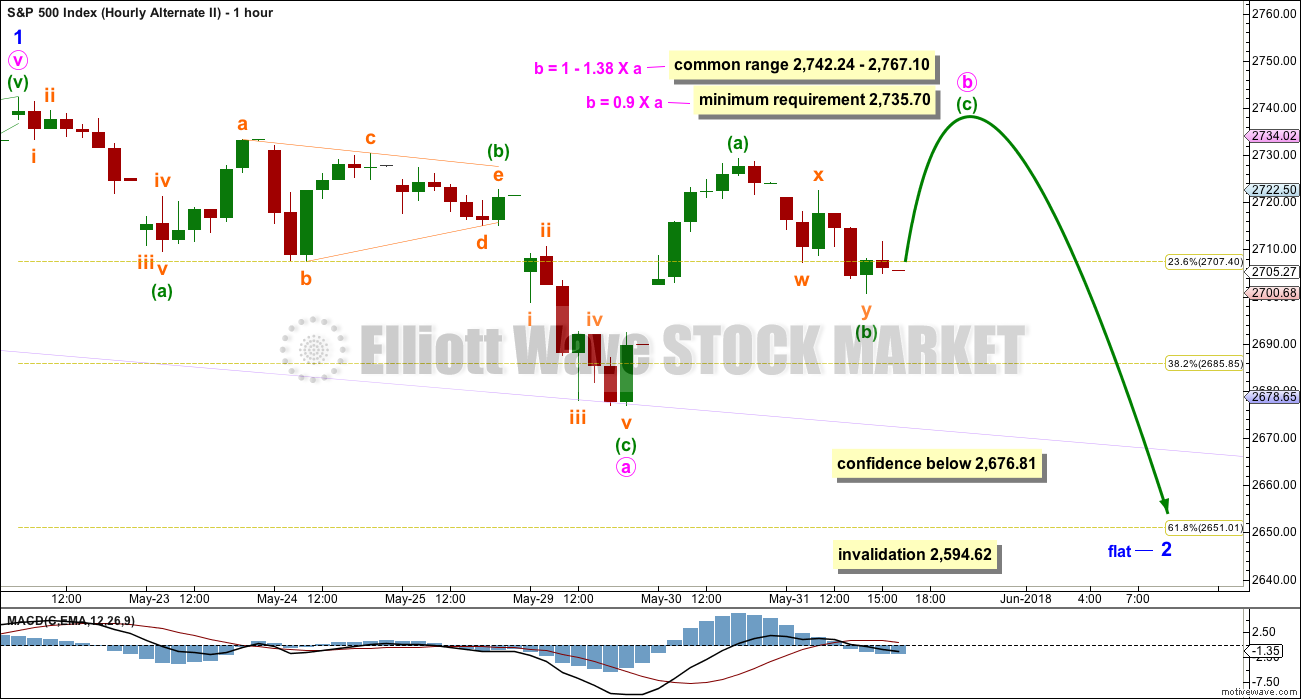
Minor wave 2 may be continuing lower as a double zigzag. The double may be joined by a complete three in the opposite direction, a zigzag labelled minute wave x. A second zigzag may now continue lower to end close to the 0.618 Fibonacci ratio at 2,651.
If the target at the 0.618 Fibonacci ratio is wrong, it may still be too low. The lilac trend line has so far offered strong support, and it may continue to do so. If price moves lower to again touch this trend line, and if there is a zigzag for minute wave y that may be complete, then it may end there.
Minor wave 2 may not move beyond the start of minor wave 1 below 2,594.62.
SECOND ALTERNATE HOURLY CHART
Click chart to enlarge.
Minor wave 2 may be continuing further as a flat correction, and within it minute wave a may be a complete three, a double zigzag. Minute wave b may be moving a little higher as a single zigzag.
When minute wave b may be complete, then minute wave c may move lower to end at least slightly below the end of minute wave a at 2,676.81 to avoid a truncation. Minute wave c may end about either the lilac trend line, or the 0.618 Fibonacci ratio.
This wave count would see minor wave 2 continue further for several days.
If price makes a new high above 2,742.24 and exhibits weakness, or there are bearish signals from On Balance Volume or the AD line at that point, then this alternate may be correct. B waves should have something “wrong” about them; they should exhibit weakness.
TECHNICAL ANALYSIS
WEEKLY CHART
Click chart to enlarge. Chart courtesy of StockCharts.com.
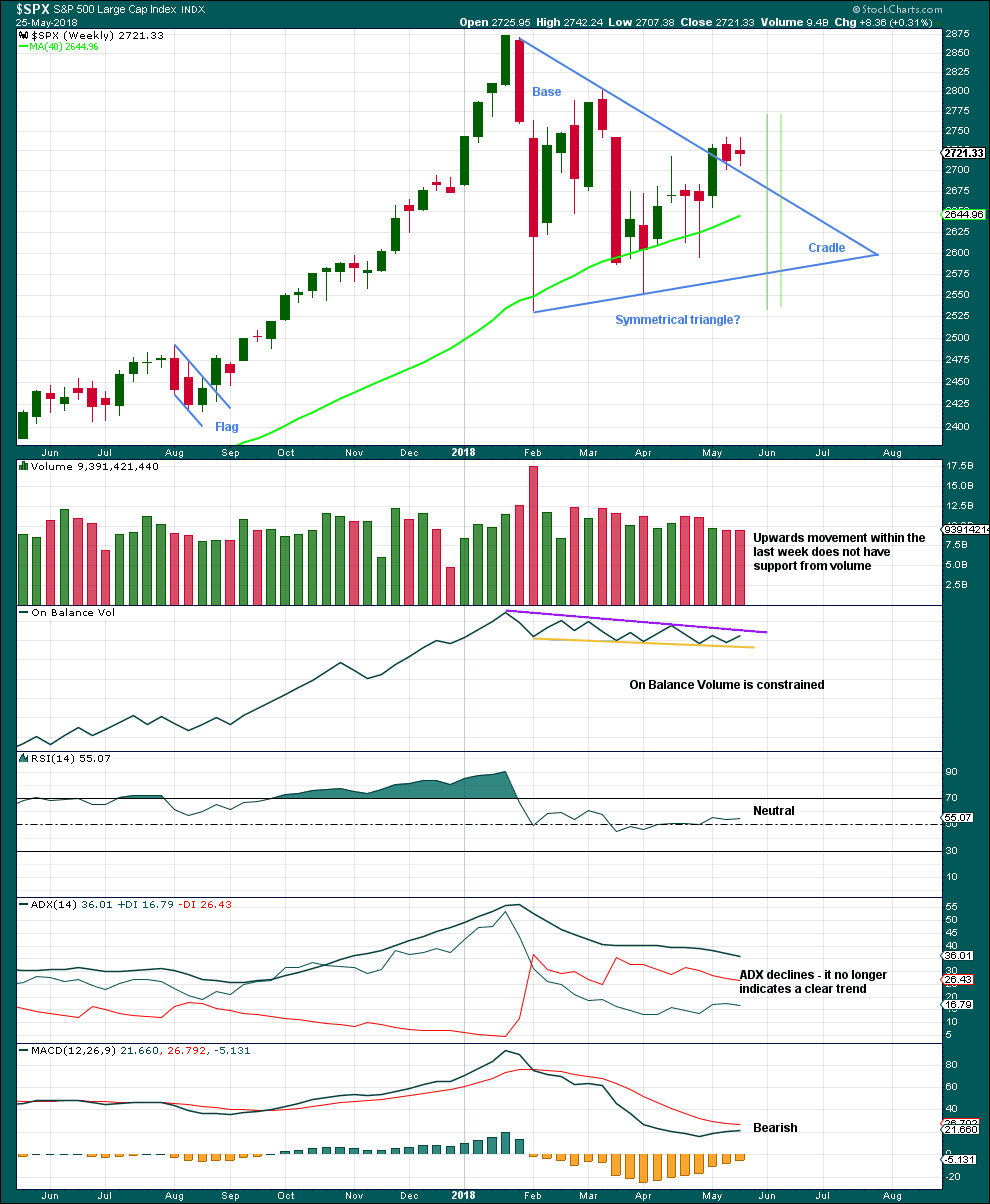
From Dhalquist and Kirkpatrick on trading triangles:
“The ideal situation for trading triangles is a definite breakout, a high trading range within the triangle, an upward-sloping volume trend during the formation of the triangle, and especially a gap on the breakout.”
For this example, the breakout may have now happened. There was a high trading range within the triangle, but volume declined. A downwards week may be a typical pullback following the breakout. If the pullback is not over, then expect support still about the upper edge of the symmetrical triangle top trend line.
DAILY CHART
Click chart to enlarge. Chart courtesy of StockCharts.com.
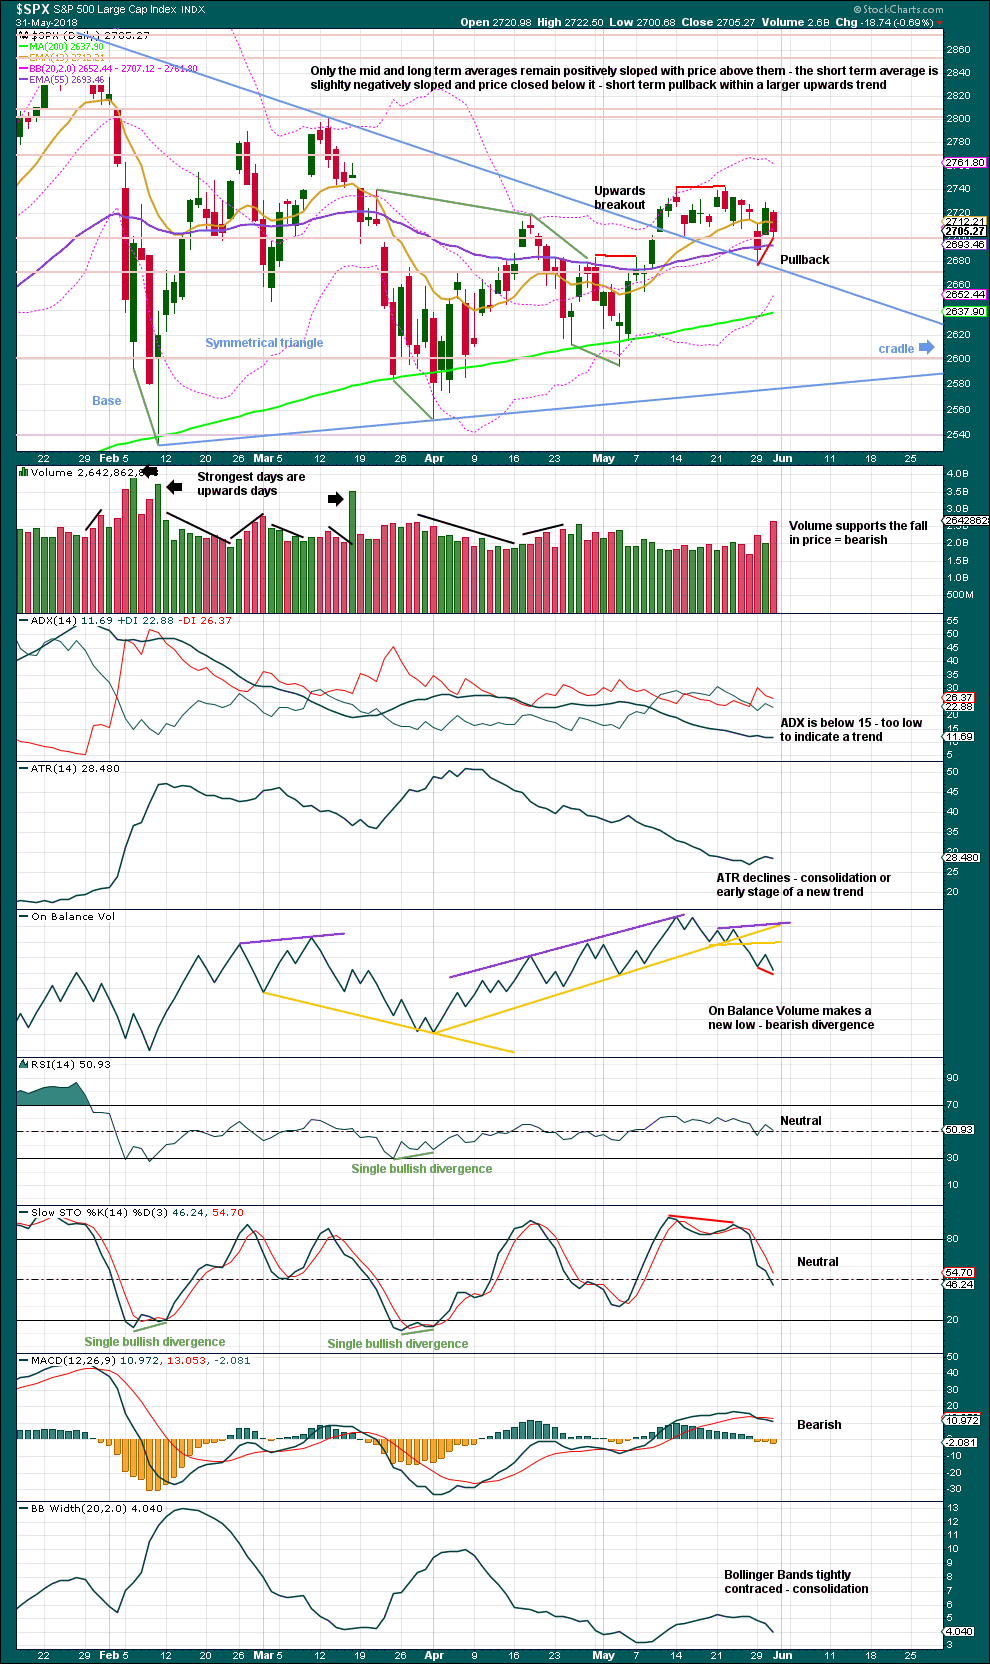
The symmetrical triangle may now be complete, and price has completed an upwards breakout. There may be some small cause for concern that the upwards breakout does not have support from volume. However, in current market conditions only some small concern is had here. Rising price on light and declining volume has been a feature of this market for years, yet price continues to rise.
After an upwards breakout, pullbacks occur 59% of the time. While the pullback may still be over at the last test of the upper triangle trend line, bearish volume and bearish divergence between price and On Balance Volume today suggest another test of that line may come in another one to very few days.
Symmetrical triangles suffer from many false breakouts. If price returns back into the triangle, then the breakout will be considered false and the triangle trend line will be redrawn.
The base distance is 340.18. Added to the breakout point of 2,704.54 this gives a target at 3,044.72. This is above the Elliott wave target at 2,922, so the Elliott wave target may be inadequate.
VOLATILITY – INVERTED VIX CHART
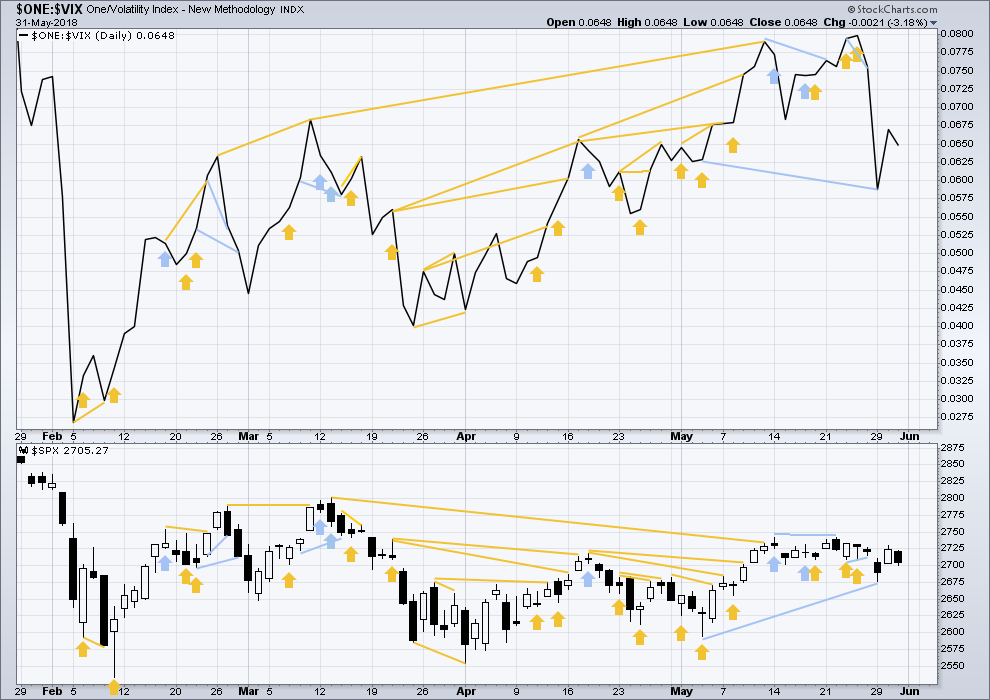
Click chart to enlarge. Chart courtesy of StockCharts.com. So that colour blind members are included, bearish signals
will be noted with blue and bullish signals with yellow.
Normally, volatility should decline as price moves higher and increase as price moves lower. This means that normally inverted VIX should move in the same direction as price.
Both price and inverted VIX moved lower today. There is no new divergence.
BREADTH – AD LINE
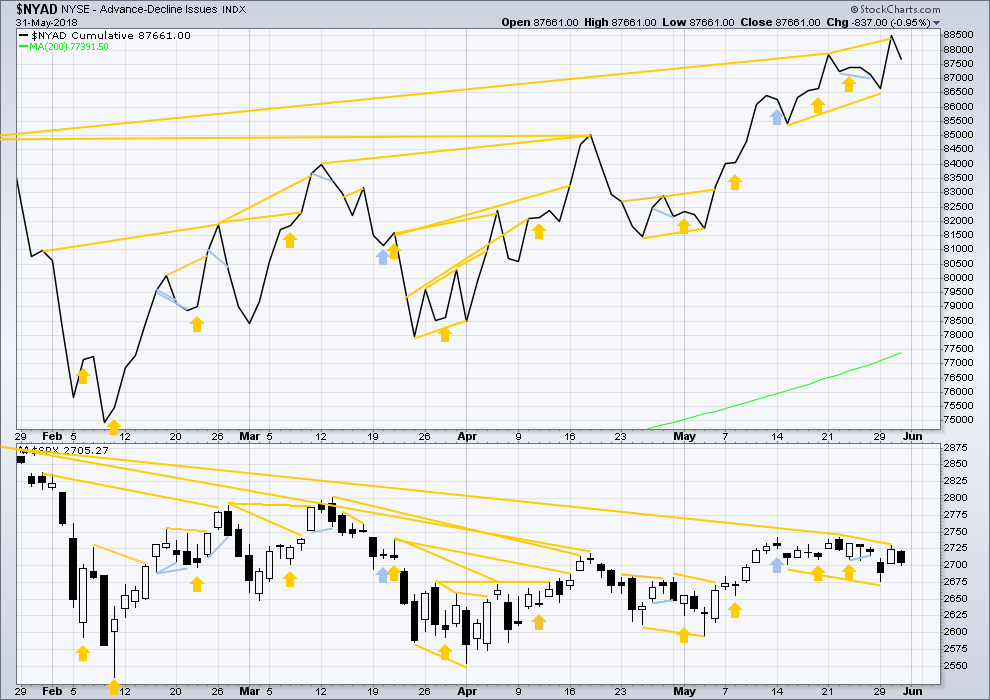
Click chart to enlarge. Chart courtesy of StockCharts.com.
There is normally 4-6 months divergence between price and market breadth prior to a full fledged bear market. This has been so for all major bear markets within the last 90 odd years. With no longer term divergence yet at this point, any decline in price should be expected to be a pullback within an ongoing bull market and not necessarily the start of a bear market. New all time highs from the AD line means that any bear market may now be an absolute minimum of 4 months away. It may of course be a lot longer than that. My next expectation for the end of this bull market may now be October 2019.
Small caps have made another new all time high, but mid and large caps have yet to do so. This divergence may be interpreted as bullish. Small caps may now be leading the market.
Breadth should be read as a leading indicator.
There has been a cluster of bullish signals from the AD line in the last few weeks. This also overall offers good support to the main Elliott wave count.
The new strong all time high is extremely bullish and supports the Elliott wave count, which expects price to follow through.
Both price and the AD line moved lower today. There is no new divergence in today’s movement.
DOW THEORY
The following lows need to be exceeded for Dow Theory to confirm the end of the bull market and a change to a bear market:
DJIA: 23,360.29.
DJT: 9,806.79.
S&P500: 2,532.69.
Nasdaq: 6,630.67.
At this stage, only DJIA has made a new major swing low. DJT also needs to make a new major swing low for Dow Theory to indicate a switch from a bull market to a bear market. For an extended Dow Theory, which includes the S&P500 and Nasdaq, these two markets also need to make new major swing lows.
Charts showing each prior major swing low used for Dow Theory may be seen at the end of this analysis here.
Published @ 07:55 p.m. EST.
This is the main preferred wave count.
A new high above minor 1 with some technical strength would be very bullish and would offer reasonable support to this wave count.
Thx Lara, Kevin, Verne…learning a lot !
Last two weeks have been really really nice $$$
Congrats Jules! There’s plenty for everyone.
Most welcome Jules!
Wish I could hang around a bit more with the posse!
Kevin doing a great job with the play by play! 🙂
Thanks Lara.
No fill on contingency order. A move back down to find support at the most recent gap would be a most encouraging development next week.
I am still waiting for a close above 2750 as there will be ample opportunity to ride the wave up to the projected target.
Have a great and restful weekend everyone!
You’re welcome everybody.
I have a rare small buy on the S&P which is positive. I’ll move my stop up to just above break even and wait for the impulse to be over before taking some profits.
Opening contingent order to buy SPY June 6 270 puts on any SPX move below 2720 before the close….
It is really quite remarkable when you look at a daily chart. RUT is really the only index that has decisively broken out from the sideways price action of the last several months…..
If a minuette i up just completed, the minuette ii should terminate around one of these fibo band areas. (If it’s a WXY minor 2…there’s lots more downside potential.) I will take a small short to capture the small and maybe larger move. The risk level is obvious, the R/R is good, and the likelihood of further movement down here is certainly over 50%. Resulting in a nice overall +EV setup.
I will short IF I get the right triggers. Nyet…
Shooting star on 1 hr chart…will they negate it?
Larger triangle invalidated with move above 2733.30.
Cautiously bullish. Looking for close above 2750 and VIX to head lower…
NDX over 7000 is Significant! Tech and financials rallying together is Significant (finance has been toast, obviously). The finance rally is linked to bonds strongly turning back down today. If that changes, this rally could be short lived. Overall…looks like the minor 3 just might be kicking off here. The 2738-42 resistance is the next key level. Until that’s broken…price will just settle back into the big 2700-2740 range.
And oh yes…don’t forget its FIBONACCI DAY!!! 6…1…8 (teen)!!! The next will be in ten years.
I certainly don’t want rain on anyone’s parade…but….please be sure stops are in place…
All I gotta say is buyer beware; see candles 10:15am-10:21am. If you still think the market has no manipulation……
Yes indeed! Danger everywhere.
The silence is deafening over what is going on with DB.
The chart of DB is what the chart of every major banking institution SHOULD look like. As goes DB, so goes the global financial community for their tentacles entertwine them all (think “derivatives). They let Lehman fold as they had Paulson to intimidate stupid compromised politicians into bailing out transfer of its liabilities and AIG. Trump? Good luck!
That cash dump was indeed spectacular. I thought the twin tail and wick were about to form the biggest, baddest, most brutal bearish engulfing candle have ever seen!
The volume profile suggesting that we are seeing a tempest in a teacup… 🙂
Contrary to public opinion, I don’t see the WXY combo 2 down as dead. To the contrary, the X wave is now properly in place as a zigzag. If (when?) price pushes above the current top of the minor 1, okay, it dies. But until that happens, I stay suspicious. I don’t see “3 power” quite yet that I would expect to see in a minute 3 of a minor 3. As Verne says, use stops, or you risk mgt tool of choice.
I’d prefer the bull case, but you have be aware of the possible alternatives and be ready to act if they develop.
Totally agree with your analysis at this point Kevin
Exceptional analysis Kevin, and I’m hesitating to jump back into VIX here after 3 in a row, but am placing stops to re-enter short index positions on a break of today’s low.
Thank you Chris, but honestly just healthy paranoia. Which this market has built up in me over the last 5 months with those violent swings down.
I’m at 2x my daily target, happy dance!
As for shorting, I’ve taken a small short or two and the market refuses to cooperate. I’m waiting for a stronger confirming signal before possibly trying again.
First alt gone, free ride to 2735
I think this morning’s open may be speaking loudly and clearly: “Minute iii of Minor 3 of Intermediate (5) up is underway!”
I went long at yesterday’s close acquiring the 2nd half of my long term account position. Average price is equivalent to 2720 SPX. This morning at the open I went long in my short term account using UPRO, entry of 47.35.
Have a good day all.
The deeper minor 2 down scenario. The set up seems almost to perfect for the market to pass up. A re-test of the TA triangle, completion of a 62% minor 2 (not a wimpy little 38%, that’s for 4’s), and a MAJOR trend change to occur exactly at the apex of the triangle, which as Lara has been noting is not uncommon. And there’s the 200 day moving average right there too (red ma), and the approaching bollinger’s (orange) and keltner (blue). A quick visit would shake out the weaker hands before the slingshot, turning over their shares to the smart money, who want lower prices for accumulation for the June 15 ex-dividend.
It’s a party the market just might insist on attending. I’ll be on the alert for weakness followed by high quality sell set ups and triggers.