
A lower low and a lower high fits the definition of downwards movement, which is what was expected for the session.
Summary: The main Elliott wave count expects some sideways movement for another few days, with support remaining about 2,701. An alternate Elliott wave count looks at the possibility that a third wave up may have just begun, with the target at 2,855.
If price makes a high above 2,742.24 with signs of strength, then the alternate will be favoured. Until that happens, the main wave count has a higher probability.
Pullbacks are an opportunity to join the trend.
The long to mid term Elliott wave target is at 2,922, and a classic analysis target is now at 3,045.
Always practice good risk management. Always trade with stops and invest only 1-5% of equity on any one trade.
New updates to this analysis are in bold.
The biggest picture, Grand Super Cycle analysis, is here.
Last historic analysis with monthly charts is here, video is here.
ELLIOTT WAVE COUNT
WEEKLY CHART
Click chart to enlarge.
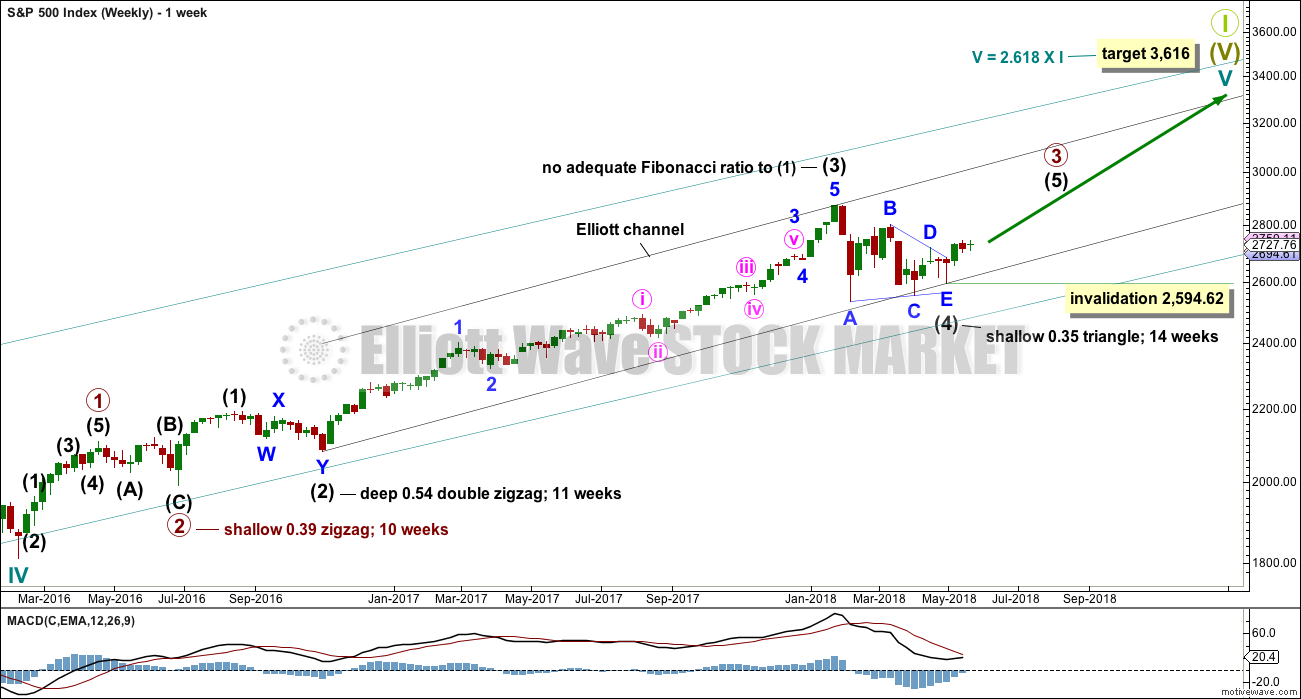
Cycle wave V must complete as a five structure, which should look clear at the weekly chart level. It may only be an impulse or ending diagonal. At this stage, it is clear it is an impulse.
Within cycle wave V, the third waves at all degrees may only subdivide as impulses.
Intermediate wave (4) has breached an Elliott channel drawn using Elliott’s first technique. The channel is redrawn using Elliott’s second technique: the first trend line from the ends of intermediate waves (2) to (4), then a parallel copy on the end of intermediate wave (3). Intermediate wave (5) may end either midway within the channel, or about the upper edge.
Intermediate wave (4) may now be a complete regular contracting triangle lasting fourteen weeks, one longer than a Fibonacci thirteen. There is perfect alternation and excellent proportion between intermediate waves (2) and (4).
If intermediate wave (4) were to continue further as either a flat or combination, both possibilities would require another deep pullback to end at or below 2,532.69. With both On Balance Volume and the AD line making new all time highs, that possibility looks extremely unlikely.
If intermediate wave (4) were to continue further, it would now be grossly disproportionate to intermediate wave (2). Both classic technical analysis and Elliott wave analysis now suggest these alternate ideas should be discarded based upon a very low probability.
Within intermediate wave (5), no second wave correction may move beyond the start of its first wave below 2,594.62.
DAILY CHART
Click chart to enlarge.
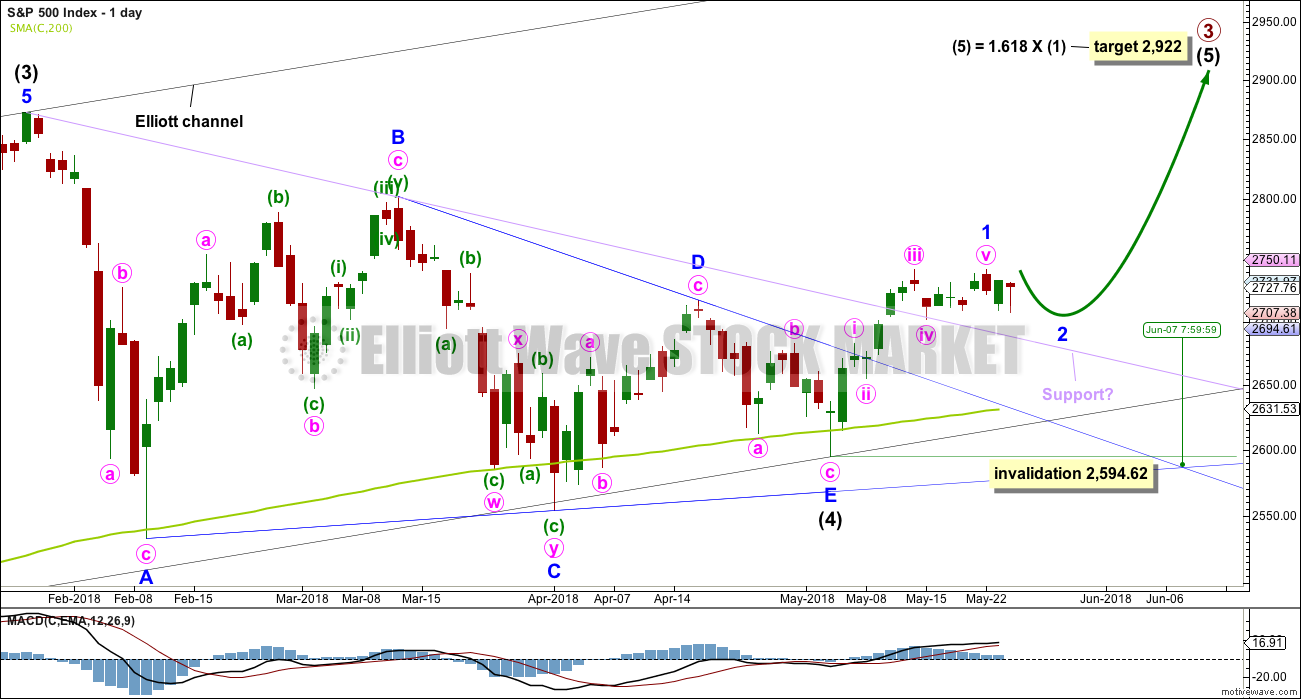
It is possible that intermediate wave (4) is a complete regular contracting triangle, the most common type of triangle. Minor wave E may have found support just below the 200 day moving average and ending reasonably short of the A-C trend line. This is the most common look for E waves of triangles.
Intermediate wave (3) exhibits no Fibonacci ratio to intermediate wave (1). It is more likely then that intermediate wave (5) may exhibit a Fibonacci ratio to either of intermediate waves (1) or (3). The most common Fibonacci ratio would be equality in length with intermediate wave (1), but in this instance that would expect a truncation. The next common Fibonacci ratio is used to calculate a target for intermediate wave (5) to end.
Price has clearly broken out above the upper triangle B-D trend line. This indicates that it should now be over if the triangle is correctly labelled.
A trend line in lilac is added to this chart. It is the same line as the upper edge of the symmetrical triangle on the daily technical analysis chart. Upwards movement has sliced cleanly through this line, finding no resistance before breaking it. This line may offer some support for any pullbacks. Price is finding support at that line so far. A breach of that line does not mean the classic triangle is invalid and that price must make new lows, only that the pullback is deeper. Look for next support at the blue Elliott wave triangle B-D trend line.
Sometimes the point at which the triangle trend lines cross over sees a trend change. A trend change at that point may be a minor one or a major one. That point is now about the 7th of June.
HOURLY CHART
Click chart to enlarge.
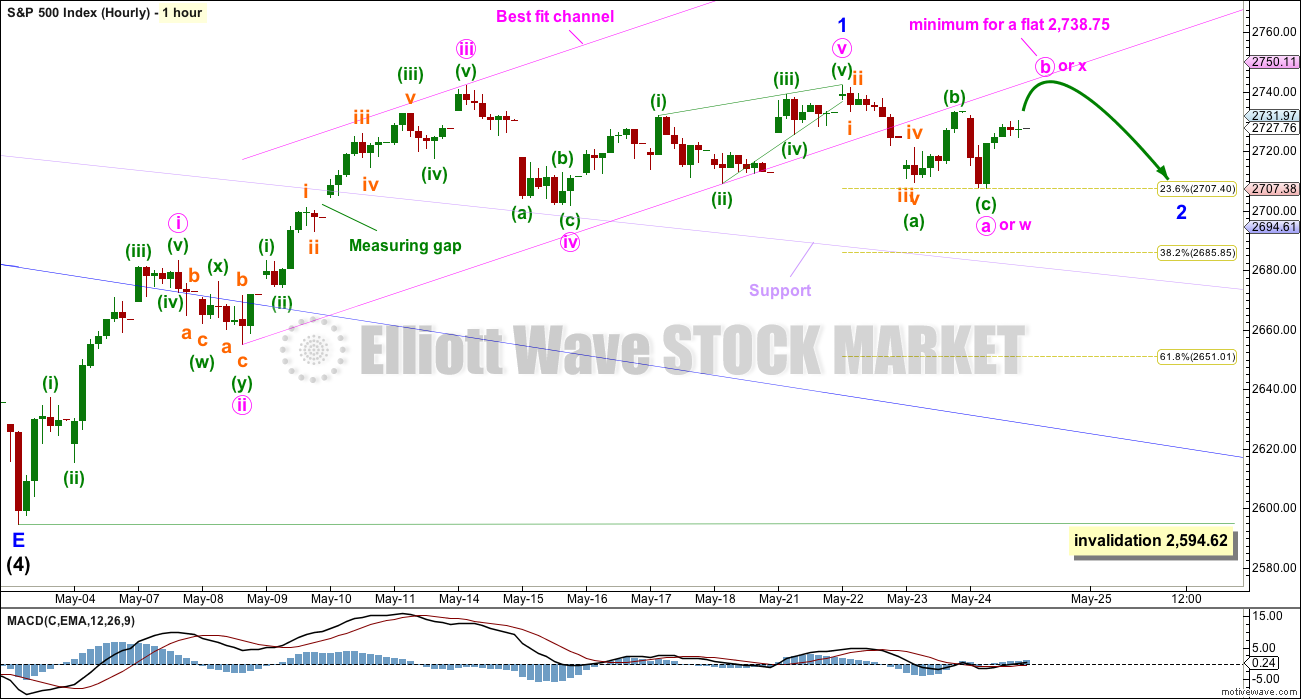
Minor wave 1 may have been over. Now minor wave 2 may be continuing.
Minor wave 2 may be about halfway through. Minor wave 2 would have better proportion to minor wave 1 if it were to continue further for a few days. It may be unfolding as a flat correction or a combination.
If minor wave 2 is a flat correction, then within it minute wave b must retrace a minimum 0.9 length of minute wave a. Minute wave b may be any corrective structure, and it may make a new high above minute wave a at 2,742.24 as in an expanded flat. The most common length for B waves within flats is from 1 to 1.38 times the length of wave A, giving a minute wave b a common range from 2,742.24 to 2,755.49. If minor wave 2 is a flat correction, then minute wave b within it should exhibit weakness.
If minor wave 2 is a combination, then the first structure in a double may be a complete zigzag labelled minute wave w. The double may be joined by a three in the opposite direction labelled minute wave x. Minute wave x has no minimum requirement to minute wave w, and it may make a new high above the start of minute wave w at 2,742.24. The second structure in a double combination may be a flat or a triangle and would be labeled minute wave y.
Both flats and combinations are sideways structures, except for expanded flats. At this stage, so far the last gap in the prior wave upwards labelled a measuring gap remains open. This is so far providing support. If it continues to do so, then minor wave 2 may move only sideways.
ALTERNATE HOURLY CHART
Click chart to enlarge.
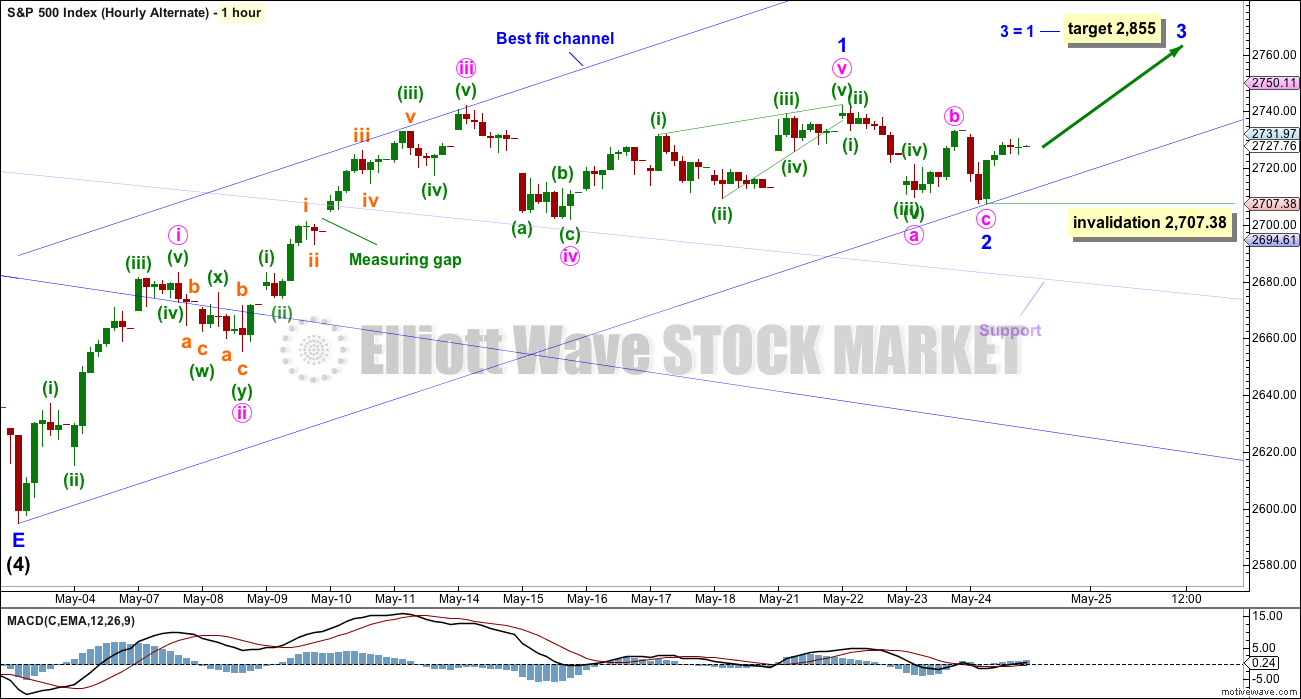
This alternate wave count is identical to the main hourly wave count with the exception of the degree of labelling within minor wave 2.
It is possible that minor wave 2 is over as a very brief and shallow zigzag. Minor wave 3 may have begun today. The target for minor wave 3 to end is equality in length with minor wave 1, because minor wave 2 was shallow.
This wave count at this stage must be judged as less likely than the main wave count because of the brevity of minor wave 2.
If price makes a new high above 2,742.24 with support from volume and a bullish signal from one of the AD line or On Balance Volume, then this wave count would increase in probability.
TECHNICAL ANALYSIS
WEEKLY CHART
Click chart to enlarge. Chart courtesy of StockCharts.com.
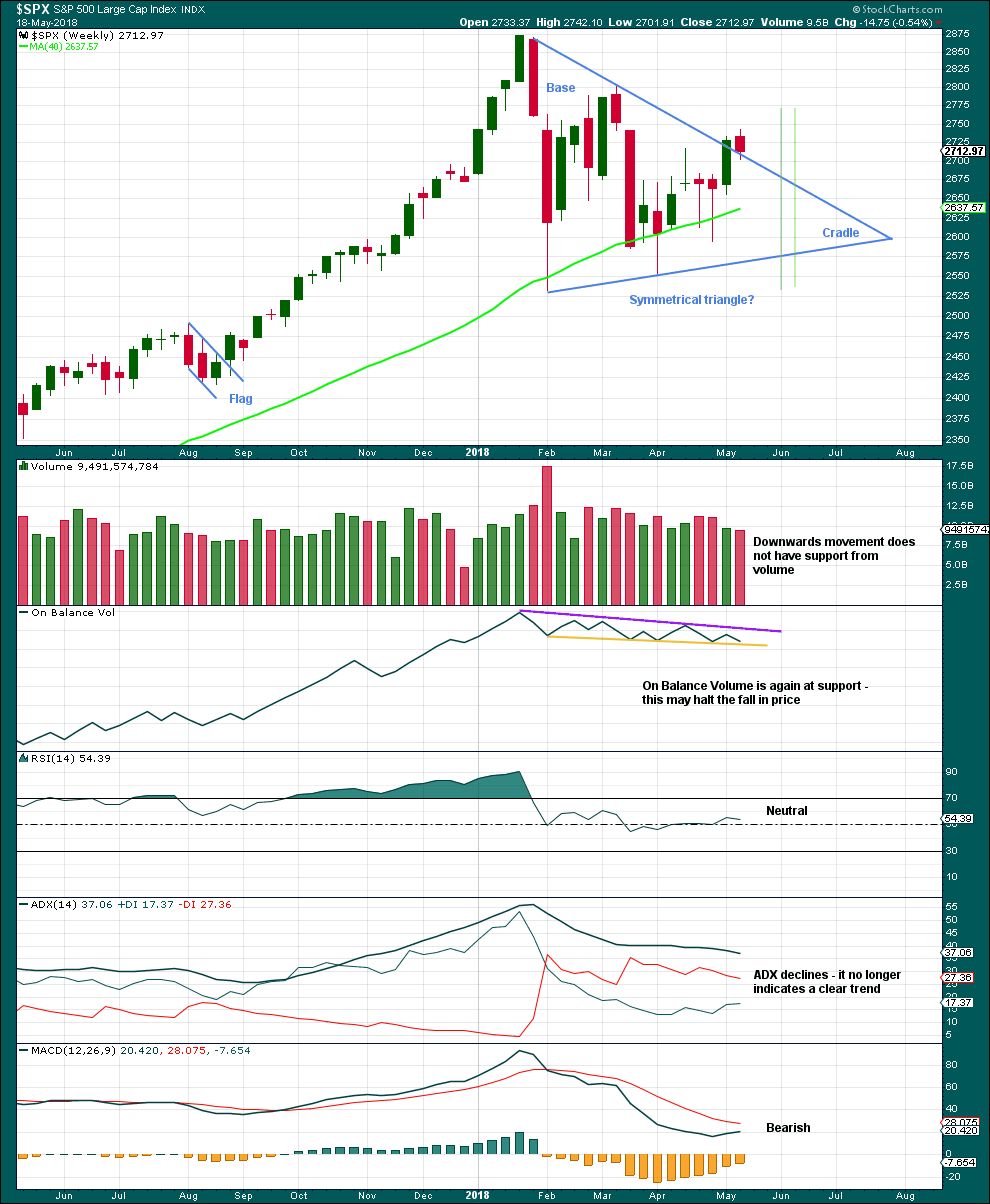
From Dhalquist and Kirkpatrick on trading triangles:
“The ideal situation for trading triangles is a definite breakout, a high trading range within the triangle, an upward-sloping volume trend during the formation of the triangle, and especially a gap on the breakout.”
For this example, the breakout may have now happened. There was a high trading range within the triangle, but volume declined. A downwards week may be a typical pullback following the breakout.
DAILY CHART
Click chart to enlarge. Chart courtesy of StockCharts.com.
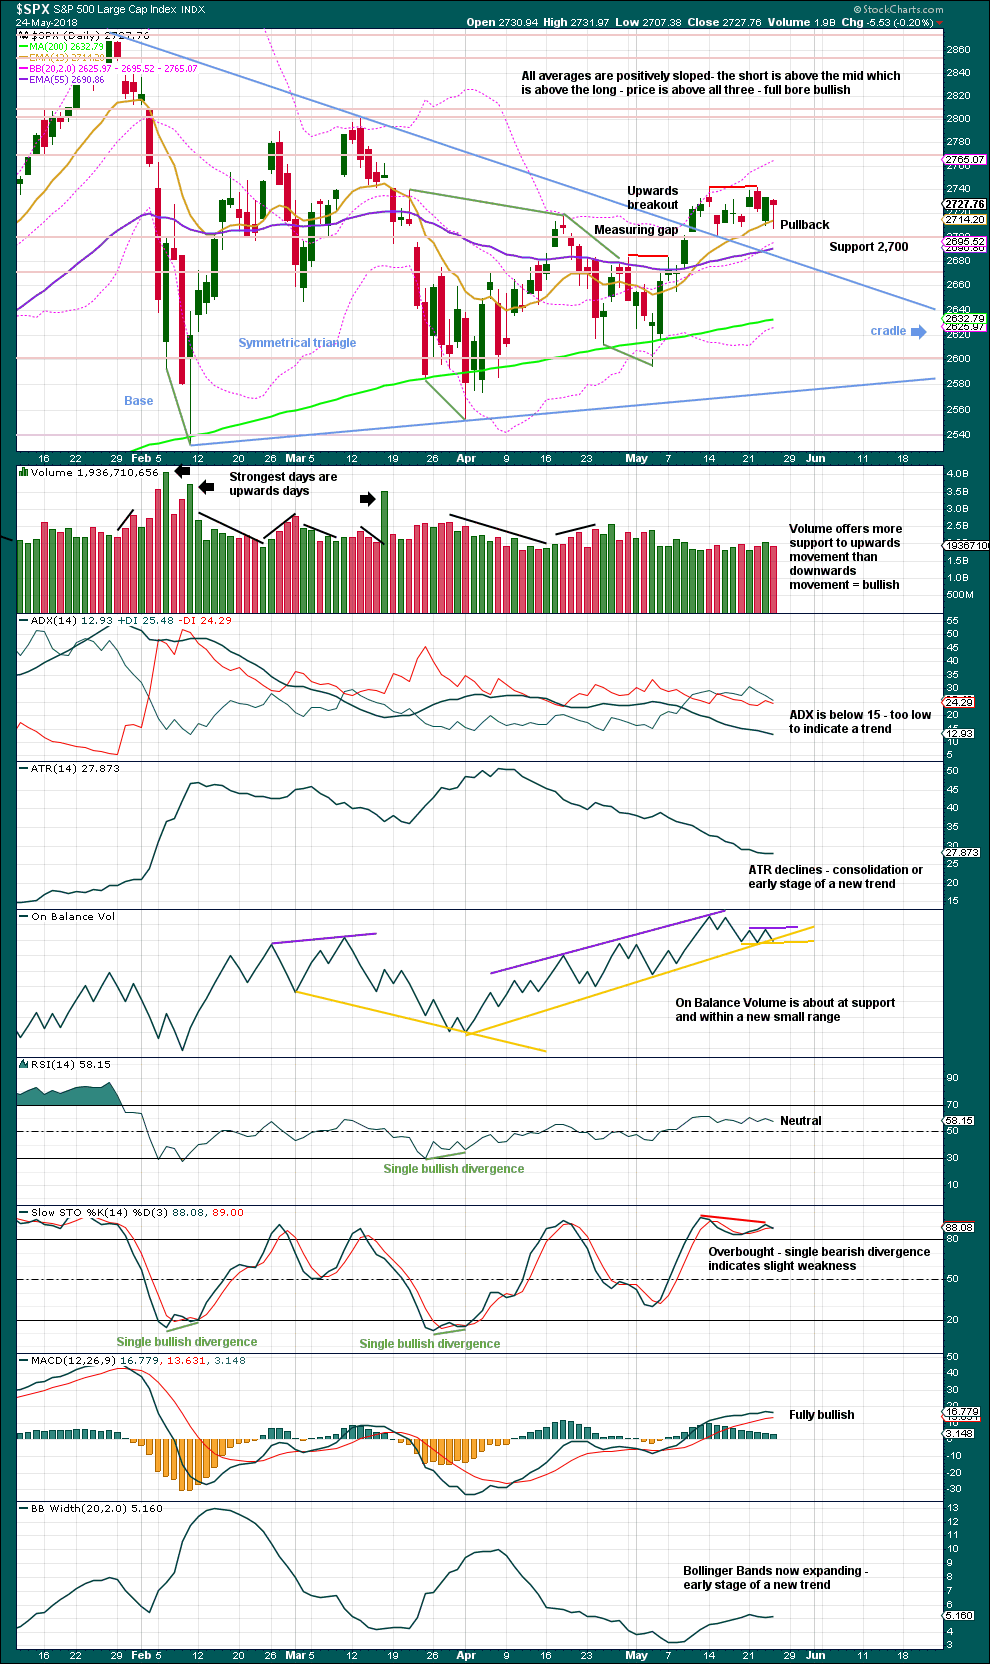
The symmetrical triangle may now be complete, and price has completed an upwards breakout. There may be some small cause for concern that the upwards breakout does not have support from volume. However, in current market conditions only some small concern is had here. Rising price on light and declining volume has been a feature of this market for years, yet price continues to rise.
After an upwards breakout, pullbacks occur 59% of the time. A pullback may find support at the upper triangle trend line and may be used as an opportunity to join a trend.
Symmetrical triangles suffer from many false breakouts. If price returns back into the triangle, then the breakout will be considered false and the triangle trend line will be redrawn.
The base distance is 340.18. Added to the breakout point of 2,704.54 this gives a target at 3,044.72. This is above the Elliott wave target at 2,922, so the Elliott wave target may be inadequate.
For the short term, the next smaller consolidation or pullback may come about 2,811. This shorter term target is calculated using the measuring gap. Look now for the lower end of the gap at 2,701.27 to provide support.
The new small range for On Balance Volume has better technical significance than the longer upwards sloping support line.
VOLATILITY – INVERTED VIX CHART
Click chart to enlarge. Chart courtesy of StockCharts.com. So that colour blind members are included, bearish signals
will be noted with blue and bullish signals with yellow.
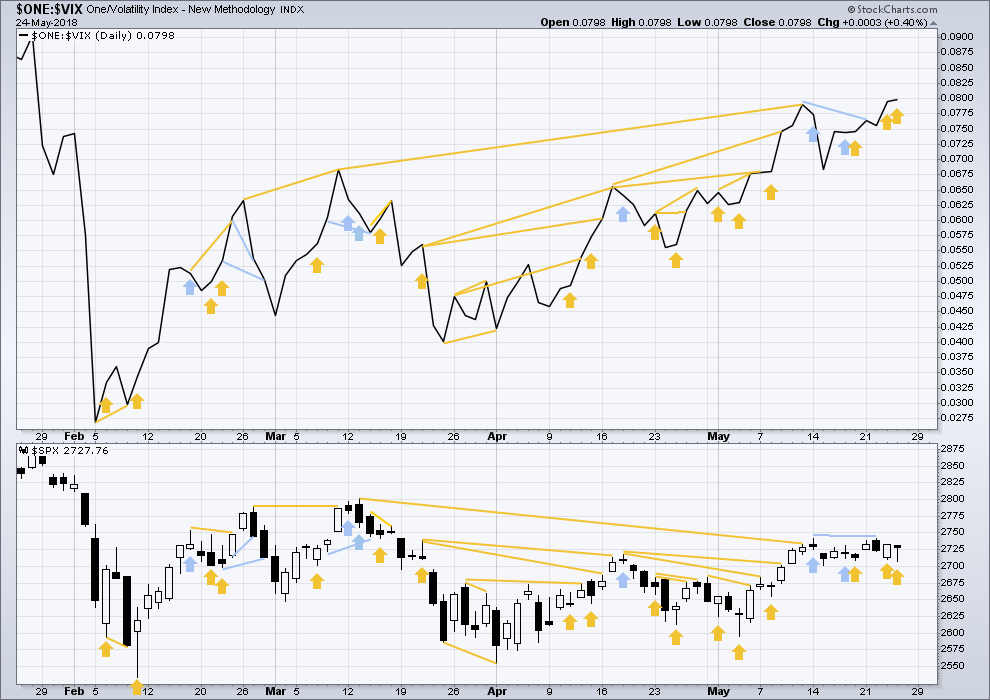
Normally, volatility should decline as price moves higher and increase as price moves lower. This means that normally inverted VIX should move in the same direction as price.
There is still a cluster of bullish signals on inverted VIX. Overall, this may offer support to the main Elliott wave count.
Inverted VIX is much higher than the prior swing high of the 9th / 13th March, but price is not yet. Reading VIX as a leading indicator, this divergence is bullish.
Price again today moved lower, but inverted VIX moved higher. Upwards movement during the session had support from declining market volatility. This divergence is bullish and has now run for two days in a row. This supports the alternate hourly Elliott wave count.
BREADTH – AD LINE
Click chart to enlarge. Chart courtesy of StockCharts.com.
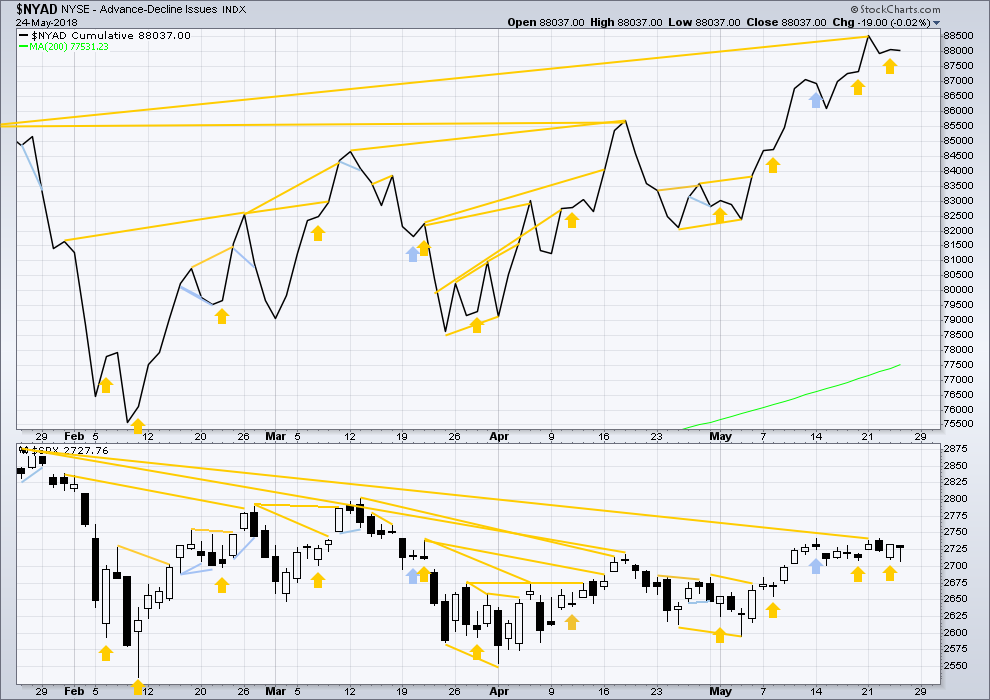
There is normally 4-6 months divergence between price and market breadth prior to a full fledged bear market. This has been so for all major bear markets within the last 90 odd years. With no longer term divergence yet at this point, any decline in price should be expected to be a pullback within an ongoing bull market and not necessarily the start of a bear market. New all time highs from the AD line means that any bear market may now be an absolute minimum of 4 months away. It may of course be a lot longer than that. My next expectation for the end of this bull market may now be October 2019.
Small caps continue to make new all time highs, but mid and large caps have yet to do so. This divergence may be interpreted as bullish. Small caps may now be leading the market.
Breadth should be read as a leading indicator.
There has been a cluster of bullish signals from the AD line in the last few weeks. This also overall offers good support to the main Elliott wave count.
The new strong all time high is extremely bullish and supports the Elliott wave count, which expects price to follow through.
Bullish divergence noted in yesterday’s analysis has not been followed yet by upwards movement. It may have failed, or it may still offer support to the alternate hourly Elliott wave count. Price today moved lower and the AD line moved slightly lower. The downwards movement of price today has support from declining market breadth, which is bearish.
DOW THEORY
The following lows need to be exceeded for Dow Theory to confirm the end of the bull market and a change to a bear market:
DJIA: 23,360.29.
DJT: 9,806.79.
S&P500: 2,532.69.
Nasdaq: 6,630.67.
At this stage, only DJIA has made a new major swing low. DJT also needs to make a new major swing low for Dow Theory to indicate a switch from a bull market to a bear market. For an extended Dow Theory, which includes the S&P500 and Nasdaq, these two markets also need to make new major swing lows.
Charts showing each prior major swing low used for Dow Theory may be seen at the end of this analysis here.
Published @ 06:34 p.m. EST.
Main count updated:
To the upside today, minute b or x (pink) has not yet reached the minimum 0.9 requirement at 2,728.75. And so if minor 2 is unfolding as a flat correction, then minute b must be incomplete.
It looks like a time consuming b (or x) wave is still unfolding. It may take another day to few to complete.
I think we may see choppy overlapping sideways movement for most of next week now.
Think of it as an opportunity to join the new upwards trend at a very good price, when price reaches close to support.
Thank u for update before close! Very helpful
as always, you’re most welcome.
it’s my job
I spent a happy couple of hours doing some work for research on EW structures yesterday, results coming to a website near you very soon!
Yep… this is exactly what I was starting to think.
2738.75 (typo)
If the C down completes today as I suspect it will, we will be seeing some serious droopage into the close. Keep and eye on VIX as it will turn just before the wave down is done to give a heads up we are almost there….
I am going to slip that confirmation pivot a bit lower to the 2712 number where price meets the 100 day SMA.
I am starting to think that we do indeed have a C wave as per Lara’s main count.
A look at a few other indices strongly supports that view.
I suspect they want to hold of the wave completion until close to the end of the cash session and spring a nasty bear trap going into next week.
If that is what is going on, it presents an opportunity for some precision strikes as the wave down unfolds close to the end of the cash session. A great example of remaining patient for Mr. Market to show his hand…. 🙂
Verne, im confused here by your statement. Lara said we had a C yesterday but was expecting some sideways…are you in agreement or saying we have one more trip south?
In Lara’s main hourly, this correction is “complex” (WXY structure), and I believe what Verne is calling a C down would be Lara’s Y down.
Also possible a minute C of minor two….
not yet, too early.
still in minute b or x I think…
Yep. ES looks a bit different. I thought we had at least 90% there but perhaps not quite.
Ultimately, the C wave will need to make a new low…unless it truncates….
Got it …thx
How price closes today is important. It may signal an opportunity to get positioned for a powerful move higher next Tuesday, OR, it could signal that we head back down to tag the 200 day once more…
Above pivot ? Or above 2720?
ES has surrendered 2720.00 Let see if the cash session follows suit and takes out the 2713.12 pivot….
You really do have to smile. Look at these goons! Where do they get the money??!!! 🙂
CONTROL P
Then 32X! 🙂
A break of 2713.12 should see a pick up in the pace….
Taking some cues from Verne…had a underwater GS back ratio spread, GS pulled back for 2+ weeks to 62% retrace, so I bought back one leg for a fat profit today, and I have EW confidence that by Sept I’ll be at least even on the long calls. I like it!
There you go Kevin!!! Cheers!
Slowly getting some chops…what’s Gladwell say, 10,000 hours at anything to be an expert? I have a few more to go…lol!!!!
Sweet! I love it!
You will kick the market makers’ Gluteus Maximus every time with that slick move. Haha!
Nested first and second waves to keep the crowd distracted…. 🙂
That’s what I’m seeing as well, if the banksters back off a quick trip 2670ish at least.
They seem determined to forestall the wave’s completion until closer to the end of the session…just to keep the herd bamboozled! Typical! 🙂
I don’t think this market is going to break down out of this daily range. I think it’s going to break up (but not today). The dominant monthly and weekly trends are clearly up. The inability of the market to even execute a deeper 2 here, much less a truly bearish major swing down in the course of 2 weeks, puts the preponderance of the evidence on the bull side IMO. There’s lots (and growing) pent up energy in the market. I think it will be expended on a fresh bull run soon. Could be wrong!!!
The lower low yesterday gave it away. I know they are really fighting it, but if EW means anything, we need a new low…..
Okay, I can buy that. That wouldn’t even be breaking the daily range which currently has a low of 2702.08 printed on May 15. I can certainly see a sell off towards the bottom of the downtrending channel. In fact I quite agree now that price has banged against and turned down from the upper channel line…I took a little short to join in the fun.
As I said, I don’t think this market is going anywhere today, not much much down, and not up. I made enough on my SPX short for a cup of coffee and a pastry; I call that a success!
“if EW means anything, we need a new low”
not if it’s a combination: zigzag – x – flat
the zigzag is minute w
minute x is incomplete, a zigzag upwards
minute y may be a flat (most likely) or a triangle (unlikely but possible) and may end about the same level as minute w at 2,707.38 which means it could end a bit above that point and the count could be valid and complete
exactly, this is the alternate we need to be aware of, this is possible
A third down…if of a C, look for VIX spike….
TLT as expected bumped up against it’s 62% fibo zone this morning and and initiated a possible turn back down. Took my TMF…on further short triggers will add to my TMV.
An hourly view.
Guten Morgen!
I suspect we complete the C wave down in the a.m., with the current theme of sharp intra-day reversals continuing to play out. Holiday week-ends tend to be bullish. I will be exiting remaining short calls of my bearish call spreads on the first tick past yesterday’s low.
Have a wonderful memorial day weekend everyone, and a most profitable conclusion to your trading week. Lock and Load!
What you think Verne, VIX positions up 7% from re-enter on close yesterday, tag for the third time this week or maintain? Signal target is a bit above 16, but will all know that’s very improbable in the short term considering the action of late.
I think it very much depends on whether we are starting a C or a third wave down. A C wave should produce a long upper wick with divergent momo, and I suspect if a C no, as it does not complete before next Tuesday. A fat green VIX candle means batten down the hatches!
Yes, holding for now. Added a touch to my june bull put spread on UVXY.
Oops…I meant to say “If a third…no”