
A signal today from On Balance Volume and VIX gives an indication of the direction for tomorrow. So far price is behaving mostly as expected, and the Elliott wave count remains the same at the daily chart level.
Summary: Look for a pullback tomorrow which may end about 2,686. The pullback may find support at the lilac trend line, but the next target would be about 2,651 if it breaks below that line; this looks less likely at this stage.
Pullbacks are an opportunity to join the trend.
The long to mid term Elliott wave target is at 2,922, and a classic analysis target is now at 3,045.
Always practice good risk management. Always trade with stops and invest only 1-5% of equity on any one trade.
New updates to this analysis are in bold.
The biggest picture, Grand Super Cycle analysis, is here.
Last historic analysis with monthly charts is here, video is here.
ELLIOTT WAVE COUNT
WEEKLY CHART
Click chart to enlarge.
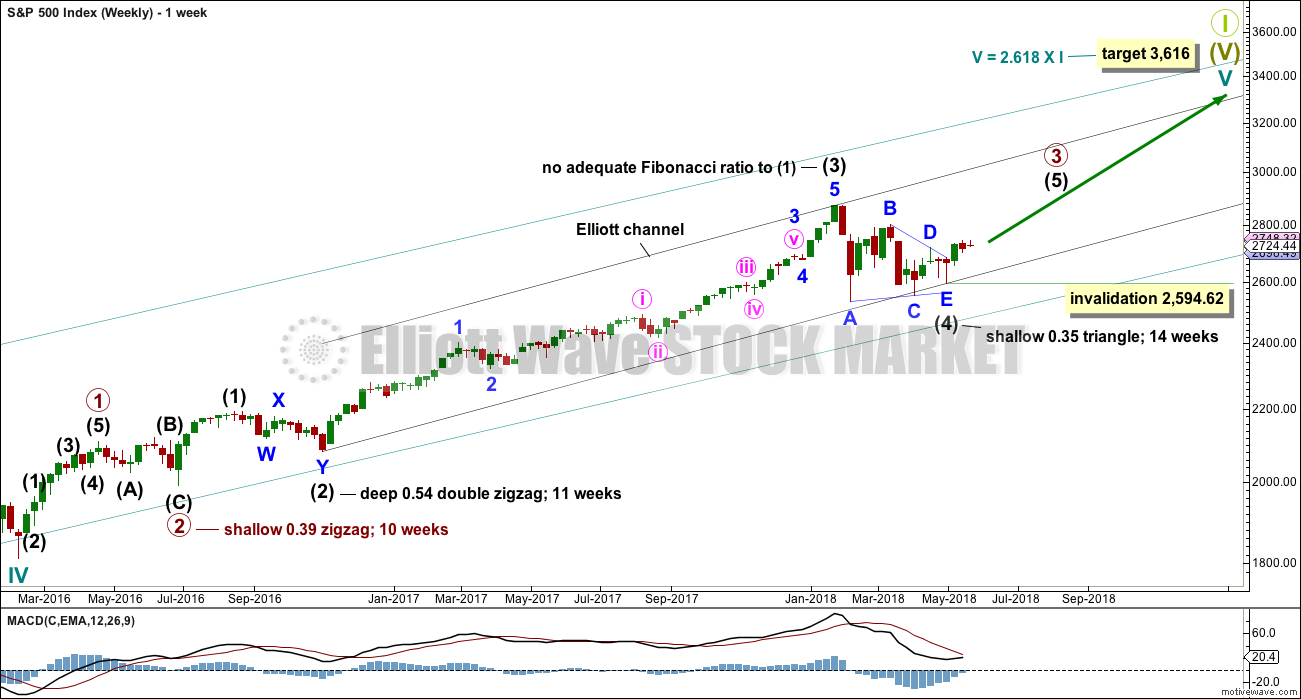
Cycle wave V must complete as a five structure, which should look clear at the weekly chart level. It may only be an impulse or ending diagonal. At this stage, it is clear it is an impulse.
Within cycle wave V, the third waves at all degrees may only subdivide as impulses.
Intermediate wave (4) has breached an Elliott channel drawn using Elliott’s first technique. The channel is redrawn using Elliott’s second technique: the first trend line from the ends of intermediate waves (2) to (4), then a parallel copy on the end of intermediate wave (3). Intermediate wave (5) may end either midway within the channel, or about the upper edge.
Intermediate wave (4) may now be a complete regular contracting triangle lasting fourteen weeks, one longer than a Fibonacci thirteen. There is perfect alternation and excellent proportion between intermediate waves (2) and (4).
If intermediate wave (4) were to continue further as either a flat or combination, both possibilities would require another deep pullback to end at or below 2,532.69. With both On Balance Volume and the AD line making new all time highs, that possibility looks extremely unlikely.
If intermediate wave (4) were to continue further, it would now be grossly disproportionate to intermediate wave (2). Both classic technical analysis and Elliott wave analysis now suggest these alternate ideas should be discarded based upon a very low probability.
Within intermediate wave (5), no second wave correction may move beyond the start of its first wave below 2,594.62.
DAILY CHART
Click chart to enlarge.
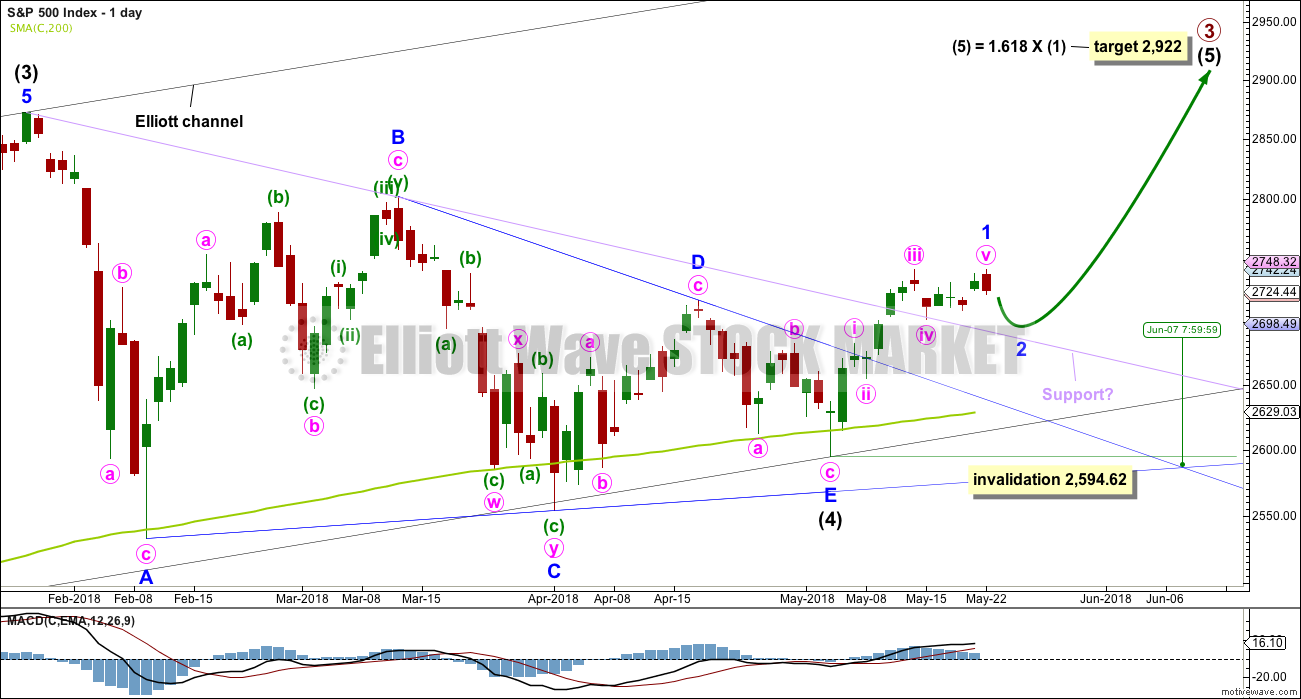
It is possible that intermediate wave (4) is a complete regular contracting triangle, the most common type of triangle. Minor wave E may have found support just below the 200 day moving average and ending reasonably short of the A-C trend line. This is the most common look for E waves of triangles.
Intermediate wave (3) exhibits no Fibonacci ratio to intermediate wave (1). It is more likely then that intermediate wave (5) may exhibit a Fibonacci ratio to either of intermediate waves (1) or (3). The most common Fibonacci ratio would be equality in length with intermediate wave (1), but in this instance that would expect a truncation. The next common Fibonacci ratio is used to calculate a target for intermediate wave (5) to end.
Price has clearly broken out above the upper triangle B-D trend line. This indicates that it should now be over if the triangle is correctly labelled.
A trend line in lilac is added to this chart. It is the same line as the upper edge of the symmetrical triangle on the daily technical analysis chart. Upwards movement has sliced cleanly through this line, finding no resistance before breaking it. This line may offer some support for any pullbacks. Price is finding support at that line so far. A breach of that line does not mean the classic triangle is invalid and that price must make new lows, only that the pullback is deeper. Look for next support at the blue Elliott wave triangle B-D trend line.
Sometimes the point at which the triangle trend lines cross over sees a trend change. A trend change at that point may be a minor one or a major one. That point is now about the 7th of June.
HOURLY CHART
Click chart to enlarge.
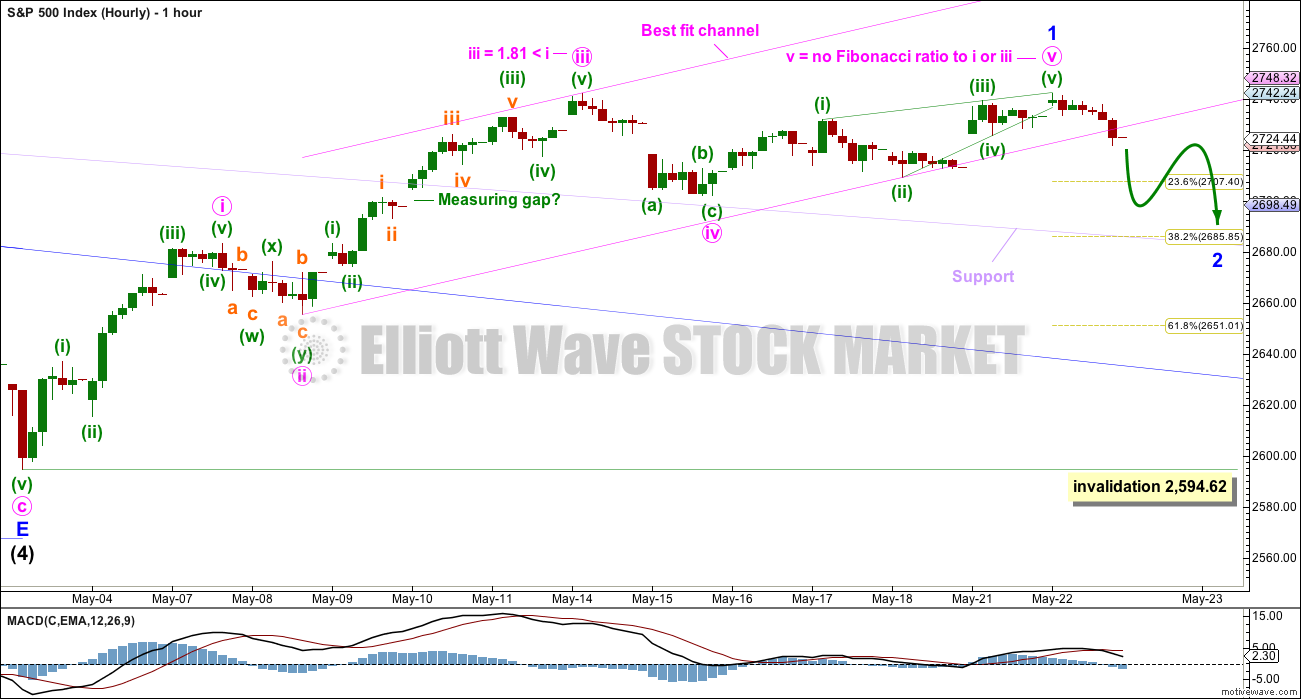
A slight bearish signal from On Balance Volume today, and a new low below 2,731.96 at the end of the session, indicates minor wave 1 may be over and minor wave 2 may now have arrived.
Minute wave v may have completed as an ending contracting diagonal, making a very slight new high above the end of minute wave iii. The diagonal is valid, but the breaches of the (ii)-(iv) trend line do not look typical.
If minor wave 2 finds support at the lilac trend line, then it may only reach down to about the 0.382 Fibonacci ratio of minor wave 1 at about 2,686. If this target is wrong, it may be too low. There may be support at the last gap, which remains open and has its lower edge at 2,701.27. Minor wave 2 may not move beyond the start of minor wave 1 below 2,594.62.
Do not expect minor wave 2 to move in a straight line. It may be choppy and overlapping, with a bounce for wave B within it. Minor wave 1 lasted a Fibonacci 13 days. Minor wave 2 may total a Fibonacci 3, 5, 8 or 13 days. It may be more brief and shallow than second waves normally are.
TECHNICAL ANALYSIS
WEEKLY CHART
Click chart to enlarge. Chart courtesy of StockCharts.com.
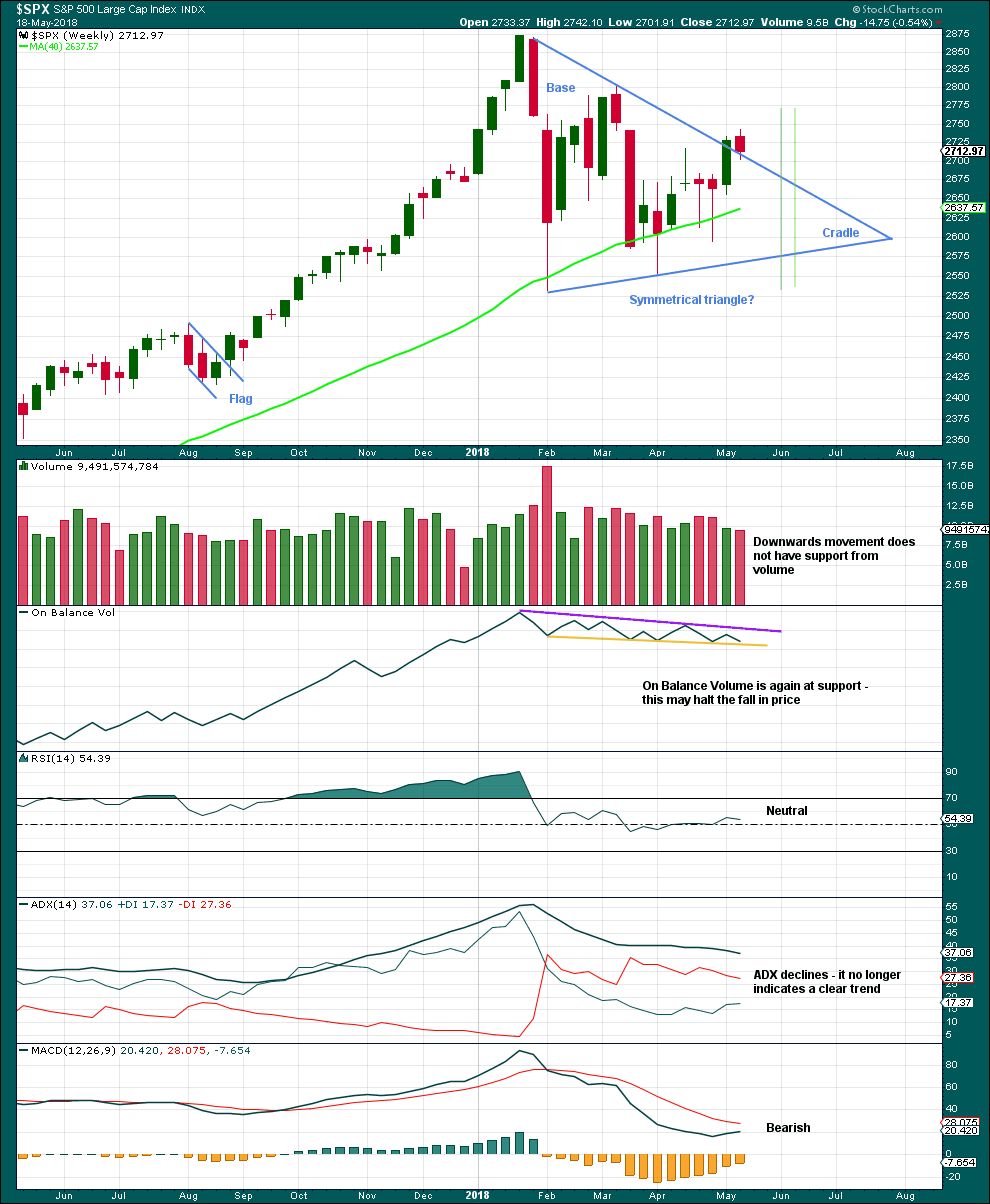
From Dhalquist and Kirkpatrick on trading triangles:
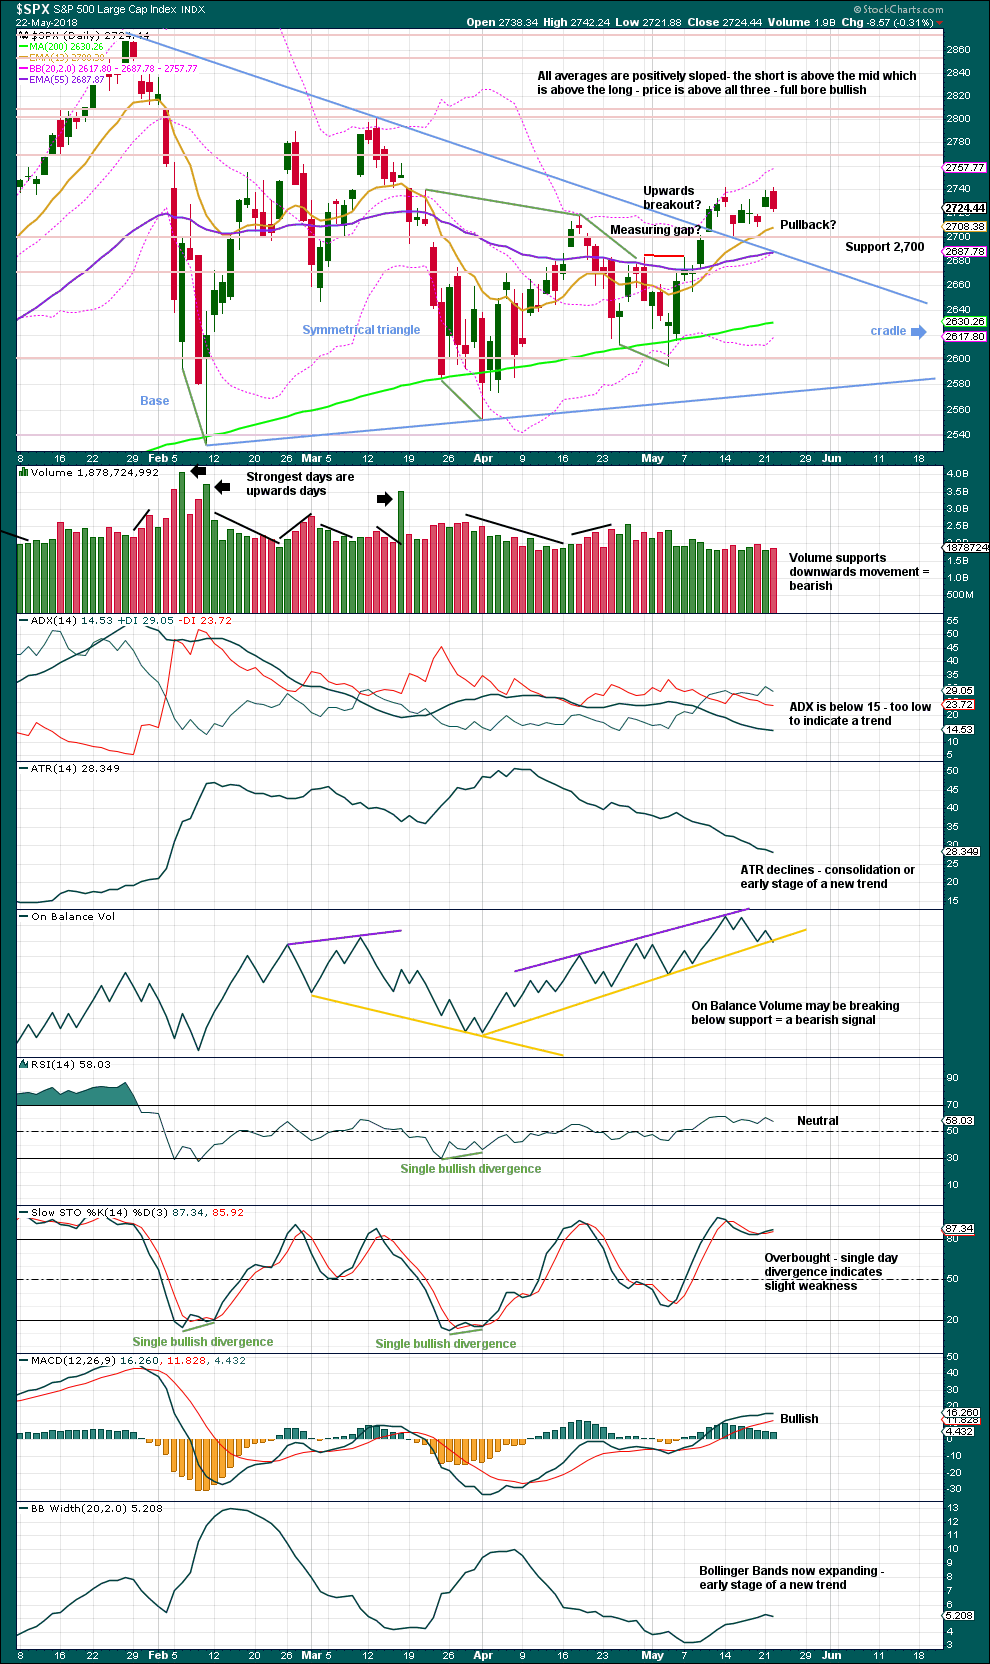
“The ideal situation for trading triangles is a definite breakout, a high trading range within the triangle, an upward-sloping volume trend during the formation of the triangle, and especially a gap on the breakout.”
For this example, the breakout may have now happened. There was a high trading range within the triangle, but volume declined. A downwards week may be a typical pullback following the breakout.
DAILY CHART
Click chart to enlarge. Chart courtesy of StockCharts.com.
The symmetrical triangle may now be complete, and price has completed an upwards breakout. There may be some small cause for concern that the upwards breakout does not have support from volume. However, in current market conditions only some small concern is had here. Rising price on light and declining volume has been a feature of this market for years, yet price continues to rise.
After an upwards breakout, pullbacks occur 59% of the time. A pullback may find support at the upper triangle trend line and may be used as an opportunity to join a trend.
Symmetrical triangles suffer from many false breakouts. If price returns back into the triangle, then the breakout will be considered false and the triangle trend line will be redrawn.
The base distance is 340.18. Added to the breakout point of 2,704.54 this gives a target at 3,044.72. This is above the Elliott wave target at 2,922, so the Elliott wave target may be inadequate.
For the short term, the next smaller consolidation or pullback may come about 2,811. This shorter term target is calculated using the measuring gap. Look now for the lower end of the gap at 2,701.27 to provide support.
On Balance Volume today may be breaking below support, but so far this is not clear. The yellow line may need to be very slightly adjusted. If tomorrow sees another red daily candlestick, then this signal would be clearer. The short term volume profile today is slightly bearish.
VOLATILITY – INVERTED VIX CHART
Click chart to enlarge. Chart courtesy of StockCharts.com. So that colour blind members are included, bearish signals
will be noted with blue and bullish signals with yellow.
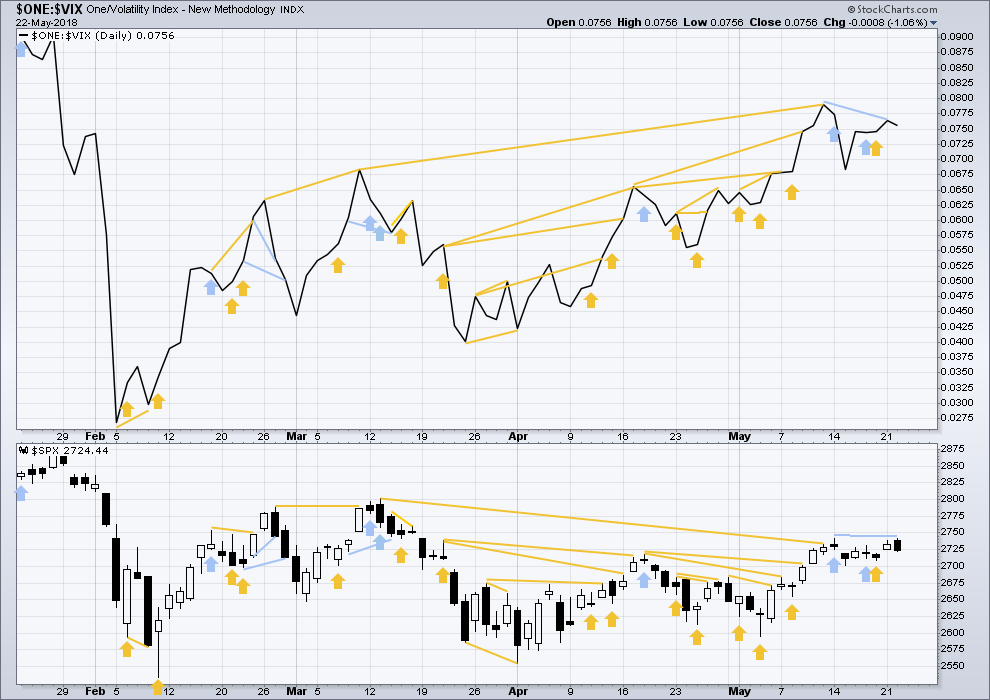
Normally, volatility should decline as price moves higher and increase as price moves lower. This means that normally inverted VIX should move in the same direction as price.
There is still a cluster of bullish signals on inverted VIX. Overall, this may offer support to the main Elliott wave count.
Inverted VIX is much higher than the prior swing high of the 9th / 13th March, but price is not yet. Reading VIX as a leading indicator, this divergence is bullish.
Price today made a new high above the last small swing high on the 14th of May, but inverted VIX has not made a corresponding new high. This divergence is bearish and may be resolved by one or two days of downwards movement.
BREADTH – AD LINE
Click chart to enlarge. Chart courtesy of StockCharts.com.
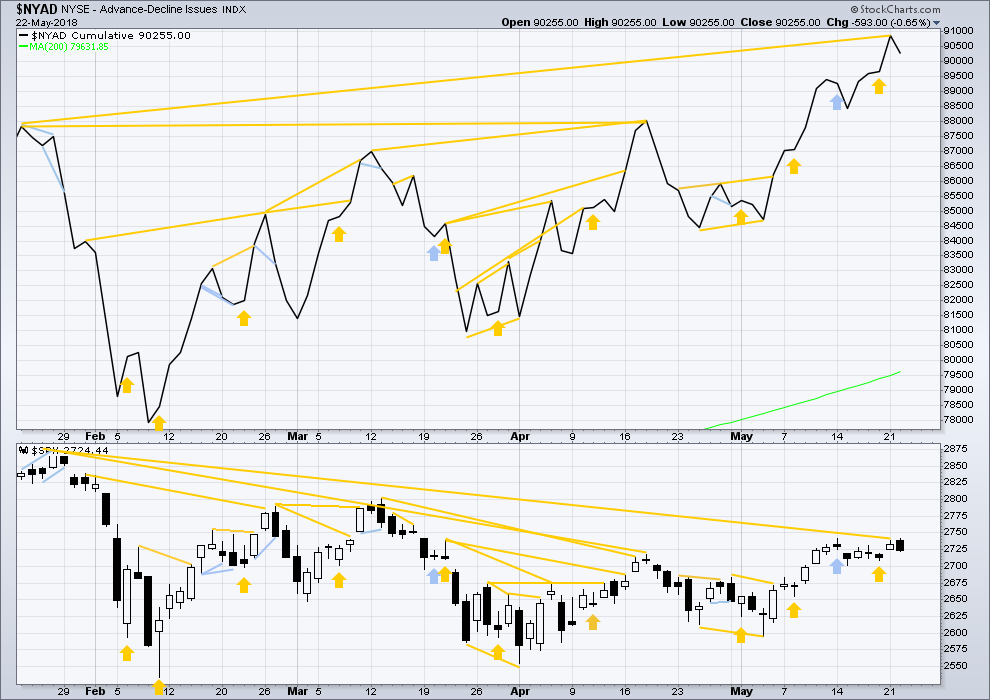
There is normally 4-6 months divergence between price and market breadth prior to a full fledged bear market. This has been so for all major bear markets within the last 90 odd years. With no longer term divergence yet at this point, any decline in price should be expected to be a pullback within an ongoing bull market and not necessarily the start of a bear market. New all time highs from the AD line means that any bear market may now be an absolute minimum of 4 months away. It may of course be a lot longer than that. My next expectation for the end of this bull market may now be October 2019.
Small caps continue to make new all time highs, but mid and large caps have yet to do so. This divergence may be interpreted as bullish. Small caps may now be leading the market.
Breadth should be read as a leading indicator.
There has been a cluster of bullish signals from the AD line in the last few weeks. This also overall offers good support to the main Elliott wave count.
The new strong all time high is extremely bullish and supports the Elliott wave count, which expects price to follow through.
Both price and the AD line moved lower today. The fall in price has support from a decline in market breadth. There is no new divergence here.
DOW THEORY
The following lows need to be exceeded for Dow Theory to confirm the end of the bull market and a change to a bear market:
DJIA: 23,360.29.
DJT: 9,806.79.
S&P500: 2,532.69.
Nasdaq: 6,630.67.
At this stage, only DJIA has made a new major swing low. DJT also needs to make a new major swing low for Dow Theory to indicate a switch from a bull market to a bear market. For an extended Dow Theory, which includes the S&P500 and Nasdaq, these two markets also need to make new major swing lows.
Charts showing each prior major swing low used for Dow Theory may be seen at the end of this analysis here.
Published @ 09:10 p.m. EST.
Here’s a view where the minor 1 completed on the FIRST peak (May 14, not May 22), and the first pullback was the minor 2. The minor 3 then started, with a minute i, then an expanding flat minute 2, now complete. And the push up today is the kickoff of minute 3.
Not my “main”, but until someone tells me what’s wrong with it, I think this is a viable short term alternate that can explain things if price starts surging tomorrow.
Kevin, waiting on Lara TA tonight!
My readings are all supportive of weakness but who knows!
The problem there though is minute ii would be a very rare running flat. The probability must be therefore judged to be very low for any wave count seeing that structure there a complete correction.
And finally, here’s the chart.
I hate to play the devil advocate…but…wondering if 2 has not started yet and we just had an flat (see chart….not a great EW counter but you get the idea). Lara can tell me my mistakes….its welcome.
I’m very interested in Lara TA tonight, whether they are any bullish readings at all! I looked at the bonds yields and they were depressed suggesting that investors were moving to safety! Have to wait for CBOE data to see where the Put/Call ratio lands .
I think the Devil has enough advocates already.
As another possible EW count, the biggest problem I see is the brown iv (circle) is a running flat. That’s a very rare structure, so the probability must be very low.
Thx Lara! Thought i would ask anyways
Good morning everybody. I’m having problems with Motive Wave freezing this morning, maybe because it’s only 8 degrees outside (thats celsius, we’re on the metric system down here).
So it won’t let me prepare a chart.
I’m going to label this bounce today minute b within minor 2.
The target still the same, but may be a little too low.
bitcoin is in a big 2 after a clear 1 up. The 2 just hit and has initiated a possible turn at the 78.6% fibo (11.585 in GBTC). Low risk/high return (high leverage) entry point, if there’s a buy trigger you like.
I had a similar trade today with ETH…. thanks again for the gold chart, I rode a few contracts up today…. still riding one
If you have never seen a brawl between market makers and option traders you just saw one. The market makers tried to shake out option traders holding huge positions short SPY 272.50 puts expiring today. I suspect they are not accustomed to trading against a serious posse! We added to trades and rolled ’em! If they used leverage to ramp prices up they are going to be feeling some pain! Lock and Load! 🙂
Man, maximum manipulation at hand again. The Russell Intra-day is hilarious. Tagged out of vix near the high, reloading now.
makes sense to me, this B wave up is in the 62% retrace zone now. Could be done right here.
No kidding. DJT also popped above resistance but failed to hold it so it looks like a failed bullish break there. RUT did bounce off resistance so we will see how that develops!
So, it looks like we’re getting the classic post-Fed ramp, to be followed by the inevitable sell-off ~20 minutes to half an hour later… This pattern has repeated itself for literally every Fed announcement this year.
Changing the game slightly, it would seem…
Two fibo based time and price based target zones for the bottom of the minor 2. Just my guesstimates based on “common sizes” in both price and time. Note though: the first one sits perfectly on the EW triangle line, where “we expect support”.
Beware the coil….! 🙂
Coil til close AM gap and then the C down?
A few GENERAL pointers.
You should win on credit spreads 80% of the time if you use them correctly.
Obviously the first and most critical consideration is trading WITH the current trend.
Here is the thing that is counter-intuitive and will greatly enhance your returns:
Plan your entry on COUNTER trend moves!
In terms of managing the trade, only two things are important.
1. You were wrong about the trend, in which case you simply exit when your stop is hit.
2. The position is ambushed by your broker or a market maker. If you are trading under 100 contracts this rarely happens.
If you suspect the trade is being attacked, there are three lines of defence I prefer, and there are ways to tell if this is what is going on. It is not unusual for market makers to get together to ambush a big trade. The key is to remember they have a limited window in which to force you to take a loss on the trade.
1. Roll the spread.( very effective and has turned many loosers into winners IF problem is a whipsaw)
2.Widen the spread( good approach if time not an issue)
3. Off-set the trade with an opposite spread to neutralize the loss- sell a put spread if in a call spread, for example.
That, in a nutshell represents some serious dues paying over many years of learning how to trade them…hope it helps! 🙂
I have been trading VS for years and i agree with Verne!
The one thing i will add is that VS are short vega trade and so make sure you enter them on counter moves and when the IV ( implied volatility) is high compared to the realized vol! Tos has a great interface for that.
The other thing i check is where is the current IV vs historical volatility! I sell premium only when i have an IV egde else i rather buy premium i.e use a debit spread.
As far as defending them, you can roll out the strik es and expiry to give you time or buy back some of your shorts to make it a ratio spread! Hope that helps Kevin
Thanks for the notes Jules! I was unsure about how sophisticated to get about managing positions such as buying back short options when the trade moves against the position. In fact that is exactly the way I go about getting positioned for a long option trade but wanted to keep it simple!
Great addition! 🙂
Don’t you mean buying back the short options after the trade moves IN YOUR FAVOR? I.e., you have a short bear call DIA spread. At some point as DIA moves down, you cash your short options at a profit, and hold your long (underwater) options for resumption of the higher timeframe trend. I thought that was your standard game plan, but maybe I misunderstood it?
And thanks Verne and Jules. Sounds like neither of you cares much for using out of the money spreads, as it is a more highly directional trade and definitely lower probability. My FB spread credit was 2.47 credit ($247) and the spread size is 2.5, so $250 risk. So my max loss is $3 (plus commissions). Max win, $247 (minus commissions). I kind of like that. IF FB sells off quickly, I can still make some without getting to the ITM point at expiration (< 154.6 is the magic point where profit levels go almost straight up at expiry). Seems like an awesome way to trade if I believe an impulse down is launching! For this 2 wave, it seems like it has pretty good R/R.
That is exactly right!
Out of the money spreads are actually great for generating steady income. The idea is to have the contracts expire worthless.
I have found with spreads that you enter as a counter-trend trade you do want price to continue against the trend after you enter the trade so you can buy back the short calls (in the case of a bear call spread opened to set up a long position) for less than you paid, lowering your cost basis and holding the long calls for when the trend resumes.
You really end up doing the same thing (perhaps a bit later!) if you opened the spread expecting the calls to expire worthless but were incorrect about the actual trend. In that case buying back the short calls is one way to salvage the trade. Hope that was not too confusing!
Verne (or anyone else), if you have a moment, I’m curious about your views and use of “out of the money” vertical spreads. I’ve deployed one on FB here, Jun 1 expiry, 162.5/165 (credit, and right around the edge of the expected move), it has very interesting properties per the P&L curves shown on ToS and IBS. Any thoughts or warnings about such spreads? Obviously quick downward movement relative to the expiry is key, and/or significant downward movement. But the risk (absolute loss) side is extremely small. Seems reasonable in the face of a 2 wave just starting. But I am definitely in a new space with such a trade and I those P&L curves aren’t necessarily the whole or fully accurate story.
I find it difficult to believe that gold and the SPX are both due to shoot up at the same time given one is a risk-off signal and the other a risk-on signal?
Well, I think you guys all know my answer to that one by now. The assumption that these two markets are correlated? I prefer the math.
I see GLD squeezing, and doing an “touch and turn” off the lower bollinger AND off the 61.8% retrace fibo. A really excellent long set up.
Now waiting for polarity reversal (higher low, higher high) on the 2 minute GLD chart, and a trend line break, to time my long entry.
Two minutes later…a strong pop in price and in like Flynn. We’ll see if all the mumbo-jumbo works, lol!!!
nice call! whats your target ?
I have work to do for that. 1/2 perhaps right at the overhead 200 day sma(124 or so). And then I want to look at typical up swings on the daily, and estimate a likely zone. Probably 125-125.5 area, eyeballing it.
As part of the trade, I bought some NUGT as well, much higher leverage than GLD and generally moves with it.
Fibo retracements for the minor 2. From 3 different swings.
Awesome news. Now we might get both my criteria to go 100% long with 1) a Minor 2 low and 2) just above or touching the triangle’s top boundary line. Perfect setup. But patience must still persist until it actually happens.
My dilemma is that Thursday morning I am leaving (by air) to go to a family wedding in sunny California. I hope Minor 2 moves quickly and completes before I get on the plane. I don’t want to be watching the market on Friday during ‘family time’. If it is not one thing, it is another.
Lara, I am sorry you approach winter when you love summer so much. My area has been getting hot, 90` F +. Too hot too soon for me.
Minor 2 could be over in just 3 days, but I would expect it more likely to last a bit longer. Maybe a Fibonacci 5 days, so Tuesday next week. That might work out nicely for you Rodney.
This is the last winter I’m gonna put up with for a while. Just today bought our tickets to come to the USA then central America next April. I plan on living an endless summer for a few years, and surfing as much warm water as possible. And visiting members in the USA who want to meet up.
Love to meet you Lara when you visit. Kevin and I are in the Bay area so hope you visit SF sometime next year!!!
Don’t forget the B.V.I.! Always lots of sun sand surf! 🙂
Definitely will want to visit B.V.I. And it does have surf!
And if you want to see a mix of desert highlands surrounded by mountains in one of the most productive agricultural areas stop by me. Our area now produces more wine than New York and we are just behind California. Vineyard tours and tasting all over. Since my exact location is a big secret (he he) I will have to tell you where by private transmission.
You and your family have an open invitation in my home with my family.
That is very kind Rodney. I will definitely be emailing you when we arrive in the US next year and arrange to visit. I really want to meet you. I’m sure we shall have a lot of market stuff to talk about!
I have extra sticks if you want to try some SF surfing. Yes there are mellow spots, Linda Mar in Pacifica being the #1. Or…hit Ocean Beach and “charge it”!!! A full suit 4/3 is needed with booties…but it’s “summer inside” after 10 minutes!
That’s very kind Kevin. Cesar and I were married in the USA by his friend who lives in San Francisco. I’ve visited it once before and found it architecturally beautiful, and geographically as well. Love the Redwoods in the area!
I’ll consider travelling with a winter suit, although TBH my current 4:3 is on its last legs and I’m considering making it last just this one last winter…. maybe I’ll bring it just in case we can surf together.
Except I can’t surf short boards. Not enough board for me, and I’ve never learned the skill. If you have something well over 9 foot then I could give it a go…
We’ll have boards with us but when travelling within the US will probably leave them with Cesar’s family in Austin. Lugging a 9’6″ on planes isn’t ideal.
C’mon Kevin. Get the lady a longboard! 🙂